An inner warp in the DoAr 44 T Tauri transition disk
Abstract
Optical/IR images of transition disks (TDs) have revealed deep intensity decrements in the rings of HAeBes HD 142527 and HD 100453, that can be interpreted as shadowing from sharply tilted inner disks, such that the outer disks are directly exposed to stellar light. Here we report similar dips in SPHERE+IRDIS differential polarized imaging (DPI) of TTauri DoAr 44. With a fairly axially symmetric ring in the sub mm radio continuum, DoAr 44 is likely also a warped system. We constrain the warp geometry by comparing radiative transfer predictions with the DPI data in band () and with a re-processing of archival 336 GHz ALMA observations. The observed DPI shadows have coincident radio counterparts, but the intensity drops are much deeper in (88%), compared to the shallow drops at 336 GHz (24%). Radiative transfer predictions with an inner disk tilt of deg approximately account for the observations. ALMA long-baseline observations should allow the observation of the warped gas kinematics inside the cavity of DoAr 44.
keywords:
protoplanetary discs — accretion, accretion discs — planet-disc interactions1 Introduction
Shadows due to central warps have often been invoked to account for protoplanetary disk properties(e.g. Casassus, 2016), such as the low-amplitude modulation of the HST images in TW Hya (Rosenfeld et al., 2012; Debes et al., 2017), or disk orientation changes in different angular scales (e.g. as in GM Aur, AB Aur, or MWC 758, Hughes et al., 2009; Tang et al., 2012; Isella et al., 2010). But the link between shadowing effects and tilted inner disks is best established in transition disks with large inclination changes, i.e. disks with radial gaps that separate an inner disk from an outer disk, and where parts of the outer disk are directly exposed to the star due to a sufficiently inclined inner disk. For instance, a tilt of 70 deg may seem an unlikely phenomenon, yet such is the structure of the record-sized gap in the protoplanetary disk of Herbig Ae/Be (HAeBe) HD 142527, as inferred from the identification of the shadows cast by the inner disk onto the outer ring (Marino et al., 2015). With an established disk orientation, the CO and HCO+ kinematics (Casassus et al., 2013; Rosenfeld et al., 2014) correspond to accretion across the cavity onto the inner disk, and probably through the warp (Casassus et al., 2015). This surprising structure is probably the result of interactions with the low mass companion at 12 AU (mass ratio 1/10, Biller et al., 2012; Close et al., 2014; Lacour et al., 2016). Another dramatic warp, stemming from a sharply inclined inner disk at 72 deg, has recently been reported in HAeBe HD 100453 (Casassus, 2016; Benisty et al., 2017; Long et al., 2017; Min et al., 2017). One or multiply-sided sharp dips are also seen in other sources, such as in GG Tau A (Itoh et al., 2014), or in HD 135344B (Stolker et al., 2016), but their origin is not as clearly connected to shadowing from a stable tilted inner disk as in the case of the two-sided dips.
The frequency of occurrence of such extreme warps is not yet known, since the high-contrast requirements are only beginning to be exploited. Perhaps most disks around small mass ratios binaries () could warp when the migrating companion crosses the resonance between its precession period and that of the inner circumprimary disk (Owen & Lai, 2017). In any case, thanks to accurate knowledge on disk structure and orientation, the sharply warped systems represent an opportunity to understand the physics underlying warped protoplanetary disks in general. What is the response of circumstellar disks under the forcing of an out-of-plane companion? What are the dynamical consequences of shadows deep enough to cool the gas and reduce the pressure locally? What can we learn about disk viscosity? These long standing questions in disk hydrodynamics (Papaloizou & Terquem, 1995; Nixon et al., 2013) require input from concrete observational evidence.
The general goal of understanding the warp hydrodynamics, and connections with the origin of transition disk cavities, motivates the present analysis of a new sharply warped system, this time at T-Tauri masses. As part of our survey of Disks ARound TTauri Stars with SPHERE (DARTTS-S, PI: H. Avenhaus, see Sec. 2), here we report deep decrements in the stellar infrared radiation that is reflected, and polarized, on the outer ring of transition disk DoAr 44 (also called ROXs 44, see Fig. 1a). DoAr 44 is located in the L1688 dark cloud of Ophiuchus (Andrews et al., 2011), so likely close to the distance of pc derived for the Ophiuchus core by Loinard et al. (2008). The ALMA continuum image (van der Marel et al., 2016) shows a fairly face-on orientation (inclination of deg), with a smooth ring and shallow decrements that are strongly modulated by convolution with the synthetic beam, and which we emphasize here with super-resolution in non-parametric image synthesis (Fig. 1b, Sec. 2). With radiative transfer predictions for the SPHERE+IRDIS polarization images and for the 336 GHz continuum images, we confirm that the decrements in polarized intensity cannot be reproduced by radiative transfer effects alone at such low inclinations. Instead, the data can be interpreted in terms of a sharply tilted inner disk, in which part of the outer disk is directly exposed to stellar light (Sec. 3). We discuss the observability of the warped kinematics in the cavity of DoAr 44 (Sec. 4) before summarising our conclusions (Sec. 5).
2 Observations
2.1 Instrumental setups
DoAr 44 was acquired using SPHERE+IRDIS as part of project 096.C-0523(A). The full dataset is described in Avenhaus et al. (2018). Here we report the DoAr 44 observations acquired in band, on March 15 2016, with a total exposure time of 2560 s. The data were reduced following as in Avenhaus et al. (2017) to produce the linear combination of the two orthogonal linear polarizations, which represents an unbiased estimate of the polarized intensity image. This image is shown in Fig. 1a and Fig. 1c, where we also compare with a deconvolved image of the 336 GHz radio continuum. Details on the radio image synthesis are provided in Sec. A and Fig. 9.

While the continuum ring is fairly smooth and is approximately a projected circle viewed close to face-on, the ring is divided into bipolar arcs, separated by broad and deep intensity dips. In this respect, the DoAr 44 decrements are reminiscent of the shadows in HD 142527, which are best seen in near-IR imaging, with only shallow counterparts in the continuum. On the other hand, their coarse and broad shapes in DoAr 44 contrast with the finely drawn inner disk silhouettes seen projected on the outer rings of HD 142527 and HD 100453. If due to a central warp, this difference could reflect the coarser resolution, especially relative to the ring radius, or it could represent a difference in warp geometry, with a shallower inner disk tilt in DoAr 44.
2.2 Radio/IR alignment
The usage of additional frames for centering, with four bright spots imposed by a waffle pattern onto the deformable mirror of SPHERE, ensures that the SPHERE/IRDIS images are centered on the star to within a fraction of a detector pixel (so within 12 mas). In turn, the accuracy of the absolute astrometry of the ALMA data is usually taken as 1/10 the synthetic beam, so in this case about 25 mas.
While at the time of writing a parallax for DoAr 44 is not yet available, the HSOY catalogue (Altmann et al., 2017, based on a preliminary GAIA release) provides astrometric data for DoAr 44 at epoch 2000: J2000 (16:31:33.4635, -24:27:37.222), extrapolated from the position at epoch 2015 and accurate to (4 mas,1 mas), and a proper motion of (-6.329 mas yr-1, -20.013 mas yr-1), with an error of 2.256 mas yr-1. Since the date of the ALMA observations is 2014-07-26 (van der Marel et al., 2016, project ID 2013.1.00100.S), we corrected for proper motion and shifted the image to epoch 2000 coordinates and centered the ALMA images on the expected stellar position.
2.3 Location and contrast of the azimuthal decrements
2.3.1 Azimuthal intensity profiles in polar maps
For a quantitative report of the location of the decrements, we first “deprojected” the data assuming an inclination deg and a disk position angle PA=60 deg, East of North, consistent with the molecular line data presented by van der Marel et al. (2016). This merely corresponds to a stretch of the pixel aspect ratio by a factor perpendicular to the disk PA. We then extracted the ring intensity profile as a function of azimuth along a circle (Fig. 2c and Fig. 7a) that best represents the ring, as we now explain.
The ring radius profile was measured by recording the radial location of the peak intensity111since the cavity is not a perfect circle, we emphasize the dependency on . The measurement of depends on the choice of origin for the polar map. Setting the origin to the nominal stellar position (“stellar centroid” hereafter) may not be the best choice if the cavity center is offset from the star, either because of a positional error, or because of an intrinsic property of the system. We therefore optimized the origin so that the shape of the ring is the closest match to a perfect circle (“ring centroid” hereafter), i.e. we minimized the intensity-weighted dispersion in . We searched for the cavity centers in each dataset with a uniform grid in polar coordinates centered on the nominal stellar position, with a radius of 50 mas. Given a trial origin, we measured the radial location of the intensity maxima by extracting the peak along a constant azimuth , thus providing profiles for the ring radius and peak intensity . We then recorded the root-mean-square dispersion in , using as a weight function, and produced the map for shown in Fig. 3 (for the case of the radio data). The optimal origin corresponds to the minimum in .
Provided with an optimal origin, me measure the average ring radius , again using as a weight function. The profiles were extracted along the circles , and the position of the decrements were recorded with the position of the minima in .
The positions of the decrements are indicated by thin lines in Fig. 2c (and in Fig. 7a). The polar coordinates were then converted back to the sky plane, as indicated with circular markers in Fig. 1, and as listed in Table 1. Fig. 2 also compares the polar maps extracted both around the stellar centroid and around the ring centroids. We see that even such tiny offsets can change the location of the decrements by up to 2 deg.
| Dip 1 (at 1 h) | Dip 2 (at 6.5 h) | |||
|---|---|---|---|---|
| 336 GHz | 336 GHz | |||
| 112% | 826% | 13% | 71% | |
| b | 331.2 | 329.4 | 169.2 | 165.6 |
| c | 336.3 | 328.4 | 169.2 | 165.1 |
| 0.123 | 0.286 | 0.123 | 0.299 | |
a minimum intensity over peak along the ring
b PA of the shadow minimum, in degrees East of North, as viewed on the sky
c PA of a Gaussian centroid for the each shadow, as viewed on the sky, fit within 5 deg of
d stellocentric separation, on the sky and in arcsec, of the formal shadow location, defined as the intersection between direction from the ring centroid, with the best fit circular ring (projected on the sky)
2.3.2 Optimal ring centroids and radii
In the IRDIS images, the ring has a radius , and its centroid offset by =3.8 mas from the star in the direction deg, East of North222so, if the star is at the position given in the HSOY catalogue, or J2000 RA 16:31:33.4635 DEC -24:27:37.2215, then the centroid is at J2000 RA 16:31:33.4637 DEC -24:27:37.2198. This offset is smaller than the upper limit uncertainty in the stellar centering (which is itself better than 12 mas), so that the ring is essentially a circle centered on the star within the instrumental limitations.
Interestingly, trials on the radiative transfer (RT) predictions (Sec. 3) result in similar offsets in , even though in this case the cavity is a perfect circle and the stellar position is known exactly. The RT offset changes with relative inclination between the inner and outer disks. Examples range from at , to at deg, to at deg to at deg.
We caution that the gap is very close to the edge of the coronagraph, such that the shape of the ring could be in part the result of modulation with the coronograph transfer function, which is not necessarily centered exactly on the stellar position. Note, however, that in other disks without central gaps the IRDIS coronagraph does not result in such deep decrements.
The deconvolved 336 GHz continuum ring has a radius ″, and its centroid is offset by =8 mas in the direction =197 deg, which corresponds to a centroid position of J2000 RA 16:31:33.4633 DEC -24:27:37.2287. This offset is quite small, and probably reflects the positional uncertainty of these ALMA data (25 mas rms, Sec. 2.2). Trials on the radio RT predictions resulted in offsets of mas towards deg, and fairly independent of .
2.3.3 Lopsidedness of the 336 GHz ring?
At 336 GHz the northern side of the disk is somewhat brighter relative to the south, by 17%, as estimated from Fig. 2c (and Fig. 7a) by comparing the peak intensity at 7 deg with 200 deg (outside the decrements). Given the astrometric uncertainty of the radio data (see Sec. 2.2), this could be due to varying stellar irradiation in an offset ring, which would require a ring centroid offset towards the South by about 40 mas (if the continuum emission is proportional to the dust temperature and if ). The enhanced brightness of the northern side could also be related to the disk orientation, if the northern side is the far side. A difference in brightness towards the exposed inner edge of the ring would require a fairly optically thick continuum. As discussed in detail in Sec. 3, the RT predictions (in Fig. 7) do not support this interpretation. Alternatively, the surface density of the ring may also be moderately lopsided as, for instance, in SR 21 (van der Marel et al., 2015).
2.3.4 Depth of the decrements
The depths of the decrements can be estimated from the contrast ratio between the local minimum and the peak along the ring. While the IR decrements are quite deep, dropping by %, the radio decrements are rather shallow, with an average drop of only % (the uncertainty spans the difference in the two decrements). Note that on such small scales, with an inner working angle that borders the coronagraph, the measurement of the true depth in is affected by the tails of the PSF, so that the observed values should be considered as lower limits. Likewise, finer angular resolution in the radio continuum could result in deeper decrements.
The uncertainties in the depth of each decrement recorded in Table 1 were estimated in the following way. For the DPI decrements, we used the rms scatter observed in the plateau around PA60 deg, which is at 2% of the peak. The thermal noise in the radio maps is also very low. The S/N is about 100 in the Clean image. Likewise, the S/N is also very high in the deconvolved model images, about 50, as estimated by taking statistics on the RT simulations in 100 different realisations of noise (see Sec. 2.3.6). However, this S/N in the radio profiles ignores the systematics of the deconvolution procedure, so is an upper limit from the thermal noise only. A lower limit to the S/N can be estimated from the observed profile itself, if we assume that it should be the same as the RT predictions, so that any structure in addition to the shadow decrements is noise. If we take the deepest local minimum, at PA=67.7 deg, as a 1 deviation, then the noise in the deconvolved radio profile is 6%. The actual noise level in the deconvolved radio profiles is probably in-between 2% and 6%, but we record the most conservative value.
2.3.5 Position angle joining the decrements, and radio/IR shift
As mentioned above, the position of each decrement, as estimated from the profiles, depends on the choice of origin. In addition, for a tilted inner disk the line joining both shadows is known to be offset from the star in optically thick scattering on the disk surface, as in , and at finite outer disk inclination (Marino et al., 2015; Min et al., 2017). We therefore report the position angle joining both decrements in each dataset333note, however, that the profile still depends on the choice of origin. Despite the small offsets, the minima vary in position appreciably, as illustrated in Fig. 4, where we also indicate their position with a stellar center. Another example of these variations is shown for the observations in Fig. 2c.. The direction of this line at a given wavelength can be estimated from the information in Table 1.
Interestingly, appears to be very close in the radio and in the IR. deg in 336 GHz, and deg in , as measured East of North, resulting in a difference of only deg. The uncertainty in corresponds to the difference with the Gaussian centroids near the position of each minimum. Note that this uncertainty does not consider the impact of systematics, such as the plane filtering in the radio data, or varying Strehl ratio in . For instance, the profile for the restored map (which is comparable to a standard Clean image), shown in Fig. 2c, corresponds to decrements at a PA of deg, which is clearly the result of convolution with a coarse and elongated beam.
2.3.6 Biases from finite angular resolutions and plane filtering
In order to estimate the bias from plane filtering, we simulated the same coverage on the RT predictions at 336 GHz (Sec. 3, for a titled inner disk), adding Gaussian noise in the model visibilities as given in the observations (using the scatter estimated with CASA task statwt). The input image in native resolution and example simulations are shown in Fig. 10. The result of these Monte Carlo simulations, with 100 different realisation of noise, is that the (simulated) shadow PA is deg, while in the input RT model, at native resolution, . Decreasing the relative importance of regularization to , instead of used in the data (see Sec. A for definitions) results in , in closer agreement with the input. We nonetheless adopt the reconstruction with for the data since it provides a smoother image while preserving thermal residuals (see Fig. 9), at the cost of biasing the shift in PA between the radio and the IR shadows.
The bias in due to convolution with the point-spread-function (PSF) in is more difficult to estimate because the PSF is not known as well as in the ALMA data. While flux frames were taken at the beginning and end of the 2 exposures, the centering of these PSFs is difficult to ascertain, and they are bound to vary significantly with Strehl ratio during each exposure. Still, we can estimate the bias in by comparing the native RT with the diffraction-limit. A trial on our best synthetic , smoothed at the diffraction limit, results in deg. In turn, is preserved in a synthetic smoothed at 1/10 the diffraction limit, even though the cavity is smaller than in the coarser case. We conclude that no significant bias is injected by smoothing with a circular PSF at the diffraction limit, but that in practice PSF elongation is bound to inject some bias in .
The observed radio decrements would thus appear to be essentially coincident with the deeper decrements seen in polarized intensity, given the small offset in azimuth deg. While in the RT predictions at native resolutions we have deg, the -plane filtering bias leads to , which is consistent with the observations. We note that any contribution to from the finite cooling timescale of the shadowed dust, which is responsible for the sub mm continuum dips, appears to be negligible.
3 Radiative transfer model
3.1 Parametric model
It could be thought that the two DPI arcs in DoAr 44 correspond merely to the double-lobed structure along the disk PA expected in polarized intensity at finite inclination. An example of such morphologies can be seen in HD 100546 (Garufi et al., 2016; Mendigutía et al., 2017), at an inclination of 44 deg. In DoAr 44, the PA joining the decrements is deg, so quite close to 90 deg from the disk PA, which is 60 deg. However, from Sec. 2.3 and Table 1 we see that the decrements in do not divide the long axis equally: the triangle formed by the star and each decrement has an angle at the stellar vertex of deg in the plane of the outer disk. Also, the outer disk has a fairly low inclination of 20 deg (we confirm this value by checking that the sub-mm ring is indeed a circle projected by this angle, see Fig. 2). We therefore constructed an RT model to check if the DPI structure of DoAr 44 could be understood from simple radiative transfer effects, or else required a change in disk inclination.
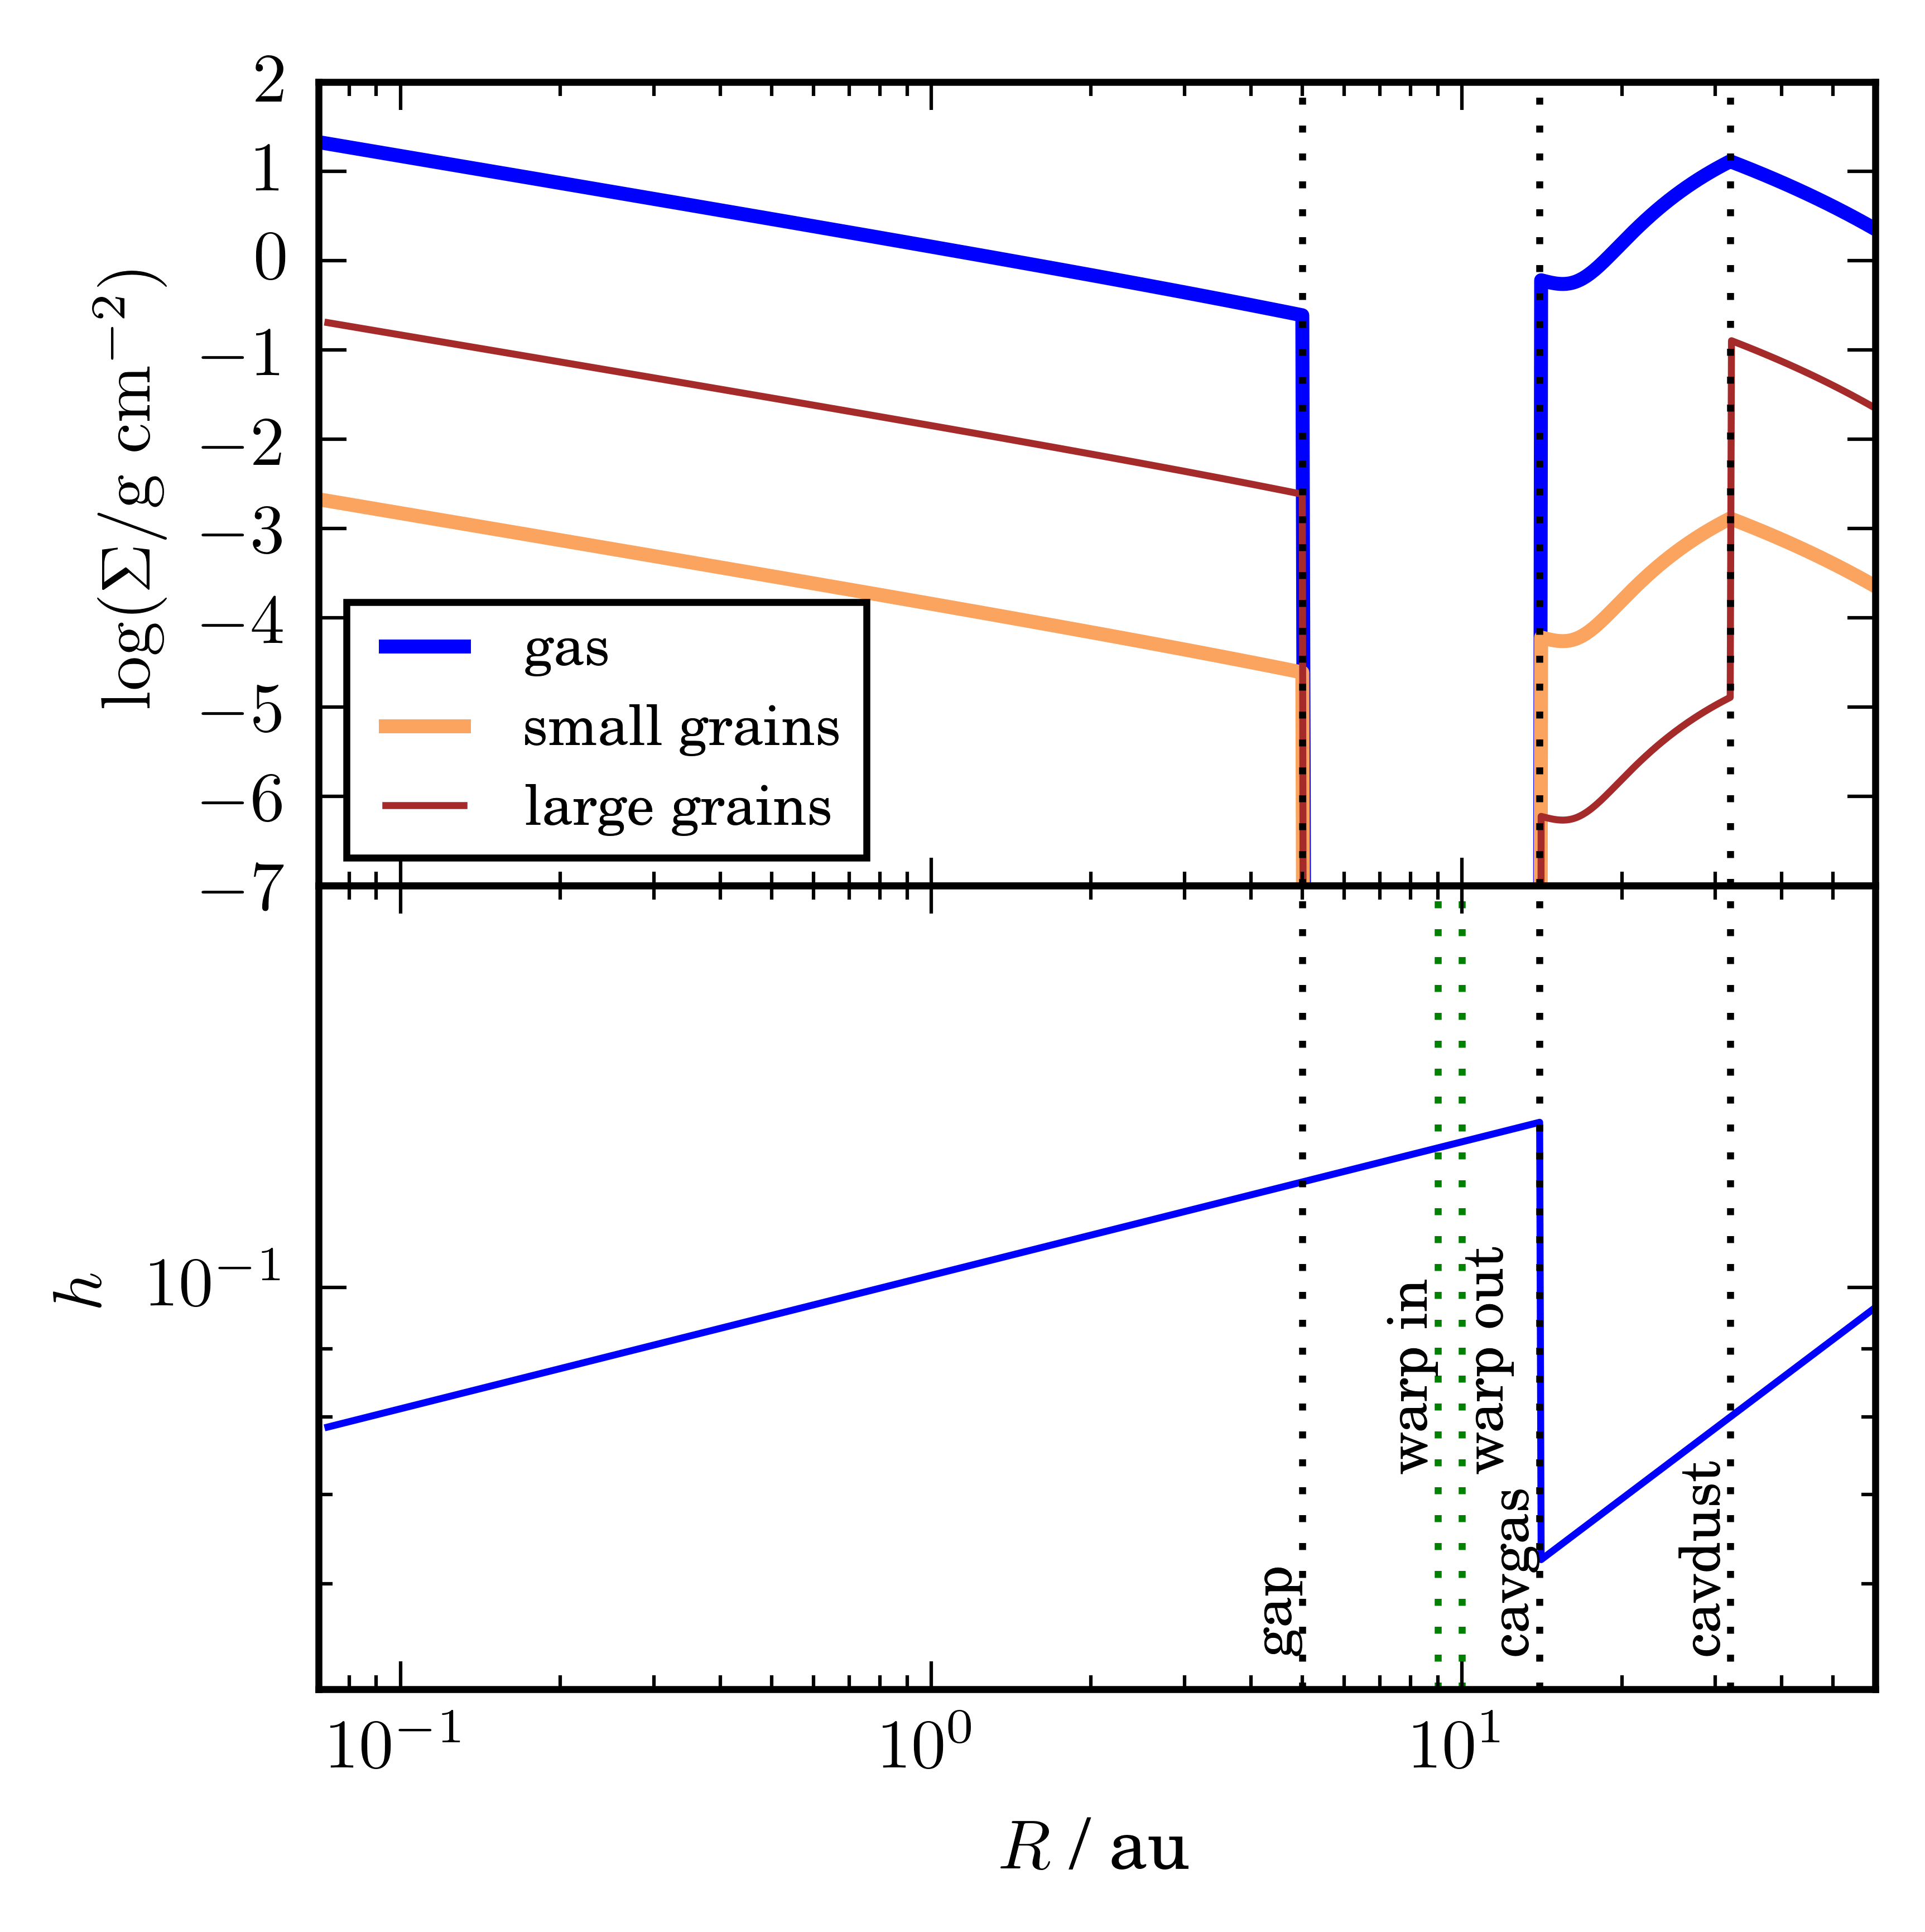
The RT model follows from van der Marel et al. (2016). We initially implemented their parametrization for the dust, including two populations of grains (small and large), and confirming their SED for a planar disk. However, by exposing the outer ring directly to the star, an inner disk tilt boosts the far-IR flux densities by a factor of 10. Additionally, the two-step-function gas density profile proposed by van der Marel et al. (2016) results in a double concentric ring structure in optical/IR scattered light. We therefore proceeded to modify this parametric model for a flatter outer ring, with lower scale height, and with a cubic taper inside the cavity (so different from the gradual drop implemented in van der Marel et al., 2016). Since the small grains inside the cavity shield the outer ring, we required very little settling to raise the temperature of the large grains (i.e. with , see Eq. 5). Another modification is that we used a Kurucz model atmosphere for the stellar spectrum (Kurucz, 1979; Castelli et al., 1997), with K, , and with a stellar radius of . Accretion luminosity was parametrised as in van der Marel et al. (2015). More details on this RT model are given in Sec. B.
The radial profiles in Fig. 5 summarise the main features of this parametric model, which we required to be consistent with the SED (Fig. 11 and Table 2). The inner disk is tilted by defining a variable disk orientation that is a function of cylindrical polar radius, in the frame of the outer disk (as in Marino et al., 2015; Casassus et al., 2015). In our best model (see Sec. 3.2), the relative disk inclination and orientation connect linearly from at to deg at . At the time of writing no high resolution 12CO data is available to constrain the location of the transition in DoAr 44.
The stellar radiation was transferred through the synthetic disk model using the RADMC3D RT package (Dullemond et al., 2015). We calculate equilibrium grain temperatures and emergent specific intensity maps. The radio images at 336 GHz were calculated with Henyey-Greenstein scattering. However, for the calculation of the Stokes images at 1.6m we used the scattering matrix (but only incorporating the small dust as a source of opacity), and post-processed for (as described in Avenhaus et al., 2017, with a focal plane mask of 0.1 arcsec in radius). These predictions are illustrated in Fig. 4.
As mentioned above, a modulation of the polarized intensity is expected at finite disk inclination, resulting in bipolar arcs along the disk PA. In order to check for this possibility, we calculated synthetic images without the inner disk, and keeping all other parameters equal. In Fig. 6a, we see that at the observed inclination of 20 deg, only very shallow decrements are produced by RT effects alone. Higher inclinations of 40 deg are required to reach deep decrements, of 80%, as in Fig. 6b. However, these deeper decrements are quite different from the observations: they are much broader, aligned with the star, and each have different depths. Most importantly, the inclination of the submm ring is 20 deg and not 40 deg. In Fig. 6c we consider the possibility of a warp inside the outer ring, such that the relative disk inclination changes by 60 deg inside the cavity. All of these predictions clearly differ from the observations, so that we conclude that a tilted inner disk provides the most simple explanation.

3.2 Relative disk inclination
As explained in this Section, we adopted deg, and an inner disk PA in the plane of the outer disk of deg (Sec. 3.2.1). Given the outer disk orientation [deg, deg], this choice corresponds to an inner disk orientation [ deg, deg]. We also attempted to use directly the location of the decrements, using the formulae in Min et al. (2017), but the systematics hamper constraining the inner disk orientation in DoAr 44 with the later method, as detailed in (Sec. 3.2.2).
3.2.1 Limits from the lengths of the bipolar DPI arcs
In Figs. 4 and 7 we note the impact of the relative disk inclination on the DPI profile of the ring. Small values of correspond to broader decrements and asymmetric bipolar emission arcs. We therefore use the length of the arcs in to constrain the relative disk inclination. We explored a range of inner disk tilt angles, and found that the lengths of the arcs in varies significantly with inner disk tilt. The length of each arcs, East and West, can be estimated with their standard deviations (after subtracting a linear baseline joining the two local minima): deg and deg, with a ratio . Large relative inclinations result in almost equally long arcs, with at deg, and at deg. For deg, the arcs are too short (and the shadows are too wide), with deg. A relative inclination of 30 deg thus seems to be a good compromise, with and deg. We conclude that the relative disk inclination is likely deg.
An alternative indicator of model quality could be the ratio of peak intensities along each arc, but the RT predictions do not take into account the possibility that the disk is lopsided, which directly impacts on the azimuthal profiles. The observed peak intensities are equal on both sides, which would require a very abrupt tilt with deg, and would result in narrow decrements (as in HD 100453 and HD 142527).
3.2.2 Geometry inferred assuming perfect circles
The location of the shadows in can in principle be used to infer the geometry of the warp. They should approximately correspond to the intersection of the inner disk midplane with a perfectly circular outer disk, offset to the altitude of the unit-opacity surface. The formulae in Min et al. (2017) relate the inner disk orientation, given by its inclination and its PA on the sky , and the outer disk scale height, with the observed shadow position angle , the angle they subtend relative to the star (and in the plane of the outer disk), and the stellar offset (measured as the intercept of the inner disk PA with the North, at the stellar right ascension).
In practice, however, the cavity is not perfectly circular, the ring may be lopsided, and the center of the cavity is difficult to ascertain. For instance, the small stellar offset from the center of the cavity measured in , of only 3.8 mas (Sec. 2.3), is likely not significant and yet has an important impact on the inferred inner disk orientation. Another source of uncertainty is the exact position of the center of the shadows, especially for such broad decrements as in DoAr 44. The decrement minimum is not necessarily in the midplane of the inner disk, since the observed decrements are probably affected by the coronagraph transfer function, and also by the self cancellation of extended disk emission in the calculation of at separations comparable to the PSF (e.g. Avenhaus et al., 2017).
Notwithstanding the above caveats, we solved for the optimal inner disk orientation in DoAr 44 using the observed values in : arcsec, deg, . We sampled the posterior distributions in inner disk orientation and outer disk scale aspect ratio using the emcee package Foreman-Mackey et al. (2013). Even such optimistic uncertainties, which do not include the systematics listed in the above paragraph, lead to rather loose constraints on the inner disk orientation: deg, deg, , where the uncertainties correspond to the confidence intervals444Note, however, that the posterior distribution in was arbitrarily truncated to . The distribution of relative disk inclinations corresponds to deg. Our sign convention for disk inclination is that a positive value corresponds to a counter-clockwise rotation along the disk PA (so opposite to the convention used in Min et al., 2017). As a comparison point, another application of the same technique to the parameters in HD 100453, deg, deg, , deg 555the value for HD 100453 was inferred from the optimal solution proposed by Min et al. (2017), deg (Benisty et al., 2017), yields deg, deg, (or au), and a relative disk inclination deg. While these values are in agreement with the inner disk orientation inferred by Min et al. (2017), we see that even optimistic errors on the location of the shadows yield very large uncertainties. In HD 100453, the star is clearly offset from the cavity center, which should result in a bias that is not contemplated in this error budget.
4 Discussion: Observing the warped hydrodynamics
Accurate knowledge of the warp kinematics is required to guide research on the physics of warps in protoplanetary disks, and their possible connection with the origin of large cavities in general. Following the proposition of Owen & Lai (2017), it is possible that some of the large transition disk cavities could be evacuated by misaligned companions. Indeed, Price et al. (2018) show, using state-of-the-art 3D hydrodynamics, that the misaligned companion HD 142527B explains all key properties of that system, including the inner disk tilt.
Unfortunately the existence of close-in companions is very difficult to test with high-contrast imaging: even at stellar mass ratios of , the detection of HD 142527B was only possible thanks to instrumental breakthroughs (Biller et al., 2012; Close et al., 2014). The ring of DoAr 44 is already at separations that are close to the inner working angles of even the latest next-generation AO cameras, hampering further detailed observations in the optical/IR.
Residual intra-cavity gas is also very difficult to trace in 13CO, since there is a significant decrease in gas density inside the cavity, seen as drop in 13CO emisison (van der Marel et al., 2016, their Fig. 5), whereas 12CO emission is more optically thick and thus likely to peak inside the cavity. We may thus trace the intra-cavity kinematics in 12CO. As reported by Salyk et al. (2015), the inner disk of DoAr 44 is molecular, with ro-vibrational emission from gaseous CO and H2O vapor requiring large columns of H2 gas.
The fairly high accretion rate of M⊙ yr-1 in DoAr 44 (Manara et al., 2014) would deplete the total gas mass of the inner disk, of M⊙, in less than 500 yr (assuming a standard gas to dust ratio of 100 and the model of Sec. 3). This depletion time is about a couple of orbits of the outer ring, which would make the observation of the inner disk a very unlikely phenomenon. Thus, material must cross the cavity and replenish the inner ring, much like in HD 142527. In steady state, the radial and infalling velocity component is directly linked to the surface density profile, , so that the gap should correspond to fast radial infall.
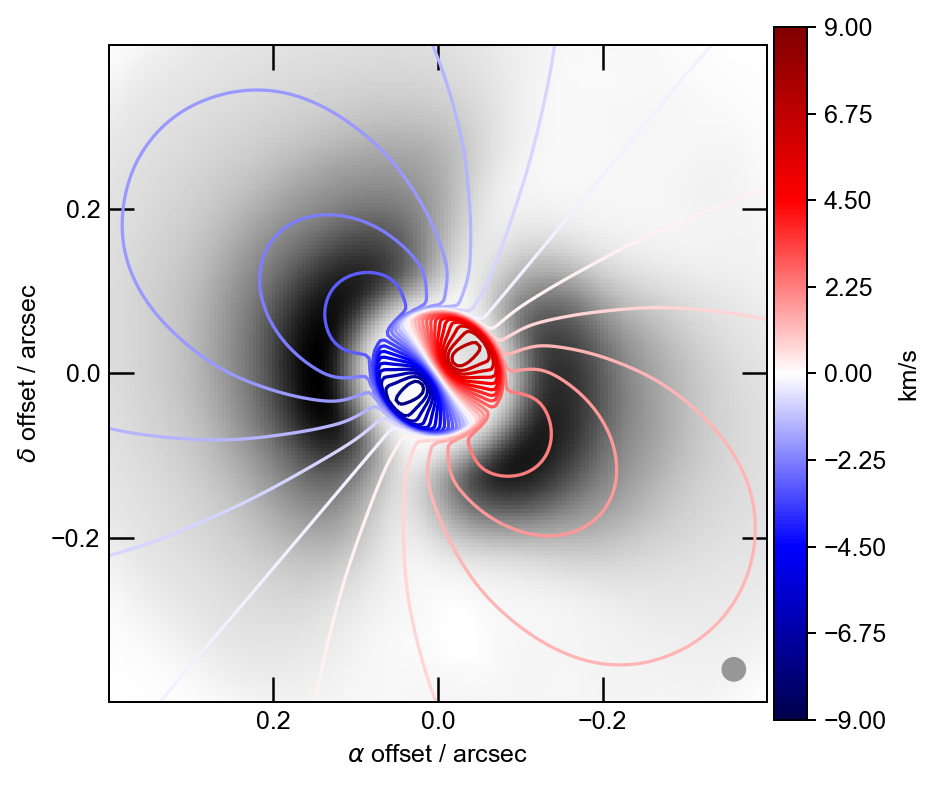
Even without the incorporation of a radial velocity component, i.e. in pure Keplerian rotation, the proposed inner disk tilt in DoAr 44 should be detectable with ALMA in 12CO(6–5), as shown in Fig. 8 (we confirmed that the integrated line profile of the synthetic 13CO(3-2) is consistent with that reported by van der Marel et al., 2016). The higher J lines are preferred to minimize absorption by diffuse ISM screens, especially in the direction of Ophiuchus at km s-1, so close to the systemic velocity of DoAr 44 (km s-1). The RT predictions for CO(6-5) have been smoothed to a 30 mas beam, which is the best possible with ALMA in band 9. We see that the tilt of the inner disk should correspond to a shift in PA, and to a discontinuity in the velocity pattern. Any residual absorption by the diffuse screen near systemic velocity would not affect the higher velocity channels. Incidentally, the apparent PA of the inner disk is not coincident with the direction of the optical/IR shadows, an effect already noted by Min et al. (2017).
The intra-cavity velocity field of DoAr 44 is unlikely to be Keplerian, and should bear similarities to HD 142527. We have already mentioned the need for infall to replenish the inner disk. In addition, in a continuous warp material must be accelerated from one plane to the other. So inside a warp there should be a velocity component orthogonal to the plane of the disk . Interestingly, the inclusion of improves the model of HD 142527, the only warp for which we have data, with fairly point-symmetric high velocity ridges connecting the cavity ‘twist’ with the inner disk, which are missing in a model without (the ‘slow warp model’ in Casassus et al., 2015, see their Figs 1 b and 1 d.). We expect similar features in DoAr 44. Resolved observations in CO(6-5) would thus inform on the detailed structure of the warp: the range of stellocentric radii where the disk breaks from one plane to the other, and the radial velocity field. We may even expect azimuthal modulations in HCO (as in the HCO+(4-3) filamentary structures seen in HD 142527 Casassus et al., 2013), if the gas connects the two orientations along streamers.
5 Conclusions
New DPI imaging of T Tauri star DoAr 44 with SPHERE+IRDIS reveals deep azimuthal decrements in . These dips have a counterpart in the radio continuum at 336 GHz. The observed DPI decrements are much deeper than in the radio: while the intensity drops by 88% in , the radio dips in the deconvolved images are relatively shallow, with a drop of 24% at 336 GHz. The location of the optical and radio decrements are coincident, within fairly narrow uncertainties, and including image synthesis biases. A parametric model with a central warp provides a simple explanation for these features. We conclude that an inner disk tilt of deg accounts for the observations.
Acknowledgments
We thank the referee for constructive comments and improvements to the article, and also Drs. Martin Altmann, René Mendez and Edgardo Costa for pointing us to the HSOY catalogue. This work makes use of archival ALMA data from project 2013.1.00100.S. Financial support was provided by Millennium Nucleus RC130007 (Chilean Ministry of Economy), and additionally by FONDECYT grants 1171624 and 1171841. This work used the Brelka cluster, financed by FONDEQUIP project EQM140101, and hosted at DAS/U. de Chile. SP acknowledges CONICYT-Gemini grant 32130007. H.A. acknowledges support from NCCR PlanetS supported by the Swiss National Science Foundation. PR acknowledges CONICYT PAI project 79160119.
References
- Altmann et al. (2017) Altmann M., Roeser S., Demleitner M., Bastian U., Schilbach E., 2017, A&A, 600, L4
- Andrews & Williams (2007) Andrews S. M., Williams J. P., 2007, ApJ, 671, 1800
- Andrews et al. (2011) Andrews S. M., Wilner D. J., Espaillat C., Hughes A. M., Dullemond C. P., McClure M. K., Qi C., Brown J. M., 2011, ApJ, 732, 42
- Avenhaus et al. (2017) Avenhaus H., et al., 2017, AJ, 154, 33
- Avenhaus et al. (2018) Avenhaus H., et al., 2018, preprint, (arXiv:1803.10882)
- Benisty et al. (2017) Benisty M., et al., 2017, A&A, 597, A42
- Biller et al. (2012) Biller B., et al., 2012, ApJ, 753, L38
- Cárcamo et al. (2018) Cárcamo M., Román P. E., Casassus S., Moral V., Rannou F. R., 2018, Astronomy and Computing, 22, 16
- Casassus (2016) Casassus S., 2016, PASA, 33, e013
- Casassus et al. (2006) Casassus S., Cabrera G. F., Förster F., Pearson T. J., Readhead A. C. S., Dickinson C., 2006, ApJ, 639, 951
- Casassus et al. (2013) Casassus S., et al., 2013, Nature, 493, 191
- Casassus et al. (2015) Casassus S., et al., 2015, ApJ, 811, 92
- Castelli et al. (1997) Castelli F., Gratton R. G., Kurucz R. L., 1997, A&A, 318, 841
- Close et al. (2014) Close L. M., et al., 2014, ApJ, 781, L30
- Cutri & et al. (2012) Cutri R. M., et al. 2012, VizieR Online Data Catalog, 2311
- Debes et al. (2017) Debes J. H., et al., 2017, ApJ, 835, 205
- Draine (2003) Draine B. T., 2003, ApJ, 598, 1026
- Dullemond et al. (2015) Dullemond C., Juhasz A., Pohl A., Sereshti F., Shetty R., Peters T., Commercon B., Flock M., 2015, RADMC3D v0.39 http://www.ita.uni-heidelberg.de/ dullemond/software/radmc-3d/
- Evans et al. (2014) Evans II N. J., et al., 2014, VizieR Online Data Catalog, 2332
- Foreman-Mackey et al. (2013) Foreman-Mackey D., Hogg D. W., Lang D., Goodman J., 2013, PASP, 125, 306
- Garufi et al. (2016) Garufi A., et al., 2016, A&A, 588, A8
- Hughes et al. (2009) Hughes A. M., et al., 2009, ApJ, 698, 131
- Isella et al. (2010) Isella A., Natta A., Wilner D., Carpenter J. M., Testi L., 2010, ApJ, 725, 1735
- Ishihara et al. (2010) Ishihara D., et al., 2010, A&A, 514, A1
- Itoh et al. (2014) Itoh Y., et al., 2014, Research in Astronomy and Astrophysics, 14, 1438
- Kurucz (1979) Kurucz R. L., 1979, ApJS, 40, 1
- Lacour et al. (2016) Lacour S., et al., 2016, A&A, 590, A90
- Li & Greenberg (1997) Li A., Greenberg J. M., 1997, A&A, 323, 566
- Loinard et al. (2008) Loinard L., Torres R. M., Mioduszewski A. J., Rodríguez L. F., 2008, ApJ, 675, L29
- Long et al. (2017) Long Z. C., et al., 2017, ApJ, 838, 62
- Manara et al. (2014) Manara C. F., Testi L., Natta A., Rosotti G., Benisty M., Ercolano B., Ricci L., 2014, A&A, 568, A18
- Marino et al. (2015) Marino S., Perez S., Casassus S., 2015, ApJ, 798, L44
- Mendigutía et al. (2017) Mendigutía I., et al., 2017, preprint, (arXiv:1711.00023)
- Min et al. (2017) Min M., Stolker T., Dominik C., Benisty M., 2017, A&A, 604, L10
- Nixon et al. (2013) Nixon C., King A., Price D., 2013, MNRAS, 434, 1946
- Owen & Lai (2017) Owen J. E., Lai D., 2017, MNRAS, 469, 2834
- Papaloizou & Terquem (1995) Papaloizou J. C. B., Terquem C., 1995, MNRAS, 274, 987
- Price et al. (2018) Price D. J., et al., 2018, MNRAS,
- Rosenfeld et al. (2012) Rosenfeld K. A., et al., 2012, ApJ, 757, 129
- Rosenfeld et al. (2014) Rosenfeld K. A., Chiang E., Andrews S. M., 2014, ApJ, 782, 62
- Salyk et al. (2015) Salyk C., Lacy J. H., Richter M. J., Zhang K., Blake G. A., Pontoppidan K. M., 2015, ApJ, 810, L24
- Stolker et al. (2016) Stolker T., et al., 2016, A&A, 595, A113
- Tang et al. (2012) Tang Y.-W., Guilloteau S., Piétu V., Dutrey A., Ohashi N., Ho P. T. P., 2012, A&A, 547, A84
- Yamamura et al. (2010) Yamamura I., Makiuti S., Ikeda N., Fukuda Y., Oyabu S., Koga T., White G. J., 2010, VizieR Online Data Catalog, 2298
- Zacharias et al. (2013) Zacharias N., Finch C. T., Girard T. M., Henden A., Bartlett J. L., Monet D. G., Zacharias M. I., 2013, AJ, 145, 44
- van der Marel et al. (2015) van der Marel N., van Dishoeck E. F., Bruderer S., Pérez L., Isella A., 2015, A&A, 579, A106
- van der Marel et al. (2016) van der Marel N., van Dishoeck E. F., Bruderer S., Andrews S. M., Pontoppidan K. M., Herczeg G. J., van Kempen T., Miotello A., 2016, A&A, 585, A58
Appendix A ALMA image synthesis
In their original resolution the ALMA 336 GHz continuum observations show interesting structure along the ring (van der Marel et al., 2016). However, the beam is comparable to the ring radius, and strongly smooths out the intensity profile along the ring. Since the source is relatively bright, with a peak specific intensity of 0.29 Jy beam-1 in natural weights (with a beam of ) and a dynamic range , we attempted to super-resolve the continuum data using our uvmem package (Casassus et al., 2006, 2015; Cárcamo et al., 2018), which is part of the family of algorithms based on maximum-entropy regularization. Here we used the GPU adaptation from Cárcamo et al. (2018), and regularized by minimizing the Laplacian of the model image, with the following objective function:
| (1) |
In Eq. 1, is the total number of observed visibilities , each with a weight . are the model visibilities, calculated on the model image , which is itself directly related to the free parameters , where is the thermal noise in the natural-weights dirty map. The dimensionless parameter controls the relative importance of the regularization term, which we chose here as the image Laplacian:
| (2) | |||||
| (3) |
where and are the image pixel sizes.
After self-calibration of the full continuum dataset (ALMA project ID 2013.1.00100.S, van der Marel et al., 2016), we obtained the image shown in Fig. 9. We chose , which is the highest value that preserved thermal residuals. The super-resolved version of the 336 GHz continuum data provides improved visualization of the structure modulating the ring, at levels that are closer to its intrinsic contrast.

As explained in Sec. 2.3, the impact on the position of the radio decrements due to the -plane filtering and our choice of regularization was estimated with Monte Carlo simulations on the RT model. Fig. 10 gives an example, for one realization of noise, for both plain (with positivity), and with Laplacian regularization.
Similarly, we also estimate the effective angular resolution of the model image by simulating on a spike, whose flux is set to the peak intensity along the outer ring in Jy beam-1, including the addition of noise. After fitting an elliptical Gaussian, we obtained an effective angular resolution of . This angular resolution depends on the level of the signal, but in general it varies between and times the clean beam in natural weights (Casassus et al., 2015; Cárcamo et al., 2018).

Appendix B Parametric RT model
| (mJy) | (m) | |
|---|---|---|
| USNOa | 11.9, 34.63, 16.9, | 0.43 , 0.54 , 0.47, |
| 61.04, 119.35 | 0.62 , 0.75 | |
| 2MASSb | 323, 515, 602 | 1.23, 1.66, 2.16 |
| IRACc | 620, 540, 489, 673 | 3.6 , 4.5 , 5.8 , 8 |
| WISEc | 601.5, 582.9, | 3.4 , 4.6 , |
| 778.4, 2055 | 12 , 22 | |
| MIPSc | 1690, 2560 | 24 , 70 |
| AKARId,e | 1459, 3874, 3638 | 18 , 65 , 90 |
| ALMAf | 183.77 | 880 |
| JCMTg | 105 | 1300 |
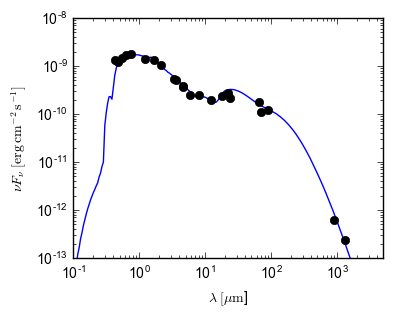
Fig. 11 and Table 2 summarise the available information from the spectral energy distribution (SED). Fig. 11 also includes the RT prediction from the warped model that we propose for DoAr 44. Here we proceed to described the model in detail.
The gas density profile is parametrised in cylindrical coordinates,
| (4) |
where the double primes denote coordinates in a transformed coordinate system . This frame is obtained by rotating the outer disk frame , whose plane correspond to the midplane. We rotate by around , to an intermediate frame , and then by around . The disk scale height is
| (5) |
where is a settling parameter (as in Andrews et al., 2011). The surface density profile is the usual,
| (6) |
in which implements a gradual gas drop inside the cavity,
| (7) |
with inside , and elsewhere.
We considered two dust populations, with sizes corresponding to small and large grains. The small dust is assumed to be coupled with the gas, while the larger grains are affected by moderate settling, corresponding to . Large grains are assumed to be rarefied inside the cavity, by a factor . Grain optical properties were calculated using 70% astro-silicates, and 30% amorphous carbon, with optical constants from Draine (2003) and Li & Greenberg (1997), and mixed using the Bruggeman formula for a solid density of 2.9 g cm-3. The resulting grain opacity is 3.1 g cm-2 at 1300 m.
Parameter values are given in Table 3. We caution that this parametric model is meant to demonstrate that the data can be interpreted in terms of a tilted inner disk, with constraints on the inner disk orientation based on the morphology of the shadows (Sec. 2.3). Hence we do not explore parameter space to place uncertainties on each parameter.
| 0.12 | 0.1 | 1 | |||
| 0.12 | 0.1 | 1 | |||
| 0.08 | 0.3 | 1 | |||
| 0.08 | 0.3 | 1 | 1 |
| 0.07 | 5 | 9 | 10 |
|---|
| 14 | 32 | 60 | 25 |
| small dust | (0.005,1) | 1 | 0.01 | 1 |
| large dust | (0.005,1000) | 0.8 | 0.99 |
a radius units are in AUs
b this narrow warp is chosen where the gas density is set 0, out of lack of observational data
c range of grain radii, given in m, with a distribution
d mass fraction of each dust population
e dust depletion factor for
f the gas surface density ar is g cm-2