The GALAH and TESS-HERMES surveys: high-resolution spectroscopy of luminous supergiants in the Magellanic Clouds and Bridge
Abstract
We report the serendipitous observations of 571 luminous supergiants in the Magellanic Clouds by the spectroscopic GALAH and TESS-HERMES surveys: 434 stars in the Large Magellanic Cloud and 137 in the Small Magellanic Cloud. We also find one star that appears associated with structured star formation in the Magellanic Bridge. Both of these surveys are aimed at the local volume of the Galaxy but have simple, magnitude-limited selection functions that mean they include some observations of luminous extra-Galactic stars. The surveys determine stellar parameter and abundances using The Cannon, a data-driven generative modelling approach. In this work, we explore the results from The Cannon when it is fed the spectra of these intrinsically luminous supergiants in the Magellanic Clouds, which are well outside the normal bounds of The Cannon’s training set. We find that, although the parameters are astrophysically incorrect, the and the abundances of lithium, barium, and magnesium are excellent discriminants of these stars. It shows that in the future, with an expanded training set, it should be possible to determine accurate values for these types of stars.
keywords:
Magellanic Clouds1 Introduction
The Large and Small Magellanic Clouds (LMC and SMC) are the two most massive satellite galaxies of the Milky Way, and provide a unique laboratory for studying a wide range of astrophysical processes. Unlike most other external galaxies, individual stars can be resolved and studied with moderate-sized telescopes. As well as the Magellanic Clouds (MC) themselves, there are several related structures including the Magellanic Bridge (discovered by Hindman et al., 1963), the leading stream of neutral hydrogen known as the leading arms (Putman et al., 1998) and the trailing stream of gas, known as the Magellanic Stream (discovered by Mathewson et al., 1974). For a comprehensive review see D’Onghia & Fox (2016). This provides astronomers with the closest example of interacting galaxies, and the MC have been the target of numerous dedicated studies at multiple wavelengths. The brightest MC stars have the same apparent magnitudes as stars studied by large-scale Galactic stellar surveys, so it is possible these extra-Galactic stars will be targeted deliberately as part of such spectroscopic surveys e.g., RAVE (Munari et al., 2009), APOGEE-2 (Zasowski et al., 2017), or appear serendipitously as in GALAH (this work) and TESS-HERMES (Sharma et al., 2018).
In this work, we identify MC stars that were serendipitously observed by two surveys using the High Efficiency and Resolution Multi-Element Spectrograph (HERMES) (Sheinis et al., 2015) on the Anglo-Australian Telescope (AAT): the GALactic Archaeology with HERMES (GALAH) survey and the TESS-HERMES survey. The GALAH survey is a high-resolution stellar spectroscopic study of the local volume of the Galaxy, with the primary aim of undertaking an ambitious chemical tagging project (De Silva et al., 2015; Martell et al., 2017). The TESS-HERMES survey (Sharma et al., 2018) aims to determine spectroscopic parameters for stars in the TESS mission’s Southern Continuous Viewing Zone (Ricker et al., 2014). For both surveys, the selection functions are simple, with no colour cuts, and are just magnitude limited, with the faintest stars observed have . Although there are dwarf galaxies within the sky coverage of GALAH and TESS-HERMES, it is reasonable to assume that the only extra-galactic stars that will be observed are from the MC due to the target density and the number of observations made by the surveys in and around the MC.
The input catalogue for the GALAH and TESS-HERMES surveys use a magnitude estimated from 2MASS magnitudes
| (1) |
This estimate was calibrated for the predominant stars in the local Galactic volume probed by GALAH: dwarfs, turnoff stars and first-ascent RGB stars with modest reddening. Using MIST isochrones (Dotter, 2016; Choi et al., 2016; Paxton et al., 2011; Paxton et al., 2013, 2015) for RGB, HB and AGB stars with MC-like properties (aged 10–100 Myr with and ), we estimate that the , hence, the faintest stars observed of these evolutionary stages are actually .
With distance moduli of for the LMC (Pietrzyński et al., 2013) and for the SMC (Graczyk et al., 2013), only stars with absolute magnitudes and respectively can be observed in the MC. This limits us to the brightest supergiants: Wolf-Rayet stars, hot OBA-type stars, and cool supergiants. The spectra of these types of stars are not well-suited to the common parameter estimation pipeline used by both surveys, which is tuned to determine elemental abundances for stars with K and (for a comprehensive discussion of the parameter determination, see Buder et al., 2018). The pipeline uses a two-step process to determine stellar parameters and elemental abundances — henceforth collectively known as ‘labels’ — for the stars observed. In the first step, a training set of 10000 stars is selected that have high signal-to-noise and cover the expected parameter space. These spectra are analyzed with Spectroscopy Made Easy (SME; Valenti & Piskunov, 1996; Piskunov & Valenti, 2017) to determine their labels using classical spectrum synthesis methods. In the second step, these training set spectra and stellar parameters are fed into The Cannon (Ness et al., 2015), a data-driven generative modelling approach to label determination. The Cannon builds a quadratic model at each pixel (ie., wavelength step) of the normalised spectrum as a function of the labels. This model is then used to determine the labels for the bulk of the spectra in a computationally short amount of time.
The primary aim of The Cannon is to produce labels that are both precise and accurate. With no colour cuts to avoid the hottest and coolest stars in these surveys, there will be spectra acquired for which the true parameters are well outside of the training set’s bounds, and therefore The Cannon will not be able to produce accurate labels. As such, there is robust flagging of the reliability of the labels to inform the end user whether these labels should be used for detailed abundance studies. But it is not unreasonable to expect that there should be coherence of unreliable labels for a given group of stars, such as O supergiants in the MC. It is this fact that we wish to exploit in this work to identify stars that belong to the MC, and the surrounding structures like the Magellanic Bridge.
The Magellanic Bridge was first discovered as a stream of HI gas connecting the two MC (Hindman et al., 1963). Later work identified that it had a stellar counterpart (e.g., Irwin et al., 1990), with the ages of these stars suggesting that they must have formed in situ, rather than being stripped from the MC. Recent work from Carrera et al. (2017) has, for the first time, found older red giant stars that they claim were tidally stripped from the LMC by the SMC. Belokurov et al. (2017) found stellar tidal tails around the LMC and the SMC using RR Lyrae stars, which supports the model of interaction between the MC and that the old stars are not in the same location as the young stars in the Magellanic Bridge. The ongoing SMASH survey is using DECAM to map this region as well (Nidever et al., 2017). It would be of great interest if Magellanic Bridge stars were serendipitously observed by GALAH or TESS-HERMES.
Data-driven classification methods have already been applied to GALAH and TESS-HERMES spectra: Traven et al. (2017) used the recently developed dimensionality reduction technique t-SNE (t-distributed Stochastic Neighbour Embedding) to represent complex spectral morphology on a two-dimensional map, and to classify stars with “unusual” spectra, and to enable the flagging of potentially problematic spectra. Searching for outliers with machine learning techniques has also been applied to other large surveys (e.g., Reis et al., 2018). Here, we use the labels, not the pixel information of the spectrum, for the classification.
In this work we discuss the observations and their analysis (Section 2); an initial photometric criterion (Section 3.1); the final criteria using kinematics and Cannon labels (Section 3.2); the reliability of the method (Section 4); and discuss one star identified as likely belonging to the Magellanic Bridge (Section 5).
2 Data reduction and abundance determination
The analysis presented in this work makes use of spectra obtained between 2013 November and 2017 September with the 3.9-metre Anglo-Australian Telescope at Siding Spring Observatory with the multi-fibre-fed HERMES spectrograph (Sheinis et al., 2015) and the Two-Degree Field (2dF) top-end (Lewis et al., 2002). 2dF allows for the acquisition of up to 360 science targets per exposure when using 25 sky fibres. HERMES simultaneously acquires spectra using four independent cameras with non-contiguous wavelength coverage totalling Å at a spectral resolution of . Its fixed wavelength bands are 4715–4900 Å, 5649–5873 Å, 6478–6737 Å, and 7585–7887 Å, which were selected to cover absorption features from at least 29 chemical elements in giant and dwarf stars, sampling the major element groups and nucleosynthetic processes. The spectra were reduced using an iraf-based pipeline (Tody, 1986, 1993), which is described in detail in Kos et al. (2017). Briefly, it performs initial quality checks, optimal extraction, reduction, and basic analysis of spectra, including determining the radial velocity.
The observations that make up the dataset described in this work come from three separate, but related, surveys: the GALAH pilot survey (Duong et al., 2018), the main GALAH survey (De Silva et al., 2015), and the TESS-HERMES survey (Sharma et al., 2018). These three programmes share infrastructure in terms of observing, data reduction, and abundance analysis, but have different aims and therefore different selection functions. In this work we concentrate on the 69,095 stars observed by any of these surveys within 15 deg of either MC, for which there was a match in UCAC5 (Zacharias et al., 2017) with a proper motion error less than 2.5 mas yr-1. This cutoff was selected because it included 99 per cent of the stars.
For both the main GALAH survey and the TESS-HERMES survey, the selection functions were simple magnitude cuts. The input catalogue used is the union of 2MASS (Skrutskie et al., 2006), APASS (Henden et al., 2016) and UCAC4 (Zacharias et al., 2013) catalogues, with selections for photometric quality and crowding. Because of a lack of complete APASS photometry at the beginning of the GALAH survey, a magnitude for each star was estimated from the 2MASS magnitudes (Equation 1).
For the GALAH main survey, most fields have the magnitude range , with a smaller number of stars from fields with a magnitude range of . For the TESS-HERMES survey the stars have . For the GALAH pilot survey, the selection function is more complicated, as these stars were chosen to investigate clusters, or the thin and thick disk of the Galaxy (see Duong et al., 2018). For the 69,095 stars considered in this work, 85 per cent have . A total of 19,730 of the stars come from TESS-HERMES, and 49,365 are from either the pilot or main GALAH surveys (for simplicity, we will group these two GALAH surveys together in the subsequent discussion).
We make use of labels that were determined using the methods described in Buder et al. (2018). We note that we include some stars that are not found in either TESS-HERMES DR1 (Sharma et al., 2018) or GALAH DR2 (Buder et al., 2018). One of the criteria used for those data releases was for the radial velocities measured for the blue, green, and red arms of HERMES be consistent. This was found to reject many stars located at the position of the MC. Inspection of their spectra identified that these were very hot stars, and the combination of the H- emission and the strong He I line at 6678 Å, was leading to spurious radial velocities. As such, in this work we make use solely of the radial velocity determined from the blue camera spectra. This has a negligible offset of km s-1 from the combined three-arm radial velocity normally used by GALAH or TESS-HERMES.
3 Photometric selection of likely Magellanic Cloud stars
In this section we develop criteria for identifying likely Magellanic Cloud (MC) supergiant stars; first, from SkyMapper+2MASS photometry (Section 3.1), and then using these to inform a label-based selection (Section 3.2).
3.1 SkyMapper colour selection of Magellanic Cloud stars
Before turning to the GALAH parameters, first we explore the photometry of the MC. In particular, we use the gravity-sensitive photometry of the SkyMapper Southern Sky survey (Keller et al., 2007; Wolf et al., 2018) and 2MASS to identify likely MC stars, which will help inform the search of The Cannon label space for these stars. SkyMapper is a 1.3-m telescope at Siding Spring Observatory that is undertaking a multi-epoch photometric survey of the whole southern sky in six photometric bands: (Bessell et al., 2011). The filter set of SkyMapper is superficially similar to that of Sloan Digital Sky survey (Gunn et al., 1998) and Pan-STARRS (Tonry et al., 2012), but with some key differences. Relevant to this work is the addition of a narrow filter centred at 384 nm that is similar to the DDO 38 band. The and filters straddle the Balmer jump and so at a fixed colour (e.g., ) is gravity sensitive111The same regions of the spectrum also provide metallicity sensitivity for giants, see e.g., Keller et al. (2014); Jacobson et al. (2015); Howes et al. (2016); Simpson (2018).. We can use this to distinguish blue AF-type main-sequence, horizontal-branch, and luminous blue supergiants stars of the same . The unevolved red stars can be distinguished from the evolved stars of the same using a combination of SkyMapper and 2MASS photometry (see figure 16 of Wolf et al., 2018).
We downloaded the SkyMapper DR1.1 (Wolf et al., 2018) photometry for all stars within 15 deg of either MC that met the following global quality criteria: (source never resolved into multiple components) and class_star > 0.95 (highly likely to be a stellar target); and the per filter criteria of (source detected in at least one image in all filters), (isophotal aperture clean of bad pixels, saturation, cross-talk, cosmic rays), and (no Source Extractor warnings about saturation, close neighbours, edge-of-CCD effects, etc) where . These stars were positionally cross-matched to UCAC5 stars with proper motions errors mas yr-1, and to 2MASS stars with a photometric quality of "A" for their magnitude. This gave a final catalogue of 724,940 stars, of which 418,952 had UCAC5 proper motions, and 622,933 have a magnitude. The proper motions were converted to the Galactic frame of reference using astropy (The Astropy Collaboration et al., 2018).
We define an SMC region of the sky as those stars within 3.0 deg of and/or 2.5 deg of ; and an LMC region as those stars within 6.5 deg of . Stars outside of these regions we will refer to as “field” stars, while stars within these regions are referred to as “Magellanic Cloud” stars, though obviously there will be contamination of Galactic stars into the MC regions, and vice versa. These regions are somewhat conservative: the LMC disc extends deg from the centre (Mackey et al., 2016), with further evidence for kinematically related stars out to deg (Majewski et al., 1999, 2008) and a stellar halo that extends to at least deg (Belokurov & Koposov, 2016). However, as will be shown in this work, the bulk of the stellar component of the MC that we observed is found within these bounds.
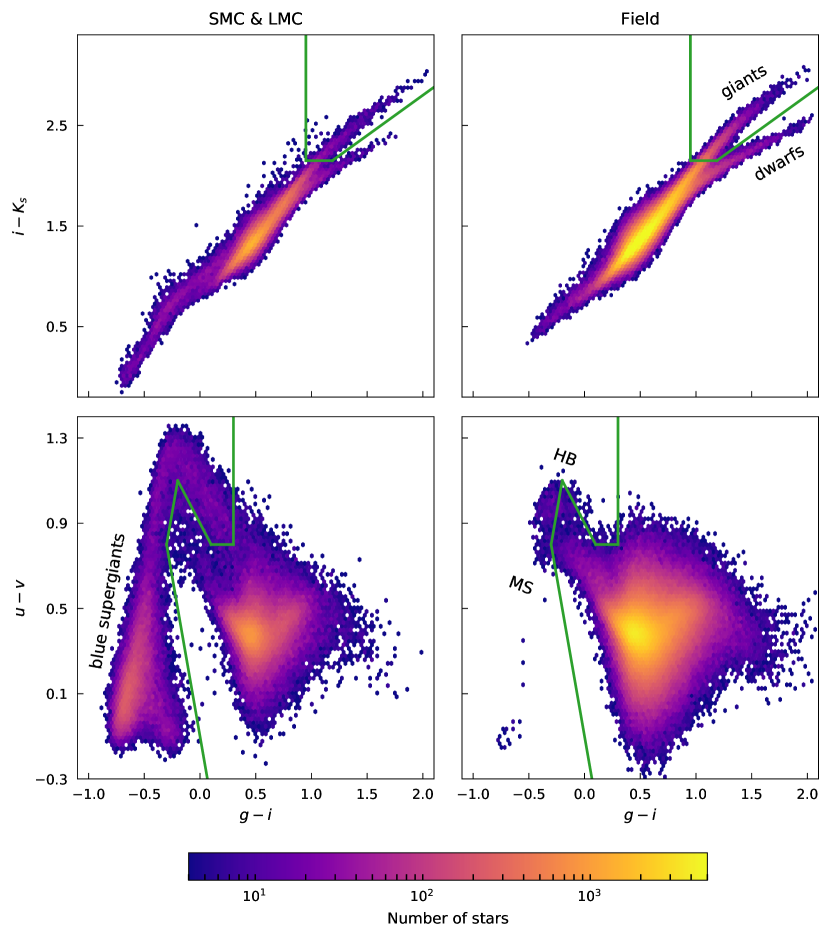
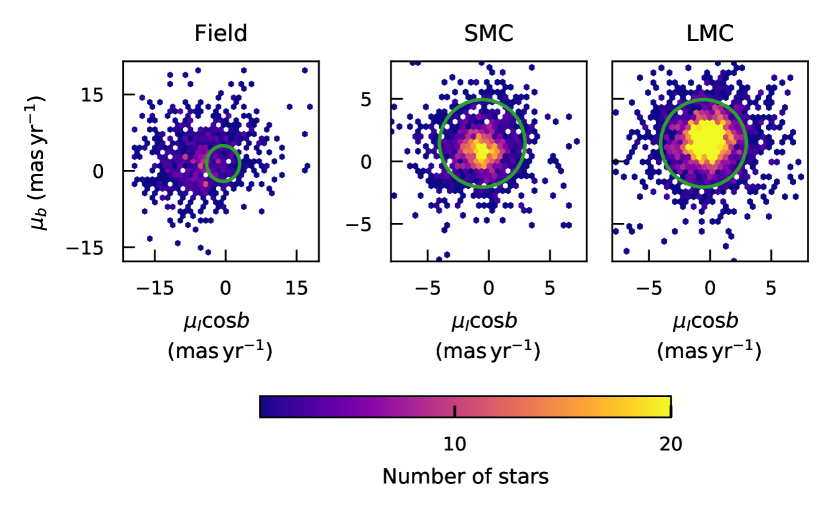
Figure 1 compares the colour-colour distributions of the MC (left column) and field regions (right column). In all the plots, is shown on the x-axis, and it is combined with two different colours: (top row) and (bottom row). The former is gravity sensitive for red stars, while the latter is gravity sensitive for blue stars. On the top row, the red stars bifurcate at , with a population of red dwarf stars with lower that is found in the field, but is not nearly as populated in the MC regions. The sequence with larger are the evolved red stars (see also figure 16 of Wolf et al., 2018). Stars with , and were selected as likely evolved stars, but there will be some contamination of Galactic halo giants into this selection for the MC regions. This contamination is explored later in detail in Section 3.2 (Figure 5).
For the blue stars, the SkyMapper photometry is effective at distinguishing various stages of stellar evolution and mass. For stars with and , there are three populations of stars: two are primarily present in the field population (bottom-right panel), while a third can be found in the MC regions (bottom-left panel). This is distinguishing between evolved and unevolved stars: the population at are blue main sequence stars; are the horizontal branch stars; and the stars are a population of blue supergiant stars in the MC. For the MC region, these blue supergiants form a long sequence of stars that runs from , and then has a turn-over towards the main bulk of the stars. This population is present in the field regions but is nowhere near as populated. We define a selection of blue supergiants shown with the green lines on the bottom panels of Figure 1.
Any star that belongs to either of MC should have very similar, but small, proper motions. Taking just the stars selected as likely blue supergiants (because they have the least contamination from Galactic stars) we show the proper motion distribution in Figure 2. The MC blue stars are found within a small region of proper motion space compared to the field regions. Our SMC sample had an average proper motion of mas yr-1, and our LMC sample had mas yr-1 in UCAC5. It should be noted that these are a non-uniform spatial averages across a large field of view. The best determinations of the proper motion of the centre of mass of the SMC and LMC is that based on HST data by Kallivayalil et al. (2013). They have done the necessary full treatment required, allowing for projection effects and rotation of the MC; something that is beyond the scope of this work (and beyond the uncertainties of the UCAC5 proper motions). Allowing for sign convention changes, our averaging process has produced mean values in excellent agreement with the values from Kallivayalil et al. (2013) given the uncertainties and simple approach.
Although the SMC and LMC do have slightly different proper motions, we proceed with a combined proper motion selection, because one of the aims of this work is to identify stars that belong to the Magellanic Bridge, not just the MC themselves. We consider likely MC stars to be found at a Cartesian distance of less than 3.5 mas yr-1 from mas yr-1. This region is indicated with the green circles on Figure 2 and includes 86 per cent of the blue stars from the MC regions.
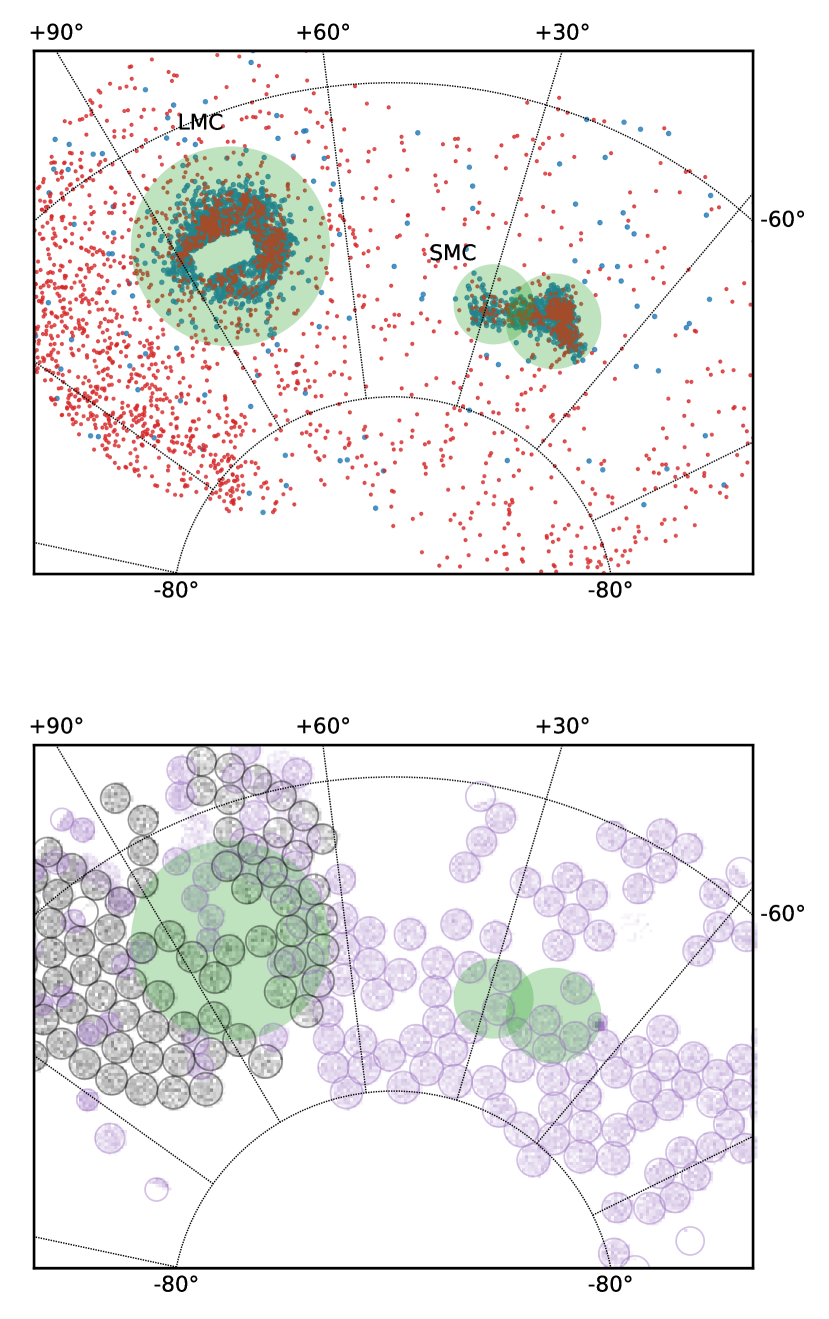
The overall sky distribution of all stars within 15 deg of either MC that met the proper motion criteria and either of the blue or red colour criteria is shown in the top panel of Figure 3. These stars are strongly concentrated at the position of the MC on the sky, and the red stars outside of the MC regions tend to be found to the left of the top panel of Figure 3, which is the direction of lower Galactic latitude. In the bottom panel we show the distribution of stars observed by GALAH and TESS-HERMES. The observing coverage over both MC and the surrounding regions is uneven, especially to the north of the SMC, but each MC has several fields covering it. Of the 69,095 stars observed by either GALAH or TESS-HERMES, 9720 are in the LMC region and 3132 are in the SMC region.
In the following section we use these colour-based criteria to investigate the location in The Cannon label space that these MC supergiants are found.
3.2 Cannon labels of Magellanic Cloud stars
In theory it should be possible to simply use the stellar labels (e.g., , , etc.) to identify the MC supergiants. OB supergiants have K and (e.g., Massey et al., 2005; Bouret et al., 2012), while the cool red supergiants will have very low temperatures and surface gravities, like Betelgeuse ( K and ; Lobel & Dupree, 2000), or Antares ( K and ; Ohnaka et al., 2013). The metallicities of the MC are well-known (e.g., Russell & Dopita, 1992; Rolleston et al., 2002; Dobbie et al., 2014). But the training set used by the GALAH and TESS-HERMES implementation of The Cannon limits the outputs to a range of and , which is where the stars of interest to the main aims of the surveys are found. It is not obvious that the hottest stars will ‘pile up’ at the edges of the label space. Casey et al. (2017) found that when applying The Cannon to RAVE spectra the hot stars outside of the training set bounds project into a single clump in the label space near the turn-off.
Before continuing, it is important to note that for these particular luminous MC stars we are not discussing the labels with a belief that they are necessarily accurate. As will be shown, labels like , , , , are erroneous for these stars because their parameters are well outside the bounds of the training set, and do not agree with the literature. However, because of the data-driven nature of The Cannon, there is clearly coherence in their positions in the label space, and it is this coherence that we exploit in this work. We are ignoring all the flags in the dataset designed to remove these unreliable values, so, to avoid confusion, we will refer to all labels with a superscript ⋆, e.g., , , instead of , , to denote that their absolute values are not to be considered accurate.
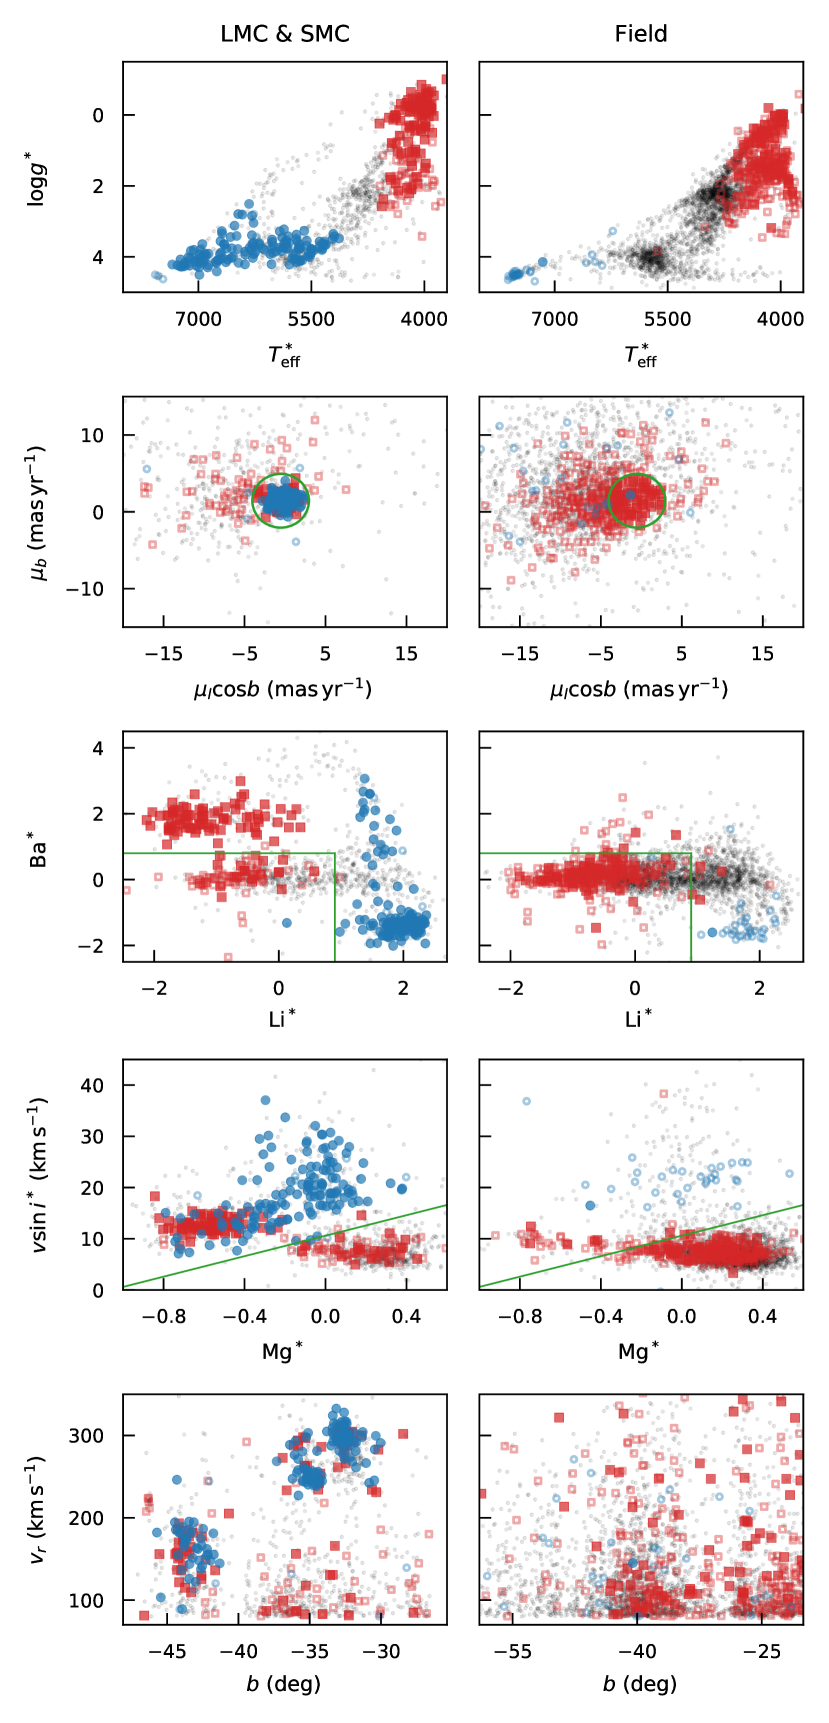
In Figure 4 we use the colour selections from Section 3.1 to show where the blue and red supergiant stars with radial velocities larger than km s-1 are found in the label space. The requirement of km s-1 is designed to just capture the lowest stars of the SMC. In the top row is the - distribution where we find that, like Casey et al. (2017), the blue supergiants from the MC regions are incorrectly assigned temperatures in the range K and surface gravities .
The returned by The Cannon for the blue stars are actually anti-correlated with their expected temperatures: for these blue stars, the coolest stars as found by The Cannon are actually the hottest O stars. We are hitting the hot edge of The Cannon’s training set. Note that the is forced higher because this is the only region The Cannon has training set with high . But due the grid effect, now the is grossly underestimated, and hence the is underestimated as a result. The grid effect on also forces The Cannon to choose a higher to further mimic the “featurelessness” that is still not accounted by these .
The red supergiants have ended up in their mostly expected place in the - space, with cool temperatures and low surface gravities. These cool supergiants are slightly cooler than The Cannon coolest training sample, so The Cannon can still find reasonable - for them. However, due to extrapolation, the estimated is still warmer than the truth. And because the is too warm compared to the truth, this pushes up the (and other abundances).
The distributions of the blue and red stars in the field regions are different from those in the MC regions: in particular, the red stars are found at higher . As would be expected, based upon the results from the full SkyMapper dataset, the MC supergiants are mostly concentrated into a small region of proper motion space. Those stars that are outside the proper motion region but meet the colour criteria are indicated with open symbols.
The aim of this work is to develop a Cannon label-based method (supplemented with radial velocities and proper motions) for identifying MC stars, without knowledge of the photometry of the star. Not every star observed by GALAH or TESS-HERMES has reliable SkyMapper photometry, especially in the gravity sensitive and filters. And solely using our colour selection does not provide a clean sample. In the middle row of Figure 4 the label for the MC regions shows a bimodal distribution for the red stars; the bulk have , while there are some with . In the field regions, almost all of the red stars are found to have .
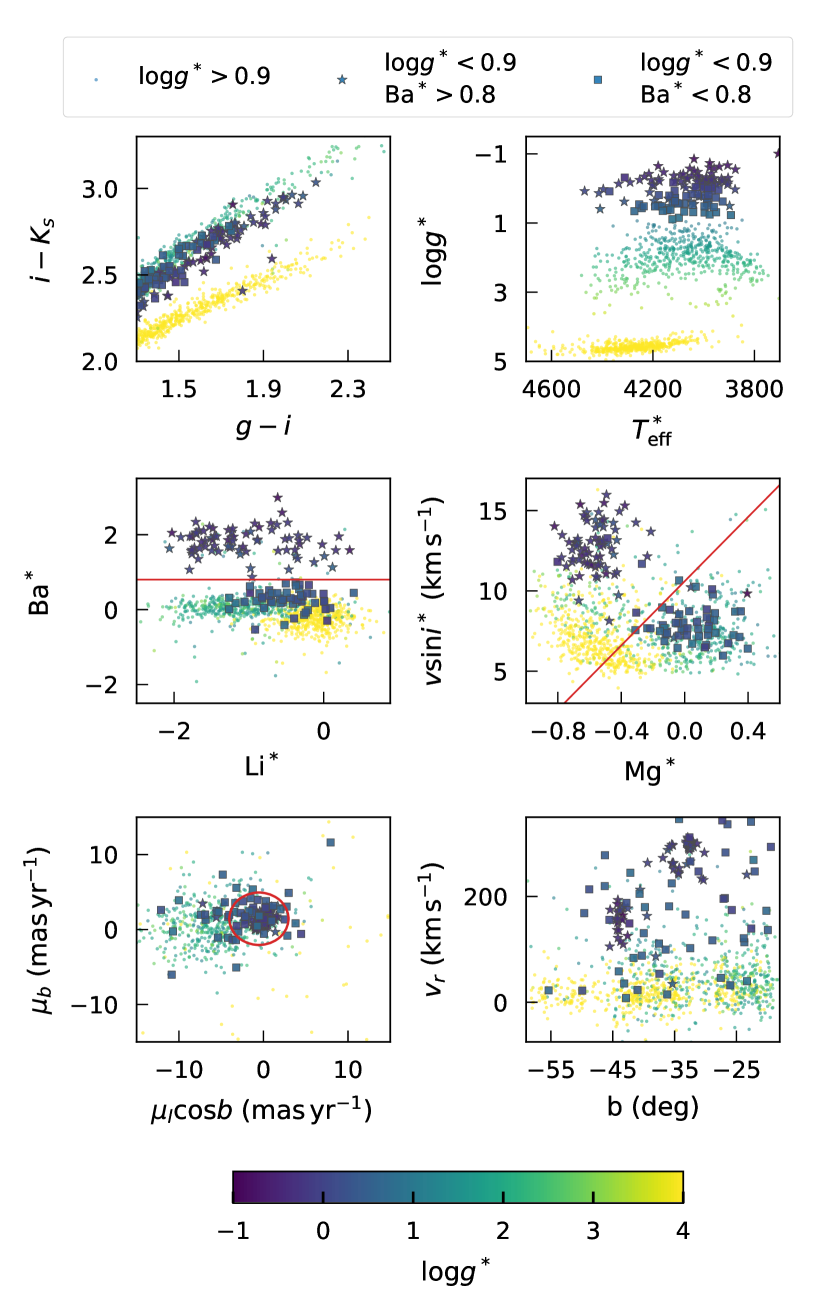
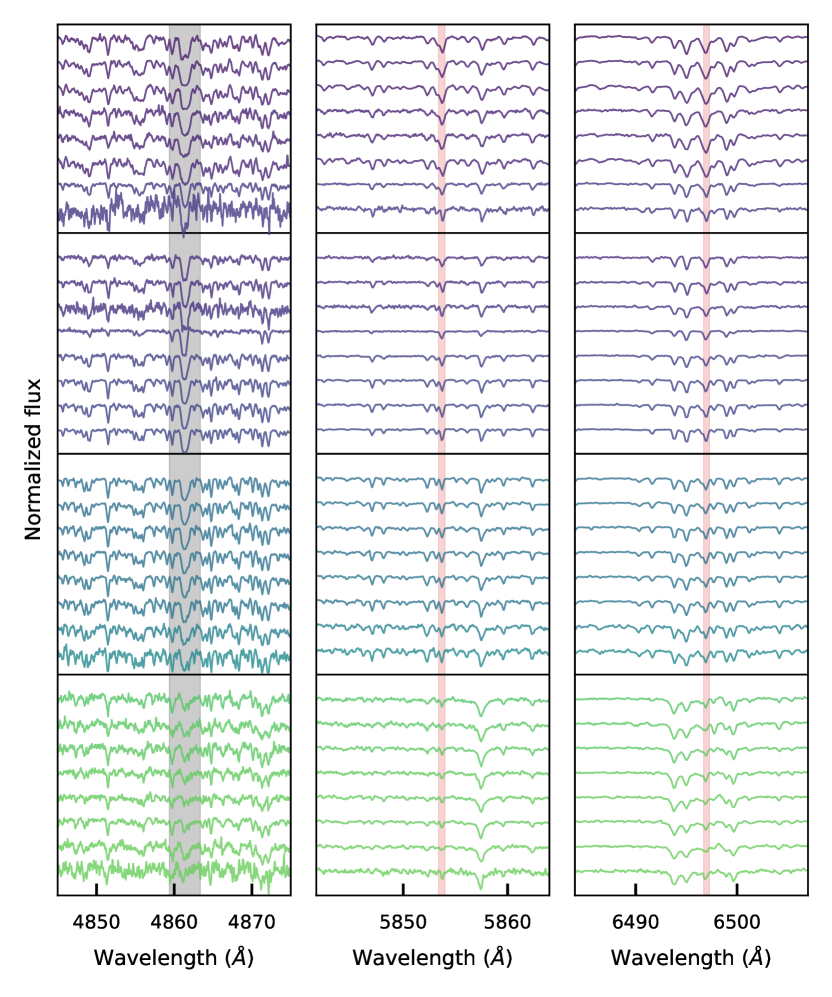
In Figure 5 we explore the label distribution of the red stars further. Plotted are all stars (not just those with km s-1) observed by GALAH or TESS-HERMES within 15 deg of either MC with , the colour at which the colour-colour diagram bifurcates between evolved and unevolved stars (see also Figure 1). The Cannon is very successful at distinguishing these two categories of stars, but as the - diagram shows, there is a large range of surface gravities of the evolved stars (). The lowest gravity stars have the bimodal distribution of also found in Figure 4, and inspection of their spectra (Figure 6), confirms that there is a difference in the strength of their barium lines. The -high stars are found to concentrate at the position, proper motions, and radial velocities of the MC, while the barium-normal population are found at a range of radial velocities and are scattered across the sky. They also show a difference in their and labels: the -high stars have low but large , and form a distinct group from the other stars with .
Returning to Figure 4, since the aim is to identify all supergiants in the MC and their surroundings, it is not optimal to simply use , because this would exclude the blue stars, which are found at a large range of . Exploration of the label space identified a combination of , , , and as being very good at differentiating MC supergiants from the rest of the sample. As already shown, the red stars have high values. We also find that the blue stars have high , but there is some contamination of Galactic stars in the regime of . This is removed using the and values: the MC stars tend to have large for their .
We reiterate that these labels are unreliable in terms of their use for abundance-based studies. For instance, the red supergiants in the MC have a barium abundance from The Cannon of dex, but such values have never been observed in the MC. Van der Swaelmen et al. (2013) observed a large sample of LMC disk and bar stars (), finding a typical range of . Several clusters in the LMC were observed by Colucci et al. (2012) who found for individual stars in young clusters like NGC 1978 and NGC 1866. For the blue supergiants observed by GALAH, the and are obviously erroneous, so we can also assume their abundances would be too. Inspection of the spectra show there is no lithium line present in these stars, and The Cannon has correctly flagged these as having no significant detection of the line.
Combining The Cannon labels, radial velocity, and proper motion information for the stars, we create the following criteria for identifying MC supergiant stars observed by GALAH or TESS-HERMES:
-
•
Radial velocity: km s-1
-
•
Proper motion: within mas yr-1 of
-
•
Cannon labels: and either or .
In the following section we apply these criteria to all of the stars observed by GALAH within 15 deg of either MC and find them to be extremely successful, with a low rate of false positives or negatives, at identifying supergiant stars in and around the MC.
4 Magellanic Cloud stars selected from Cannon labels
| sobject_id | smss_j | gaia_source_id | GCVS | RA () | Dec () | (km s-1) | (K) | VarType | Period (days) | ||||||
|---|---|---|---|---|---|---|---|---|---|---|---|---|---|---|---|
| 150107002201317 | 053954.29-672319.6 | 4659471996367683584 | 84.97625 | -67.38881 | 291.8 | 7277 | 4.24 | -0.46 | 14.4 | 1.52 | -0.35 | -1.39 | |||
| 140807005601298 | 010502.33-725532.6 | 4687406669826115584 | SMC V1912 | 16.25962 | -72.92569 | 193.3 | 4158 | -0.47 | -0.42 | 12.4 | -1.28 | -0.60 | 2.12 | LC: | |
| 140806004701098 | 005447.81-712452.9 | 4689300200660147200 | 13.69929 | -71.41469 | 182.1 | 6990 | 4.30 | -0.63 | 27.9 | 1.77 | -0.27 | -1.32 | |||
| 161217003601102 | 75.22979 | -66.63731 | 319.4 | 5246 | 0.85 | -0.01 | 16.1 | -0.15 | -0.46 | 3.93 | |||||
| 161107003901091 | 053040.67-672308.0 | 4660172969384724480 | 82.66925 | -67.38556 | 304.8 | 4047 | -0.37 | -0.14 | 13.0 | -1.70 | -0.73 | 2.02 | |||
| 161217003601069 | 75.84304 | -66.36983 | 294.9 | 5996 | 1.86 | 0.16 | 12.7 | 0.88 | -0.62 | 3.37 | |||||
| 161116002201011 | 004348.44-733648.7 | 4685823716674504704 | SMC V0284 | 10.95183 | -73.61356 | 86.1 | 6082 | 2.19 | -0.04 | 15.8 | 1.25 | -0.84 | 3.16 | DCEP | 31.93 |
| 170115002201207 | 73.81692 | -69.32006 | 245.2 | 3997 | 0.46 | -0.39 | 13.7 | -2.08 | -0.44 | 2.01 | |||||
| 170115002201358 | 77.28621 | -68.98539 | 263.8 | 6127 | 1.97 | 0.26 | 14.3 | 0.98 | -0.86 | 3.46 | |||||
| 170108002201380 | LMC V3090 | 82.76425 | -69.09444 | 273.1 | 4012 | -0.27 | -0.12 | 13.1 | -1.14 | -0.68 | 2.04 | LC: | |||
| 170115002201195 | 045541.84-692624.2 | 4655173833609707520 | LMC V0292 | 73.92433 | -69.44006 | 252.4 | 4195 | 1.08 | -0.07 | 14.0 | -1.07 | -0.55 | 2.08 | SRC | 675.00 |
| 150107002201252 | 83.40013 | -67.50000 | 297.5 | 6435 | 2.87 | 0.07 | 9.8 | 1.33 | -0.67 | 2.36 | |||||
| 161107003901127 | 82.19579 | -67.15900 | 301.2 | 5655 | 3.77 | -1.54 | 22.0 | 1.89 | 0.16 | -1.52 | |||||
| 150107002201069 | 85.41704 | -68.60675 | 284.0 | 7171 | 4.11 | -0.51 | 11.7 | 1.69 | -0.42 | -1.55 | |||||
| 170115002201170 | 75.32654 | -69.54733 | 261.8 | 4100 | -0.86 | -0.04 | 13.7 | -1.76 | -0.76 | 2.95 | |||||
| 140807005601359 | 011235.17-730935.6 | 4687177387283550208 | 18.14654 | -73.15986 | 172.1 | 4196 | -0.08 | -1.11 | 13.7 | -0.34 | -0.21 | 1.98 | |||
| 170115002201198 | 045329.41-692432.7 | 4655363946042099712 | 73.37246 | -69.40914 | 280.5 | 5507 | 3.91 | -1.71 | 24.7 | 0.98 | 0.01 | -1.59 | |||
| 161107003901123 | 82.09154 | -67.29669 | 295.8 | 6062 | 3.53 | -1.25 | 16.7 | 2.12 | -0.17 | -1.79 | |||||
| 161217003601020 | 050714.17-660318.5 | 4662061311885050880 | 76.80908 | -66.05511 | 282.5 | 6283 | 2.16 | 0.17 | 22.3 | 1.26 | -0.72 | 2.93 | |||
| 161217003601054 | 75.45875 | -66.13011 | 295.3 | 6857 | 3.48 | -0.11 | 12.4 | 1.66 | -0.70 | 1.09 | |||||
| 140807005601222 | 13.40058 | -73.23897 | 120.0 | 6831 | 4.37 | -0.75 | 33.3 | 1.92 | 0.13 | -1.05 | |||||
| 161107003901397 | 053334.37-665109.9 | 4660260621076648960 | 83.39321 | -66.85278 | 314.0 | 5544 | 3.99 | -1.64 | 26.1 | 1.90 | 0.01 | -1.49 | |||
| 170115002201276 | 045943.53-683122.8 | 4661327319154037760 | 74.93142 | -68.52300 | 276.1 | 6226 | 1.93 | 0.34 | 16.8 | 1.01 | -0.85 | 3.61 | |||
| 140807005601330 | 17.62279 | -72.82628 | 134.6 | 4475 | 0.06 | -0.51 | 12.0 | 0.46 | -0.47 | 2.20 | |||||
| 170108002201148 | 79.96583 | -69.88569 | 257.3 | 5279 | 3.49 | -1.82 | 18.3 | 1.15 | -0.28 | -1.06 | |||||
| 170108002201166 | 80.41142 | -69.47181 | 270.4 | 5431 | 3.34 | -1.69 | 15.2 | 1.91 | -0.04 | -1.35 | |||||
| 161115003201358 | 050228.82-704106.0 | 4655039349596015616 | 75.62013 | -70.68500 | 241.3 | 5502 | 3.77 | -1.68 | 21.8 | 1.38 | 0.05 | -1.22 | |||
| 161107003901238 | 81.87917 | -66.58258 | 278.9 | 7109 | 4.34 | -0.54 | 26.0 | 1.75 | 0.09 | -1.46 | |||||
| 161219004101315 | 055600.34-674113.5 | 4659180213470700544 | 89.00137 | -67.68708 | 282.8 | 4111 | -0.22 | -0.27 | 14.4 | -1.46 | -0.62 | 1.96 | |||
| 161107003901054 | 83.07508 | -67.05122 | 260.0 | 4016 | -0.38 | -0.21 | 11.5 | -0.18 | -0.72 | 2.07 |
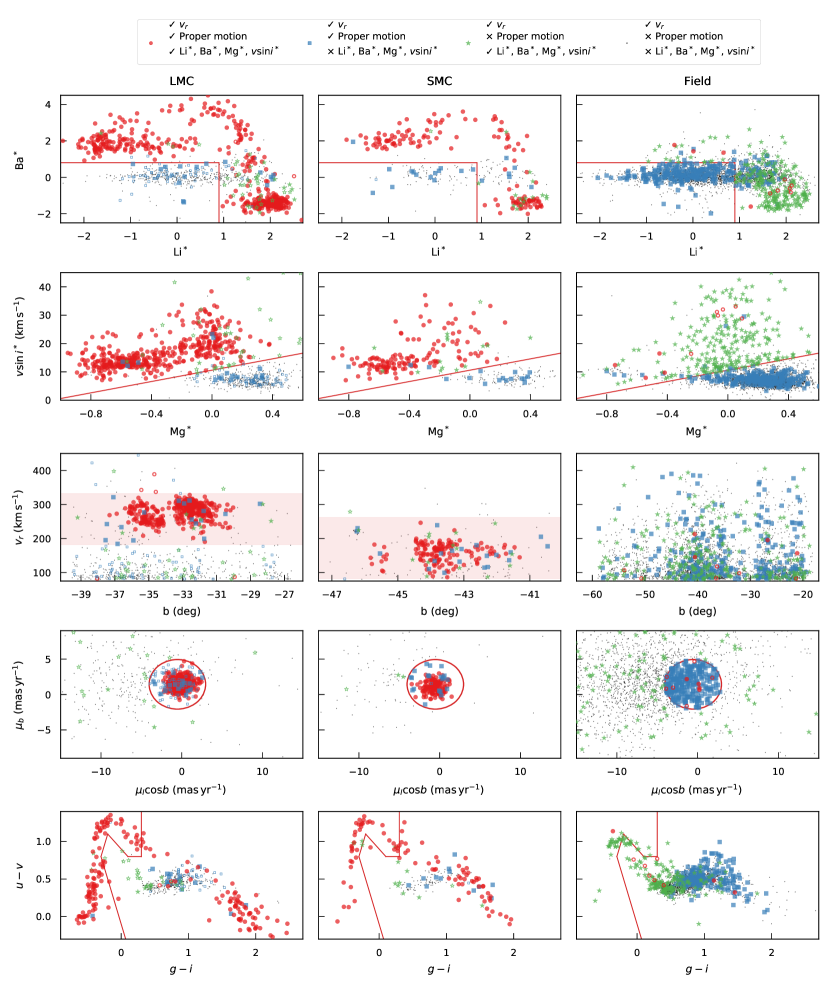
In this section we apply the proper motion, radial velocity, and Cannon label selections to 69,095 stars observed by GALAH and TESS-HERMES in and around the Magellanic Clouds (MC), with the aim of identifying members of MC themselves, as well as stars that are part of the surrounding structures of the Bridge and streams. We identify 581 possible MC supergiants. The full list of stars is in Table 1. Figure 7 presents the parameters for three regions of the sky: the LMC (left column), SMC (middle column), and field regions (right column). The stars have been placed into four categories: stars that meet all the three criteria; stars that only fail the proper motion criteria; stars that fail the label criteria; stars that fail both the label and proper motion criteria.
In the field region there are only 10 stars that meet the criteria to be MC supergiants. There were 273 stars that failed the proper motion criteria, and 326 stars that failed the label criteria, and these two groups had different distributions in the parameter space. The former stars tend to be bluer, with a high lithium label. This is because of the relative lack of -rich stars in the field, so all of the stars that pass the label criteria are found to be -rich. This splitting of these two groups of stars manifests in the colour-colour spaces, where the lithium-rich stars have . In the colour, there are two parallel sequences of stars: blue dwarfs and blue evolved stars. We will discuss false positives in Section 4.2, but we note here that six of the possible MC-like stars in the field are found on these Galactic star sequences.
In the MC regions, we find a large fraction of stars identified as members of the MC. Of the 1013 stars observed in the LMC region with km s-1, 434 stars were identified as members, 41 stars were rejected due to their proper motions, and 83 by their labels. For the SMC, there were 300 stars observed with km s-1, with 137 identified as members, 16 rejected for their proper motions, and 21 for their labels. The rejected stars follow the same patterns observed in the field region, namely that the proper motion outliers are bluer, and the label outliers are redder. In Sections 4.2 and 4.3 we discuss the false positives and negatives, in particular via the radial velocity and colour distributions. Here we highlight that in the MC regions almost every star identified as a supergiant falls within the literature radial velocity bounds of each MC (shaded red bands on the third row of Figure 7).
By using a label selection rather than a colour selection, we have been able to identify MC stars in the colour range , which were either too blue for the red colour selection, or vice versa. It is in this colour range that we find many of the stars that were rejected, in particular those stars that failed both the proper motion and label criteria, but still have km s-1.
4.1 General properties of Magellanic Cloud stars
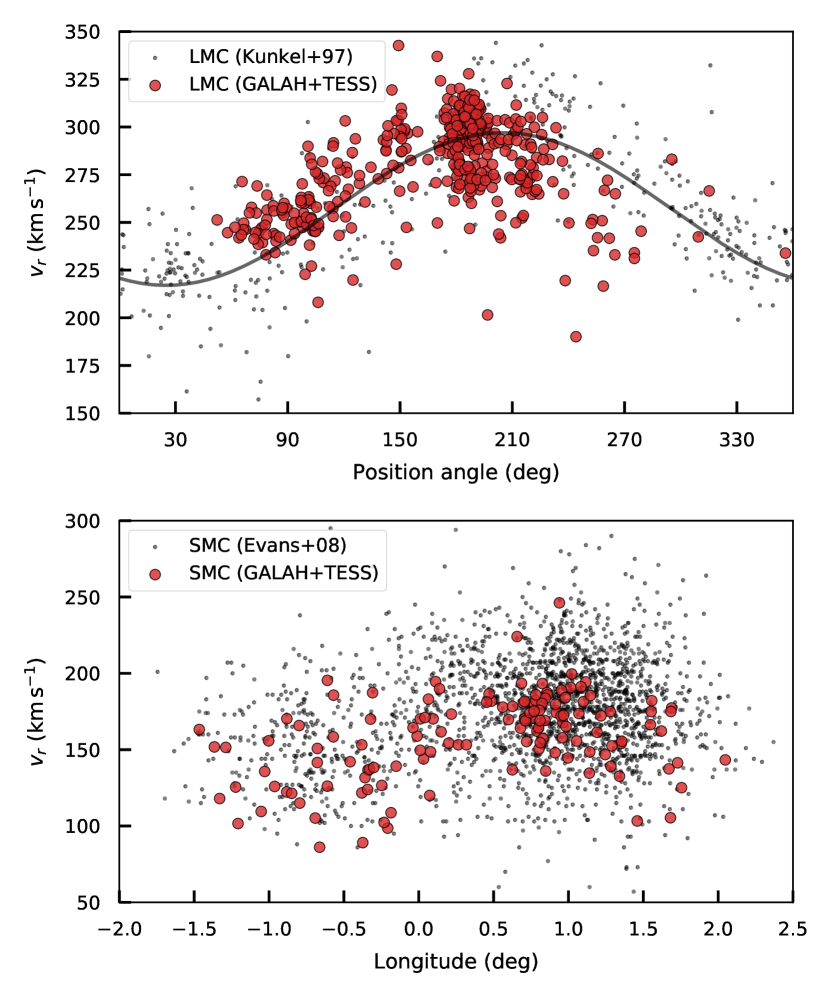
From the LMC region there are 434 members identified with an average radial velocity of km s-1, and from the SMC there are 137 members identified with an average radial velocity of km s-1. At first impressions, these values do differ from the literature systemic velocities of the MC, but this can be explained as being due to our uneven sampling of each MC and the complicated velocity distributions of the MC.
The plane of the LMC disk is tilted by about deg with respect to the plane of the sky (van der Marel & Cioni, 2001; Olsen & Salyk, 2002; Nikolaev et al., 2004) and so at different position angles the rotation velocity has a different component of the rotation velocity projected into the line of sight. As shown in the top panel of Figure 8 the spectroscopically-observed stars are found at a small range of position angles and this resulted in a higher average velocity than the literature systemic velocity ( km s-1; van der Marel et al., 2002; Cole et al., 2005).
For the SMC there are a range of reported values in the literature depending on the type of star and region observed: e.g., km s-1 for red giant stars (Harris & Zaritsky, 2006); km s-1 for OBA type stars (Evans & Howarth, 2008). The line-of-sight velocity distribution of the SMC is more complicated than the LMC and the uneven sampling of the SMC means we do not have a completely representative sample. Most of the stars observed on the SMC bar are from the southern end, and the rest of the stars come from the eastern wing. The bottom panel of Figure 8 gives the radial velocity with respect to a longitude along the bar, ie., a line position centred at , with a position angle of deg. Due to our spatial sampling, we are missing the higher velocity stars that would increase our average to be more towards that of Evans & Howarth (2008).
Although the metallicity of the stars has been flagged as unreliable by The Cannon, we have still been able to recover that there are metallicity differences between the two MC. Considering only the red supergiants (defined as MC stars with ), for which the and labels are more reasonable, we find the SMC has a mean metallicity of and for the LMC . As with the radial velocities, these values are somewhat different from those found with dedicated studies: for the SMC values range from for young stars (Russell & Dopita, 1992) to for red giants (Dobbie et al., 2014); for the LMC, massive main sequence stars have been found to have (Rolleston et al., 2002). Due to the reasons mentioned before we will not be entering into discussions about the relative abundances of the two MC or comparing them to the Milky Way Galaxy. However as noted above, The Cannon label is not too far from the literature expectations. and moreover, the difference between the LMC and SMC values is completely consistent with the observed literature difference.
4.2 False positives
In this and the following subsections, we consider two important questions: What is the rate of false positives (Section 4.2) for this method, and what is the rate of false negatives (Section 4.3)?
Here we explore two avenues for identifying false positives: the radial velocities of the stars selected as MC supergiants; and their colour-colour distributions. Both have their advantages and disadvantages. For the radial velocity, it is easy to reject a star that has a radial velocity that is much larger than the expected range for a given MC. But in the case of the SMC, the radial velocity is within the expected bounds of stars within the Milky Way (compare the radial velocity distribution of the SMC to the field regions in Figure 7). Even the LMC has some overlap with the Milky Way velocity distribution. The weakness of the colour-colour distributions is that, although we know that the blue MC supergiants are found in a relatively unique part of the / colour-colour space, the red stars have a large amount of confusion with evolved stars in the Milky Way (see e.g., Figure 5). And not every star observed by GALAH and TESS-HERMES has reliable SkyMapper photometry in the useful filters.
Because of its relatively large radial velocity with respect to the Milky Way, the LMC provides a better testing ground for identifying false positives. There are only three stars with a radial velocity well outside the expected bounds: two with velocity km s-1, and one with km s-1 (likely a Galactic halo star; Gaia DR1 4760338822280336256). Both of the low velocity stars are found in the / colour-colour diagram at and , a realm dominated by stars that are not MC stars. It is here that we find most of the stars that failed one of the criteria. There are another two stars identified as LMC supergiants that are found in this region of the colour-colour diagram, but these two stars have radial velocities much more like the LMC. And one of these two is a known Cepheid variable with a period of 39.345 days (OGLE ID LMC128.7 12809), which would require a mean absolute magnitude of (based upon the period/luminosity relationship for Cepheids, see e.g., Benedict et al., 2002), placing it at the distance of the LMC.
For the SMC region, such an analysis is harder because its radial velocity is similar to the edge of the Milky Way distribution. But there are no stars in the SMC region which were identified as MC supergiants that have velocities higher than the expected range for the SMC. There are also no supergiant stars in the colour-colour diagram that are located in the region dominated by non-MC stars, as found in the LMC region.
Of interest are the 10 stars in the field region that passed the MC supergiant criteria, because these could be possible Magellanic Bridge or Stream members. Most are bluer stars (i.e., ) as would be expected because there are few Ba-rich field stars. Being conservative, we classify six of these stars as false positives because they are found on the Galactic star sequences in the colour-colour diagram. These stars also happen to have proper motions barely inside the allowed region, i.e., they are on the edge of the red circle for proper motion selection (fourth row of Figure 7).
Overall, these results suggest that there is a very low level of contamination from false positives. From the LMC there are less than one per cent (3/434) obvious false positives. For the field regions the contamination rate is much higher (6/10) but there were many more stars observed in the field regions than in the MC regions. False positives stars would likely be spatially random on the sky, so when observing a larger area, as we have done in the field regions, it is not unexpected that we would have more false positives.
4.3 False negatives
Along with the false positives, it is important to understand the rate of false negatives; are we rejecting MC members with The Cannon label criteria? Or with the proper motion criteria?
Although they are less certain than the radial velocities, the proper motions do provide a strong constraint. From the results using the entire SkyMapper sample of likely MC blue supergiants, 87 per cent of the stars were within 3.5 mas yr-1 of the mean proper motion of the combined MC grouping.
There are eight stars that failed the proper motion criteria, but which passed the label criteria and that are in the radial velocity range of the LMC. Most of the other proper motion outliers are found in the the region of colour-colour space where the field dwarf and giant populations are found. All have relative proper motions larger than 6 mas yr-1 from the rest of the LMC sample. This equates to a projected velocity on the plane of the sky of over km s-1 for a star with a relative proper motion mas yr-1, assuming it is at the distance of the LMC. Such speeds are occasionally seen in the Milky Way with hypervelocity stars escaping the Galaxy (e.g., Guillochon & Loeb, 2015), but it seems unlikely we have discovered a population of hypervelocity MC stars, and instead these stars are considered to be Galactic stars coincident on the sky with the MC.
For the SMC, there are stars that were rejected because of their proper motions. All but two of these are found at such large relative proper motions that they cannot be considered associated with the SMC. One of the two stars that remain is most likely associated with the Galactic globular cluster NGC 362. NGC 362 does have a velocity similar to the MC ( km s-1; Harris, 1996) but with a proper motion slightly different to the SMC. There were members of NGC 362 observed by GALAH, and this was the only one of these stars that passed the label criteria (in this case due to having a very low ).
Along with stars rejected because of their proper motions, there were stars rejected for their label values. In the LMC region there were 17 stars within the proper motion region, and that had radial velocities within the expected range for the LMC, but failed the label test. All but five of these failed the criteria that related to their . Two of these five stars have very low but . Inspection of their other parameters suggests that they probably are legitimate members of the LMC: they are well above the - line and, for the one that has SkyMapper colours, it is found at the very hot end of the supergiant sequence in . It would appear that their is anomalously “low” (remembering that in all these OB supergiants The Cannon has not detected a line but still has ).
As discussed in Section 2, one of the problems encountered by the reduction pipeline in measuring the radial velocity of the stars was that the very hottest stars have H-alpha emission and a strong He I line at 6678 Å. The radial velocities are determined using cross-correlation to 15 synthetic AMBRE spectra, and this was confusing this He line with the H-alpha line. This returns a velocity of km s-1 for the red camera spectrum. As such we have worked with the radial velocity from the blue camera of HERMES, which did not suffer from this problem. There were only two stars with blue camera radial velocity km s-1 and a red camera velocity km s-1 that were within the proper motion region that were not identified nor selected as supergiants: the two stars mentioned above with the low . There was another star that had an extremely large relative proper motion: mas yr-1. Inspection of its spectra and colours shows it is actually a dwarf star that had a poor continuum normalization in the red spectra that caused problems for its radial velocity determination.
As with the false positives, it appears there are only a handful of false negatives based upon inspection of the colour-colour diagrams and the radial velocity distributions. Overall, it seems likely there are false negatives of the several hundred stars identified as members in our sample.
5 Stars of the Magellanic Bridge and Leading Arm
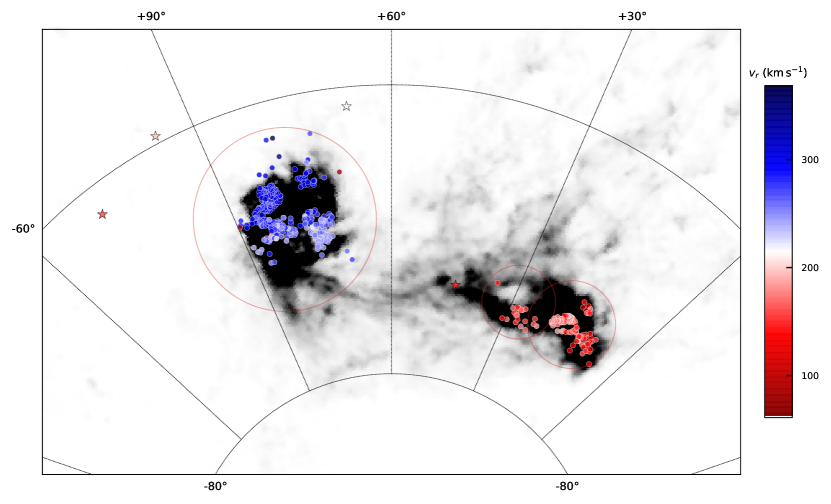
Our study identified four stars that are located outside of the MC regions that met the criteria of having km s-1, a small relative proper motion to the MC, Cannon labels consistent with being a supergiant, and that were not as excluded as Galactic stars due to their SkyMapper photometry. Figure 9 shows the location of these stars on top of a map of HI gas column density from the Parkes Galactic All-Sky survey (GASS; McClure-Griffiths et al., 2009; Kalberla et al., 2010; Kalberla & Haud, 2015). The symbols for each star are coloured by their radial velocity.
Of particular interest is the inter-MC star closest to the SMC. It has labels, photometry, and a spectrum consistent with being a young blue star, which would imply it is too young to have been stripped from the LMC or SMC. And this star is coincident with structured star formation in the region between the MC found by Mackey et al. (2017) in the form of strongly spatially clustered low-mass associations. One of the most striking features was a core-shell structure and this one star observed by GALAH is co-located with it. Mackey et al. (2017) found that this structure sat in a void in the surrounding HI gas, which could be interpreted as stellar winds and supernovae pushing away the gas. This particular star has a velocity of km s-1, which is much slower than the speed of the gas with the maximum column density at its location, which is about 200 km s-1. Another young star that has been observed spectroscopically, DI1388, is also coincident with the core-shell structure and was found by Hambly et al. (1994) to have a radial velocity of km s-1.
What of the other three stars? There is evidence for an extended and lumpy stellar debris distribution around the MC, with over-densities of blue horizontal branch stars out to 30 deg from the LMC (Belokurov & Koposov, 2016). The stars found here are all located on the far side of the LMC from the SMC, but have SMC-like radial velocities. Although the metallicities found by The Cannon are not necessarily reliable, we have shown that The Cannon has derived different metallicities for the two MC when considering just the red stars. These three stars are red and have low metallicities, with . The Cannon found all the LMC stars to have , while the SMC was . So this presents the intriguing possibility that these are cool supergiant stars stripped from the SMC, like those stars found by Carrera et al. (2017). But they are quite distant from the SMC: the closest star is about 23 deg away on the sky, which would equate to a physical separation of at least 25 kpc, so the possibility is unlikely.
In this work, we have limited ourselves to stars within 15 deg of either MC. This has excluded the full extent of structures such as the Leading Arm, where young OB-type stars have been spectroscopically observed (Casetti-Dinescu et al., 2012; Zhang et al., 2017). Can we use our criteria to explore this region and identify these types of stars? As with the MC and Bridge, the Leading Arm has a high radial velocity relative to the Milky Way: km s-1 (Zhang et al., 2017). Any young star observed in the Leading Arm must be formed in situ: the distance from the LMC to the star would require it to have an ejection speed of km s-1. Taking the entire GALAH dataset, and applying our criteria, with the further constraint that stars must have (i.e., the blue stars) and km s-1, we find 28 stars scattered across the sky. None are particularly close to the structures explored by Zhang et al. (2017) and are likely fast moving OB stars in our Galaxy, ejected from their birth regions.
6 Discussion
In this work we have presented a search of the GALAH and TESS-HERMES surveys for serendipitously observed MC stars. This work took advantage of not only the peculiar kinematics of MC stars with respect to the Milky Way, but the coherency of labels derived by The Cannon from their spectra. The Cannon is a data-driven method for measuring stellar labels from stellar spectra in the context of large spectroscopic surveys, which relies on a training set of spectra with known labels. The stars observed by GALAH and TESS-HERMES in the MC are well outside of the training set, but The Cannon is still able to place these stars in consistent (if not necessarily astrophysical) locations in the label space.
The Cannon methods have been applied to spectra from GALAH (Martell et al., 2017), TESS-HERMES (Sharma et al., 2018), K2-HERMES (Wittenmyer et al., 2018), APOGEE (Ness et al., 2015; Casey et al., 2016), LAMOST (Ho et al., 2016), and RAVE (Casey et al., 2017), but the emphasis in these works was on the accuracy and precision of the labels. This is the first work to explore in detail the usefulness of precise, but inaccurate, labels for stars that are far outside The Cannon training set. Ness et al. (2015) do briefly discuss “failures” (as they referred to them) noting that their training set consisted almost entirely of giant stars. Their implementation of The Cannon interpreted hot rotating dwarfs as very metal poor, cool giants.
We have also shown that The Cannon has the potential to eventually derive meaningful information in the regime of luminous supergiants. There has been a lot of work showing that The Cannon’s methodology works on main-sequence turnoff stars and red giant stars, but those are different kinds of stars. The Cannon might have never worked for the kinds of stars discussed in this work if the underlying parameters were too sensitive to small changes, if they change in a non-quadratic way, or if there were additional covariances. The coherence of the parameters shows that there is a potential to eventually measure abundances and atmospheric parameters for these stars. The decision by the GALAH survey to not include colour cuts in its selection function was primarily driven by the desire to avoid making the selection function complicated. It was always known that this would result in the observation of stars that were too hot, or too cool for the abundance pipeline. But it was known that these spectra would be useful to someone or could be analyzed in the future with the extension of stellar models into these regimes.
Astrophysically impossible Cannon labels could be used to search for other classes of objects that lie outside the volume of parameter space occupied by the training set for GALAH, TESS-HERMES and K2-HERMES. The problem of identifying extremely luminous stars in the MC is made a bit easier by their particular kinematics, especially their narrow range in proper motion. However, the foreground contamination was still significant in the field regions surrounding the MC, where dwarf stars managed to pass through our filters based on kinematics and Cannon labels.
Future projects using similar methodology will be most approachable when they can also choose target samples with unusual properties relative to the overall sample. One promising group is white dwarfs, for which there is not yet a comprehensive Southern sky catalogue. In order to be observed by GALAH, they must be quite nearby, which will be easily verifiable with Gaia DR2 data. We would also expect white dwarfs to be distinct in Cannon label space because their spectra are quite unlike the majority of GALAH stars, and they can be identified quite clearly using the t-SNE dimensionality reduction technique on the spectra (Traven et al., 2017).
Large-scale observational projects continue to increase the volume and dimensionality of the data we have on Milky Way stars astrometrically, photometrically, spectroscopically, and asteroseismically. There is much to be learned by selecting populations of stars we believe to be well-understood in one of those spaces and tracking them through the other spaces to explore their full complexity. There is even more to be learned from following the natural distribution of the data, both in the correlations and dependencies between previously unconnected data sets and at the edges of the distribution, where outliers carry information about rare events in Galactic history.
Acknowledgements
Based on data acquired through the Australian Astronomical Observatory, under programmes: A/2013B/13 (The GALAH pilot survey); A/2014A/25, A/2015A/19, A2017A/18 (The GALAH survey); A/2016B/10 (The TESS-HERMES survey). We acknowledge the traditional owners of the land on which the AAT stands, the Gamilaraay people, and pay our respects to elders past and present.
The following software and programming languages made this research possible: configure (Miszalski et al., 2006); iraf (Tody, 1986, 1993); Python (versions 3.6); astropy (version 3.0; The Astropy Collaboration et al., 2013, 2018), a community-developed core Python package for Astronomy; pandas (version 0.20.2; McKinney, 2010); topcat (version 4.4; Taylor, 2005). This research made use of the cross-match service provided by CDS, Strasbourg.
DMN was supported by the Allan C. and Dorothy H. Davis Fellowship. SLM acknowledges support from the Australian Research Council through grant DE140100598. SB and KL acknowledge funds from the Alexander von Humboldt Foundation in the framework of the Sofja Kovalevskaja Award endowed by the Federal Ministry of Education and Research. LD gratefully acknowledges a scholarship from Zonta International District 24 and support from ARC grant DP160103747. KL acknowledges funds from the Swedish Research Council (Grant nr. 2015-00415_3) and Marie Sklodowska Curie Actions (Cofund Project INCA 600398). TZ acknowledge the financial support from the Slovenian Research Agency (research core funding No. P1-0188). LD, KF and Y-ST are grateful for support from Australian Research Council grant DP160103747. Parts of this research were conducted by the Australian Research Council Centre of Excellence for All Sky Astrophysics in 3 Dimensions (ASTRO 3D), through project number CE170100013.
The national facility capability for SkyMapper has been funded through ARC LIEF grant LE130100104 from the Australian Research Council, awarded to the University of Sydney, the Australian National University, Swinburne University of Technology, the University of Queensland, the University of Western Australia, the University of Melbourne, Curtin University of Technology, Monash University and the Australian Astronomical Observatory. SkyMapper is owned and operated by The Australian National University’s Research School of Astronomy and Astrophysics. The survey data were processed and provided by the SkyMapper Team at ANU. The SkyMapper node of the All-Sky Virtual Observatory (ASVO) is hosted at the National Computational Infrastructure (NCI). Development and support the SkyMapper node of the ASVO has been funded in part by Astronomy Australia Limited (AAL) and the Australian Government through the Commonwealth’s Education Investment Fund (EIF) and National Collaborative Research Infrastructure Strategy (NCRIS), particularly the National eResearch Collaboration Tools and Resources (NeCTAR) and the Australian National Data Service Projects (ANDS).
References
- Belokurov & Koposov (2016) Belokurov V., Koposov S. E., 2016, MNRAS, 456, 602
- Belokurov et al. (2017) Belokurov V., Erkal D., Deason A. J., Koposov S. E., De Angeli F., Wyn Evans D., Fraternali F., Mackey D., 2017, MNRAS, 466, 4711
- Benedict et al. (2002) Benedict G. F., et al., 2002, AJ, 124, 1695
- Bessell et al. (2011) Bessell M., Bloxham G., Schmidt B., Keller S., Tisserand P., Francis P., 2011, PASP, 123, 789
- Bouret et al. (2012) Bouret J.-C., Hillier D. J., Lanz T., Fullerton A. W., 2012, A&A, 544, A67
- Buder et al. (2018) Buder S., et al., 2018, preprint
- Carrera et al. (2017) Carrera R., Conn B. C., Noël N. E. D., Read J. I., López Sánchez Á. R., 2017, MNRAS, 471, 4571
- Casetti-Dinescu et al. (2012) Casetti-Dinescu D. I., Vieira K., Girard T. M., van Altena W. F., 2012, ApJ, 753, 123
- Casey et al. (2016) Casey A. R., Hogg D. W., Ness M., Rix H.-W., Ho A. Q. Y., Gilmore G., 2016, preprint (arXiv:1603.03040)
- Casey et al. (2017) Casey A. R., et al., 2017, ApJ, 840, 59
- Choi et al. (2016) Choi J., Dotter A., Conroy C., Cantiello M., Paxton B., Johnson B. D., 2016, ApJ, 823, 102
- Cole et al. (2005) Cole A. A., Tolstoy E., Gallagher III J. S., Smecker-Hane T. A., 2005, AJ, 129, 1465
- Colucci et al. (2012) Colucci J. E., Bernstein R. A., Cameron S. A., McWilliam A., 2012, ApJ, 746, 29
- D’Onghia & Fox (2016) D’Onghia E., Fox A. J., 2016, ARA&A, 54, 363
- De Silva et al. (2015) De Silva G. M., et al., 2015, MNRAS, 449, 2604
- Dobbie et al. (2014) Dobbie P. D., Cole A. A., Subramaniam A., Keller S., 2014, MNRAS, 442, 1680
- Dotter (2016) Dotter A., 2016, ApJS, 222, 8
- Duong et al. (2018) Duong L., et al., 2018, MNRAS
- Evans & Howarth (2008) Evans C. J., Howarth I. D., 2008, MNRAS, 386, 826
- Graczyk et al. (2013) Graczyk D., et al., 2013, ApJ, 780, 59
- Guillochon & Loeb (2015) Guillochon J., Loeb A., 2015, ApJ, 806, 124
- Gunn et al. (1998) Gunn J. E., et al., 1998, AJ, 116, 3040
- Hambly et al. (1994) Hambly N., Dufton P., Keenan F., Rolleston W., Howarth I., Irwin M., 1994, A&A, 285, 716
- Harris (1996) Harris W. E., 1996, AJ, 112, 1487
- Harris & Zaritsky (2006) Harris J., Zaritsky D., 2006, AJ, 131, 2514
- Henden et al. (2016) Henden A., Templeton M., Terrell D., Smith T., Levine S., Welch D., 2016, VizieR Online Data Catalog, 2336
- Hindman et al. (1963) Hindman J., Kerr F., McGee R., 1963, Aust. J. Phys., 16, 570
- Ho et al. (2016) Ho A. Y. Q., et al., 2016, ApJ, 836, 1
- Howes et al. (2016) Howes L. M., et al., 2016, MNRAS, 460, 884
- Irwin et al. (1990) Irwin M. J., Demers S., Kunkel W. E., 1990, AJ, 99, 191
- Jacobson et al. (2015) Jacobson H. R., et al., 2015, ApJ, 807, 171
- Kalberla & Haud (2015) Kalberla P. M. W., Haud U., 2015, A&A, 578, A78
- Kalberla et al. (2010) Kalberla P. M. W., et al., 2010, A&A, 521, A17
- Kallivayalil et al. (2013) Kallivayalil N., van der Marel R. P., Besla G., Anderson J., Alcock C., 2013, ApJ, 764, 161
- Keller et al. (2007) Keller S. C., et al., 2007, Publ. Astron. Soc. Australia, 24, 1
- Keller et al. (2014) Keller S. C., et al., 2014, Nature, 506, 463
- Kos et al. (2017) Kos J., et al., 2017, MNRAS, 464, 1259
- Lewis et al. (2002) Lewis I. J., et al., 2002, MNRAS, 333, 22
- Lobel & Dupree (2000) Lobel A., Dupree A. K., 2000, ApJ, 545, 454
- Mackey et al. (2016) Mackey A. D., Koposov S. E., Erkal D., Belokurov V., Da Costa G. S., Gómez F. A., 2016, MNRAS, 459, 239
- Mackey et al. (2017) Mackey A. D., Koposov S. E., Da Costa G. S., Belokurov V., Erkal D., Fraternali F., McClure-Griffiths N. M., Fraser M., 2017, MNRAS, 472, 2975
- Majewski et al. (1999) Majewski S., Ostheimer J., Kunkel W., Johnston K., Patterson R., Palma C., 1999, in Chu Y.-H., Suntzeff N., Hesser J., Bohlender D., eds, IAU Symposium Vol. 190, New Views Magellanic Clouds. p. 508
- Majewski et al. (2008) Majewski S. R., Nidever D. L., Muñoz R. R., Patterson R. J., Kunkel W. E., Carlin J. L., 2008, Proc. Int. Astron. Union, 4, 51
- Martell et al. (2017) Martell S. L., et al., 2017, MNRAS, 465, 3203
- Massey et al. (2005) Massey P., Puls J., Pauldrach A. W. A., Bresolin F., Kudritzki R. P., Simon T., 2005, ApJ, 627, 477
- Mathewson et al. (1974) Mathewson D. S., Cleary M. N., Murray J. D., 1974, ApJ, 190, 291
- McClure-Griffiths et al. (2009) McClure-Griffiths N. M., et al., 2009, ApJS, 181, 398
- McKinney (2010) McKinney W., 2010, in van der Walt S., Millman J., eds, Proceedings of the 9th Python in Science Conference. pp 51–56
- Miszalski et al. (2006) Miszalski B., Shortridge K., Saunders W., Parker Q. A., Croom S. M., 2006, MNRAS, 371, 1537
- Munari et al. (2009) Munari U., et al., 2009, A&A, 503, 511
- Ness et al. (2015) Ness M., Hogg D. W., Rix H.-W., Ho A. Y. Q., Zasowski G., 2015, ApJ, 808, 16
- Nidever et al. (2017) Nidever D. L., et al., 2017, AJ, 154, 199
- Nikolaev et al. (2004) Nikolaev S., Drake A. J., Keller S. C., Cook K. H., Dalal N., Griest K., Welch D. L., Kanbur S. M., 2004, ApJ, 601, 260
- Ohnaka et al. (2013) Ohnaka K., Hofmann K.-H., Schertl D., Weigelt G., Baffa C., Chelli A., Petrov R., Robbe-Dubois S., 2013, A&A, 555, A24
- Olsen & Salyk (2002) Olsen K. A. G., Salyk C., 2002, AJ, 124, 2045
- Paxton et al. (2011) Paxton B., Bildsten L., Dotter A., Herwig F., Lesaffre P., Timmes F., 2011, ApJS, 192, 3
- Paxton et al. (2013) Paxton B., et al., 2013, ApJS, 208, 4
- Paxton et al. (2015) Paxton B., et al., 2015, ApJS, 220, 15
- Pietrzyński et al. (2013) Pietrzyński G., et al., 2013, Nature, 495, 76
- Piskunov & Valenti (2017) Piskunov N., Valenti J. A., 2017, A&A, 597, A16
- Putman et al. (1998) Putman M. E., et al., 1998, Nature, 394, 752
- Reis et al. (2018) Reis I., Poznanski D., Baron D., Zasowski G., Shahaf S., 2018, MNRAS, 476, 2117
- Ricker et al. (2014) Ricker G. R., et al., 2014, Journal of Astronomical Telescopes, Instruments, and Systems, 1, 014003
- Rolleston et al. (2002) Rolleston W. R. J., Trundle C., Dufton P. L., 2002, A&A, 396, 53
- Russell & Dopita (1992) Russell S. C., Dopita M. A., 1992, ApJ, 384, 508
- Sharma et al. (2018) Sharma S., et al., 2018, MNRAS, 473, 2004
- Sheinis et al. (2015) Sheinis A., et al., 2015, Journal of Astronomical Telescopes, Instruments, and Systems, 1, 035002
- Simpson (2018) Simpson J. D., 2018, MNRAS
- Skrutskie et al. (2006) Skrutskie M. F., et al., 2006, AJ, 131, 1163
- Taylor (2005) Taylor M., 2005, in Shopbell P., Britton M., Ebert R., eds, Astronomical Society of the Pacific Conference Series Vol. 347, ADASS XIV. p. 29
- The Astropy Collaboration et al. (2013) The Astropy Collaboration et al., 2013, A&A, 558, A33
- The Astropy Collaboration et al. (2018) The Astropy Collaboration et al., 2018, preprint (arXiv:1801.02634)
- Tody (1986) Tody D., 1986, in Proc.SPIE. pp 0627 – 0627 – 16, doi:10.1117/12.968154
- Tody (1993) Tody D., 1993, in Hanisch R. J., Brissenden R. J. V., Barnes J., eds, Vol. 52, Astron. Data Anal. Softw. Syst. II. A.S.P. Conference Series, p. 173
- Tonry et al. (2012) Tonry J. L., et al., 2012, ApJ, 750, 99
- Traven et al. (2017) Traven G., et al., 2017, ApJS, 228, 24
- Valenti & Piskunov (1996) Valenti J. a., Piskunov N., 1996, A&AS, 118, 595
- Van der Swaelmen et al. (2013) Van der Swaelmen M., Hill V., Primas F., Cole A. A., 2013, A&A, 560, A44
- Wittenmyer et al. (2018) Wittenmyer R. A., et al., 2018, AJ, 155, 84
- Wolf et al. (2018) Wolf C., et al., 2018, Publ. Astron. Soc. Australia, 35, e010
- Zacharias et al. (2013) Zacharias N., Finch C. T., Girard T. M., Henden A., Bartlett J. L., Monet D. G., Zacharias M. I., 2013, AJ, 145, 44
- Zacharias et al. (2017) Zacharias N., Finch C., Frouard J., 2017, AJ, 153, 166
- Zasowski et al. (2017) Zasowski G., et al., 2017, AJ, 154, 198
- Zhang et al. (2017) Zhang L., et al., 2017, ApJ, 835, 285
- van der Marel & Cioni (2001) van der Marel R. P., Cioni M.-R. L., 2001, AJ, 122, 1807
- van der Marel et al. (2002) van der Marel R. P., Alves D. R., Hardy E., Suntzeff N. B., 2002, AJ, 124, 2639