ALMA observations of polarization from dust scattering in the IM Lup protoplanetary disk
Abstract
We present 870 ALMA observations of polarized dust emission toward the Class II protoplanetary disk IM Lup. We find that the orientation of the polarized emission is along the minor axis of the disk, and that the value of the polarization fraction increases steadily toward the center of the disk, reaching a peak value of 1.1%. All of these characteristics are consistent with models of self-scattering of submillimeter-wave emission from an optically thin inclined disk. The distribution of the polarization position angles across the disk reveals that while the average orientation is along the minor axis, the polarization orientations show a significant spread in angles; this can also be explained by models of pure scattering. We compare the polarization with that of the Class I/II source HL Tau. A comparison of cuts of the polarization fraction across the major and minor axes of both sources reveals that IM Lup has a substantially higher polarization fraction than HL Tau toward the center of the disk. This enhanced polarization fraction could be due a number of factors, including higher optical depth in HL Tau, or scattering by larger dust grains in the more evolved IM Lup disk. However, models yield similar maximum grain sizes for both HL Tau (72 ) and IM Lup (61 , this work). This reveals continued tension between grain-size estimates from scattering models and from models of the dust emission spectrum, which find that the bulk of the (unpolarized) emission in disks is most likely due to millimeter (or even centimeter) sized grains.
Subject headings:
polarization — scattering — protoplanetary disks — stars: formation — stars: protostarsI. Introduction
One of the longstanding goals of star- and disk-formation enthusiasts has been to make a well resolved map of the magnetic field in a protoplanetary disk. At the 100 au scales of protostellar envelopes, the assumption to date has been that polarized emission from thermal dust grains is perpendicular to the magnetic field, where spinning dust grains are aligned via radiative torques with their short axes parallel to the magnetic field; see, e.g., Lazarian (2007) and Andersson et al. (2015). If polarization detected toward a disk were indeed produced by magnetically aligned grains, it would provide the long-sought-after evidence that young protostellar disks are magnetized; this is a prerequisite for the operation of the magneto-rotational instability (MRI; Balbus & Hawley 1991) and magnetized disk winds (Blandford & Payne, 1982; Turner et al., 2014), both of which are thought to play a crucial role in disk evolution.
Over the last two decades, polarimetric observations with the Berkeley-Illinois-Maryland Array (BIMA), the Submillimeter Array (SMA), the Combined Array for Research in Millimeter-wave Astronomy (CARMA), the mid-infrared polarimeter CanariCam on the Gran Telescopio Canarias (GTC), and now the Atacama Large Millimeter/submillimeter Array (ALMA) have progressively achieved higher resolution and sensitivity, enabling observations of polarized thermal dust emission on scales of protostellar cores, envelopes, and now protoplanetary disks. The SMA, CARMA, and ALMA mapped the inferred magnetic field toward large numbers of low-mass protostellar cores with 100–1000 au resolution (e.g., Girart et al., 2006; Rao et al., 2009; Hull et al., 2013; Stephens et al., 2013; Hull et al., 2014, 2017b, 2017a; Cox et al., 2018), and a few studies with the GTC, SMA, CARMA, and Karl G. Jansky Very Large Array (VLA) searched for (and were sometimes able to marginally resolve) what was assumed to be the magnetic field structure at 100 au scales in a few protostellar and protoplanetary disks (Hughes et al., 2009, 2013; Rao et al., 2014; Stephens et al., 2014; Cox et al., 2015; Segura-Cox et al., 2015; Li et al., 2016; Liu et al., 2016; Fernández-López et al., 2016; Li et al., 2018).
Just as ALMA was poised to finally achieve the goal of making resolved images of magnetic fields in protoplanetary disks, several theoretical studies predicted that polarized (sub)millimeter-wave emission from disks could be produced partially—or completely—by the self-scattering of dust emission from (sub)millimeter-sized grains in those disks (Kataoka et al., 2015, 2016a; Pohl et al., 2016; Yang et al., 2016a, b), following on previous work by Cho & Lazarian (2007). Kataoka et al. (2016a) and Yang et al. (2016b) used this mechanism to explain the 1.3 mm CARMA polarization observations of the Class I/II source HL Tau by Stephens et al. (2014) and the polarization pattern observed in 870 ALMA observations of the transition disk HD 142527 (Kataoka et al., 2016b). More recent results include observations by Lee et al. (2018) of the edge-on HH 212 and HH 111 disks, whose polarization can be interpreted as arising from either scattering or magnetically aligned grains; and observations by Girart et al. (2018) of the massive HH 80-81 disk, whose polarization may arise from dust self-scattering and/or alignment with an anisotropic radiation field (see below).
A further layer of complexity was introduced when Tazaki et al. (2017) proposed a third mechanism that can produce polarization in disks: namely, the alignment of dust grains with their short axes parallel to the (radial) dust emission gradient (this work was based on the radiative torque model by Lazarian 2007). This mechanism, sometimes referred to as “radiative alignment,” is distinct from dust self-scattering but, like self-scattering, acts independently of the disk’s magnetic field. Polarization from this mechanism, which has an azimuthal morphology, appears consistent with 3 mm ALMA polarization observations of the HL Tau disk (Kataoka et al., 2017).
The differing polarization morphologies at long (3 mm) versus short (870 ) wavelengths in various disks suggested that multi-wavelength observations of the same source would be essential in order to disentangle the contributions of polarization due to dust self-scattering, alignment with the dust emission gradient, and magnetically aligned dust grains. This goal was first achieved by Kataoka et al. (2017), who compared 3 mm ALMA observations of HL Tau with previous 870 (SMA) and 1.3 mm (CARMA) observations by Stephens et al. (2014). The polarization morphology at the shorter wavelengths observed by CARMA and the SMA is well explained by dust self-scattering (Kataoka et al., 2016a; Yang et al., 2016a), which, in an inclined disk like HL Tau, manifests itself as polarization aligned with the minor axis of the disk. However, the longer wavelength (3 mm) observations can be explained by alignment with the dust emission gradient (Tazaki et al., 2017). This was clearly confirmed by Stephens et al. (2017), who presented well resolved ALMA observations of polarization toward HL Tau at 870 and 1.3 mm, in addition to the 3 mm data reported in Kataoka et al. (2017). The polarization morphologies at each wavelength were dramatically different: the 870 map showed clear evidence of dust self-scattering, and the 1.3 mm data showed a roughly equal superposition of the patterns from self-scattering and from alignment with the dust emission gradient.
To shed more light on the origins of dust polarization in disks, and to investigate the polarization in a Class II source that is more evolved than HL Tau, we performed 870 ALMA observations of the disk surrounding the Class II source IM Lup. Finkenzeller & Basri (1987) and Martin et al. (1994) classified IM Lup as a weak-line T Tauri star, based on its relatively narrow line and lack of optical veiling. It is sometimes considered a transition object between a classical and a weak-line T Tauri star (Pinte et al., 2008). Recent measurements of the mass accretion rate suggest a value of yr-1 (Alcalá et al., 2017), typical for T Tauri stars.111Previous observations by Günther et al. (2010) suggested an extremely low accretion rate on the order of yr-1. An accretion rate this low would imply a magnetic field strength of less than 100 G on the 100 au scale (Bai & Goodman, 2009), which would be too weak to align grains 1 in size (Hughes et al., 2009). However, the difference between this value and the value reported by Alcalá et al. (2017) could be due to variability in the accretion rate. There is evidence for substantial grain growth in the IM Lup disk—up to millimeter sizes—based on detailed modeling of multi-frequency data (Pinte et al., 2008). These millimeter-sized grains, if present, would be even less aligned by the (weak) magnetic field; these same large grains would also increase the scattering cross section, resulting in a brighter polarization signal.
In addition, IM Lup has a number of other features that make it ideally suited for studying scattering-induced disk polarization. These include a disk that is both massive ( 0.1 ) and large ( , or 600 au in diameter), the absence of a contaminating envelope, azimuthal symmetry, and an intermediate disk inclination (, where for face-on). IM Lup has been studied extensively at millimeter wavelengths (e.g., Lommen et al., 2007; Pinte et al., 2008; Panić et al., 2009; Cleeves et al., 2016; Tripathi et al., 2017). All but the inner 40 AU of the disk is optically thin at 1.3 mm and 870 (Cleeves et al., 2016).
Below we discuss our ALMA observations in § II and results in § III. In § IV we discuss a number of issues, including a comparison of the polarization fraction in IM Lup and HL Tau (§ IV.1); grain growth, and a maximum grain-size estimate for IM Lup (§ IV.2); dust settling and optical depth (§ IV.3); and disk magnetic fields (§ IV.4). We offer our conclusions and potential paths forward in § V.
II. Observations
We used ALMA to observe dust polarization at 870 µm toward IM Lup on 2017 April 24 and 2017 April 26. The pointing center was = 15:56:09.172, = –37:56:06.483. The observations have a synthesized beam (resolution element) of 050 040 at a position angle of 76.9, corresponding to a linear resolution of 72 au at a distance of pc (Gaia Collaboration et al., 2016).
The largest recoverable scale in the data is approximately 4, which matches the largest extent (i.e., the diameter) of the dust emission in IM Lup’s disk (the CO emission extends beyond a diameter of , or 2000 au; Panić et al. 2009; Cleeves et al. 2016). The ALMA polarization data comprise 8 GHz of wide-band dust continuum ranging in frequency from 336.5–350.5 GHz, with a mean frequency of 343.479 GHz (873 ). The flux, bandpass, and phase calibrators were Titan, J1517-2422, and J1610-3958, respectively; these calibrators were chosen automatically by querying the ALMA source catalog when the project was executed. The polarization calibrator, J1549+0237, was chosen by hand because of its high polarization fraction. At Band 7 (870 µm), ALMA’s flux-calibration accuracy is 10%, as determined by the observatory flux monitoring program. For a detailed discussion of the ALMA polarization system, see Nagai et al. (2016). Note that the uncertainties quoted in this work are all statistical unless otherwise specified.
The dust continuum images were produced by using the Common Astronomy Software Applications (CASA, McMullin et al. 2007) task TCLEAN with a Briggs weighting parameter of robust = 0.5. The images were improved by performing four rounds of phase-only self-calibration using the total intensity (Stokes ) image as a model (the shortest interval for determining the gain solutions was 10 s). The Stokes , , and maps (where the and maps show the polarized emission) were each cleaned independently with an appropriate number of TCLEAN iterations after the final round of self-calibration. The rms noise level in the final Stokes dust map is Jy beam-1, whereas the rms noise level in the map of polarized intensity (see Equation 1 below) is Jy beam-1. The reason for this difference in noise levels is that the total intensity image is more dynamic-range limited than the polarized intensity images.
The quantities that can be derived from the polarization maps are the polarized intensity , the fractional polarization , and the polarization position angle :
| (1) | ||||
| (2) | ||||
| (3) |
Note that has a positive bias because it is always a positive quantity, even though the Stokes parameters and from which is derived can be either positive or negative. This bias has a particularly significant effect in low-signal-to-noise () measurements. Note that while we do debias the polarized intensity map as described in Vaillancourt (2006) and Hull & Plambeck (2015), it has only a very minor effect on our results, as 80% of the polarization detections we report have a signal-to-noise ratio .
See Table V for the ALMA polarization data, which includes ; ; and its uncertainty ; and and its uncertainty ; at every position where polarization was detected (see the top panel of Figure 1). The systematic uncertainty in linear polarization observations with ALMA is 0.03% (corresponding to a minimum detectible polarization of 0.1%).
III. Results
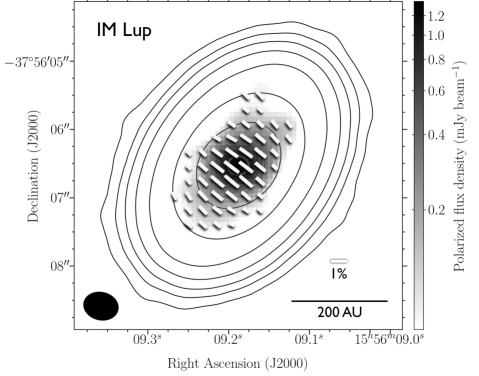
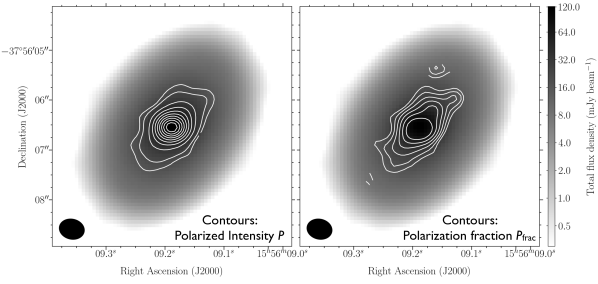
The results of our full-polarization, 870 µm dust continuum observations toward the IM Lup protoplanetary disk are shown in Figure 1. The large, upper panel depicts the polarized intensity (grayscale), total intensity (contours), and the orientation of the polarized emission (white line segments). The polarization is resolved in 13 independent beams across the bright, central region of the disk. When Nyquist sampled (plotted twice per synthesized beam in each dimension), this yields 52 polarization orientations, which are plotted everywhere where there is significant polarized emission, i.e., they have not been masked based on the Stokes map.222In the case of IM Lup, all polarization detections happen to be coincident with significant Stokes emission. However, this is not always the case: see, for example, the ALMA polarization observations of Serpens SMM1 in Hull et al. 2017a, where the authors detect highly significant polarized dust emission in regions where there is no significant Stokes . We also plot contour maps of the polarized intensity (Figure 1, lower-left panel) and the polarization fraction (lower-right panel), superposed on grayscale images of the total intensity. The integrated 870 µm flux of IM Lup from our observations is 580 mJy, consistent with previous ALMA observations at the same frequency (Cleeves et al., 2016).
To test for frequency dependence in the polarization toward IM Lup, we made images of polarized intensity and polarization angle from each of the four individual correlator bands in the dataset. As mentioned in § II, these bands ranged in frequency from 336.5–350.5 GHz; the maximum difference of 14 GHz yields a fractional bandwidth difference of 4%. We found no significant changes in polarized intensity, polarization fraction, or polarization angle as a function of frequency, indicating that multi-wavelength studies of disk polarization (e.g., the work on HL Tau by Stephens et al. 2017) will require observations at multiple distinct ALMA bands with wide frequency separations.
As has been the case with several polarization results from ALMA including Stephens et al. (2017) and Vlemmings et al. (2017), we detect a marginal circularly-polarized signal in the Stokes map; however, the circular polarization fraction is only 0.17% of the total intensity. This value is smaller than the current 0.6% systematic uncertainty in ALMA circular polarization observations, and thus could be spurious.
III.1. Distribution of polarization angles across the IM Lup disk
In Figure 2 we plot a histogram of the polarization orientations in the map of IM Lup shown in Figure 1, where each individual polarization angle measurement was binned presuming it had a Gaussian probability distribution function (PDF) with the mean and standard deviation listed in Table V. The peak of the histogram depends on the number of bins, but it is always consistent with the 48 orientation of the minor axis of the disk to within the 3.6 uncertainty plotted in the histogram. 3.6 is the mean of the statistical uncertainties in all of the polarization angles detected toward IM Lup. We choose this mean value to represent the intrinsic statistical scatter in the polarization angles because each angle has an uncertainty that is dependent on the signal-to-noise of the polarized intensity at the given location in the disk (see Table V).
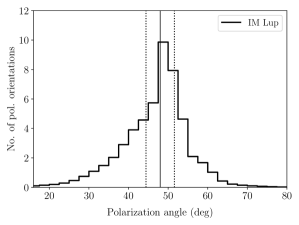
A notable feature of the distribution of polarization angles in Figure 2 is the significant width beyond the bounds of the uncertainty, revealing that many of the polarization angles deviate significantly from the orientation of IM Lup’s minor axis. This is the result of a slight azimuthal curvature in the polarization orientations furthest from the disk center (along the major axis), seen in the top panel of Figure 1. This is consistent with the pure-scattering models by Yang et al. (2016a, 2017), as well as with the morphology of the polarization in the 870 observations of HL Tau reported in Stephens et al. (2017). Note, however, that while the slight azimuthal curvature can be explained by pure self-scattering, it could also be due to the superposition of polarized emission both from self-scattering and from dust grains aligned with the dust emission gradient (Tazaki et al., 2017). This superposition can be seen most clearly in the 1.3 mm ALMA image of HL Tau reported in Stephens et al. (2017); however, those data show far more curvature in the polarization angles than the 870 IM Lup data we present here, suggesting that alignment of dust grains with the dust emission gradient is not contributing significantly to our 870 polarization observations.
IV. Discussion
IV.1. Comparing the polarization fraction profiles of IM Lup and HL Tau
These observations of IM Lup are the second 850 ALMA polarization observations of an inclined, full (e.g., non-transition) disk, after the HL Tau observations published in Stephens et al. (2017). Both the IM Lup and the HL Tau observations show characteristics that are broadly consistent with models of dust self-scattering from an inclined disk.
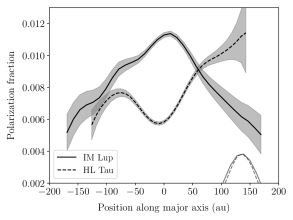
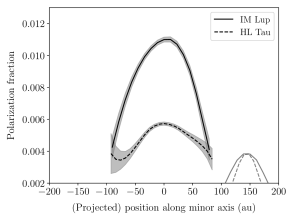
However, substantial differences between the two sources are revealed in Figure 3, which shows 1-dimensional cuts of the polarization fraction across the major axis (left) and minor axis (right) of both IM Lup and HL Tau (the 870 HL Tau data are from Stephens et al. 2017). Both the major- and minor-axis profiles of IM Lup peak at the center. However, only HL Tau’s minor-axis profile peaks at the center; its major-axis profile has a central depression in the polarization fraction. As shown in Stephens et al. (2017), the polarization orientations at 870 are roughly along the minor axis, thus it is unlikely that the depression is because of plane-of-sky smearing of the polarization signal within the central synthesized beam (as opposed to the 3 mm ALMA map of HL Tau shown in Kataoka et al. 2017 and Stephens et al. 2017, where the central beam is smeared as a result of the azimuthal polarization pattern). It is more likely that the depression along the major axis is caused by HL Tau’s high optical depth at 870 – 1.3 mm wavelengths (ALMA Partnership et al., 2015; Carrasco-González et al., 2016; Jin et al., 2016), which is predicted to reduce the polarization fraction (Kataoka et al., 2015; Yang et al., 2017).
Alternatively, the fact that the polarization fraction in IM Lup is substantially higher than in HL Tau could be because IM Lup is a more evolved source than HL Tau, and thus has had a longer time for grains to grow larger. However, considering the similar estimates for the maximum grain size in the two sources (see § IV.2), it is not clear that this is the case.
IV.2. Maximum grain-size estimate for IM Lup
To estimate the maximum size of the dust grains responsible for the observed scattering polarization, we adopt the IM Lup disk model based on Cleeves et al. (2016), taking into account only millimeter-sized dust grains. The model is one of a viscous disk (Lynden-Bell & Pringle, 1974) with a column density of dust at a radius . The scale height of the millimeter grains is au at , which is the scale height of the gas and the micron-sized grains. The surface-density power-law index . For the dust grain model, we adopted the one used by Kataoka et al. (2015) and Yang et al. (2016a), which assumes spherical grains comprising a mixture of water ice (62%), organics (30%), and silicates (8%). All fractional abundances are by volume and are taken from Pollack et al. (1994). The grain size distribution follows the Mathis, Rumpl & Nordsieck (MRN)-type power-law (Mathis et al., 1977), with a fixed minimum grain size .
We calculate the absorption/scattering opacities, as well as the full scattering phase matrix, with Mie theory (Bohren & Huffman, 1983). We then calculate polarization by varying the maximum grain size with the Monte Carlo Radiative Transfer code RADMC-3D (Dullemond et al., 2012). We can reproduce the observed polarization in our 870 IM Lup observations with of 61 . This is very close to the 72 value estimated by Yang et al. (2016a), who modeled 1.3 mm HL Tau observations by Stephens et al. (2014).
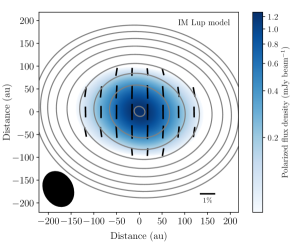
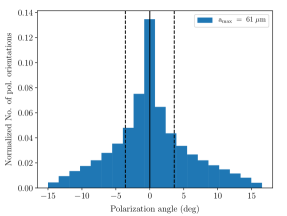
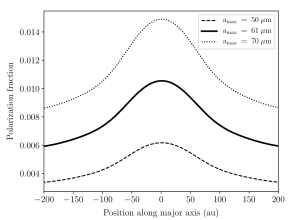
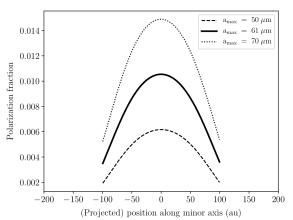
We show the results of our best-fit model in Figure 4. We find that the histogram of the polarization angles in the model (Figure 4, upper-right panel) is in good agreement with the that of the observations (Figure 2), in that both histograms show a significant spread in angles. In addition, the predicted distributions of the polarization fraction along the major and minor axes agree well with observations, peaking at 1.1% when the maximum grain size is set to be 61 (see the thick, solid lines in the bottom panels of Figure 4). We tested slightly larger (70 ) and smaller (50 ) maximum grain sizes, and found that they do not reproduce the observations (see the dotted and dashed curves in the bottom panels of Figure 4).
As a consistency check, we repeat the exercise of Kataoka et al. (2017), who analyzed the polarization of HL Tau using a metric they refer to as the “total polarization fraction,” which is simply the integrated polarized intensity divided by the integrated total intensity . We find that the total polarization fraction of IM Lup in our 870 observations is ; for the HL Tau observations from Stephens et al. (2017), the total polarization fractions are 0.62% (870 ) and 0.67% (1.3 mm). Estimating the maximum grain sizes from the curves in Figure 4 of Kataoka et al. (2017), we find all of the above values of the total polarization fraction (at their respective wavelengths) are roughly consistent with a maximum size of 70 for the grains producing the polarized emission. These polarization fractions (calculated by averaging across the entire disk) are consistent with the previous non-detections of polarization in lower-resolution (1–2) observations of Class II circumstellar disks (Hughes et al., 2009, 2013); the detection of 870 polarization in both IM Lup and HL Tau suggests that the polarized emission produced by self-scattering might have been detectable in the aforementioned CARMA and SMA observations if they had had the sensitivity to detect polarization fractions at the 0.5% level.
On one hand, the fact that a variety of distinct models yield similar maximum grain-size estimates for HL Tau and IM Lup is encouraging. On the other hand, considering the major differences between the two disks (e.g., both polarization fraction and evolutionary state), the fact that the maximum grain sizes for both HL Tau and IM Lup are 70 is unexpected. Furthermore, it is unnerving that 70 is so different from the millimeter/centimeter sizes of grains that many studies have inferred to be responsible for the bulk of the detected (unpolarized) dust emission in disks (Pérez et al., 2012; Trotta et al., 2013; Pérez et al., 2015; Tazzari et al., 2016; Liu et al., 2017). This issue is discussed in Kataoka et al. (2016a) and Yang et al. (2016a), where they mention several possible ways to reconcile the maximum grain-size estimates from scattering models and from models of the dust emission spectrum: for example, scattering by “fluffy,” porous grains as opposed to the simple spherical grains assumed by Mie theory; or separate populations of grains responsible for the observed polarization versus the bulk of the unpolarized emission.
IV.3. Constraining dust settling using disk near/far-side asymmetry and polarization orientations
IV.3.1 Scattering and optical depth
Polarization from self-scattering is most easily produced when the disk is moderately optically thick. When discussing optical depth in the context of dust self-scattering models, one must consider two optical depths for the dust layer: one perpendicular to the disk plane, , and the other through the mid-plane of the disk, . The one typically referred to is , which is essentially the column density, and which controls the percentage of the scattering-produced polarization for given grain properties. Scattering models suggest that the maximum polarization fraction occurs near (Yang et al., 2017); to have an appreciable polarization, the optical depth cannot be too small, but the actual number will depend on grain properties.
Cleeves et al. (2016) find that the inner 40 au of the disk is optically thick (). Their model finds that the rest of the disk is optically thin (); however, they also report tentative evidence of ringed structures, which could potentially be optically thick, but are not resolved at the low resolution of their (or our) observations. Based on results from Stephens et al. (2017), the ringed structures in HL Tau have sufficient optical depth to produce scattering; the effect of such rings on disk polarization profiles was discussed by Kataoka et al. (2016a) and Pohl et al. (2016). Future modeling will allow us to explore whether concentrating (sub)millimeter-sized grains into rings (as expected by pressure-maximum-induced dust trapping) would make dust self-scattering more or less efficient, and whether the polarization pattern would change.
IV.3.2 Constraining dust settling in IM Lup
Based on their modeling of ALMA 1.3 mm and 870 continuum and spectral-line observations toward IM Lup, Cleeves et al. (2016) found that the gas and the micron-sized grains in the IM Lup disk have a significant vertical extent (with a scale height of 12 au at a radius of 100 au; this is consistent with Very Large Telescope (VLT) SPHERE/IRDIS observations of IM Lup in optical scattered light; Avenhaus et al. 2018). The scale height of the millimeter-sized grains is 4 less; however, to reproduce the significant depletion of spectral-line emission in the inner 40 au of the disk (which they attribute to absorption by optically thick dust), some amount of turbulent lofting of millimeter grains is necessary.
Dust settling can be constrained with scattering models (e.g., Kataoka et al. 2015; Yang et al. 2017). Yang et al. (2017) have shown that, in inclined disks such as IM Lup, the near side of the disk would be significantly brighter in polarized intensity than the far side if the disk were optically thick (i.e., ) and the grains responsible for the scattering-induced polarization had a significant vertical extent. There is no obvious near/far-side asymmetry detected in our observations (Figure 1); thus, if IM Lup were marginally optically thick () in the region where polarization is detected, it would be reasonable to conclude that the 60 -sized grains that efficiently scatter the 870 m photons have already settled into a relatively thin layer (this is similar to what was found in HL Tau by Stephens et al. 2017). This settling may be inconsistent with the lofting of large grains333Here we categorize both the 60 grains in IM Lup and the millimeter-sized grains in the Cleeves et al. (2016) models as “large.” expected based on the work by Cleeves et al. (2016); however, based on their modeling, it is not clear what the exact optical depth is across the region where we detect polarization, and thus we cannot currently draw firm quantitative conclusions about dust settling.
At larger radii, where the disk is optically thin in the vertical direction (i.e., ), one can in principle constrain the geometric thickness of the dust layer using the polarization orientation relative to the (projected) disk minor axis. The reason is that the orientation of the scattering-induced polarization at a given location in an inclined disk depends on the anisotropy of the incident radiation field in the plane of the disk at that location. If the disk-plane radiation field is nearly isotropic, as would be the case if the optical depth in the plane of the disk were larger than unity (i.e., ), the polarization of the scattered light would be along the minor axis of the inclined disk. If, on the other hand, the dust were optically thin in the disk plane, the incident radiation field would be strongly beamed in the radial direction, which would lead to a more azimuthal polarization orientation. Since most of the polarization orientations observed in IM Lup are along the minor axis (see Figure 1), it is likely that the region where significant polarization is detected is optically thick along the disk plane (i.e., ). Since depends on the geometric thickness, , of the disk (i.e., for a given surface density, the smaller is, the larger would become), polarization observations—in concert with full radiative-transfer modeling—could in principle be used to constrain the thickness of the layer of grains in IM Lup that are responsible for the observed polarization pattern.
IV.4. Magnetic fields or scattering in the IM Lup disk?
Magnetic fields are thought to play a crucial role in the dynamics and evolution of disks around young stars via the MRI and magnetized disk winds. If a disk were fully turbulent due to the MRI, the magnetic field orientation would change on dynamical timescales, and would be dominated by the turbulent component of the magnetic field. In this case, grain alignment would be possible only when it occurs very quickly, and the resulting dust-polarization configuration would either exhibit random patterns or would be unpolarized. However, observational and theoretical studies point toward weak turbulence (Hughes et al., 2011; Guilloteau et al., 2012; Flaherty et al., 2015; Simon et al., 2015; Teague et al., 2016; Flaherty et al., 2017, 2018) and largely laminar magnetic fields with more stable magnetic structures dominated by a toroidal field component (e.g., Bai, 2017). In this case, alignment of grains with the magnetic field is possible only when the alignment timescale is shorter than the gas damping timescale. Tazaki et al. (2017) showed that the precession timescale of millimeter-sized grains around magnetic fields (which is the first step toward magnetic grain alignment) can significantly exceed the gas damping timescale in the outer disk, making alignment unfavorable in that region. Nevertheless, the field strength adopted by Tazaki et al. (2017) is relatively low (the field strength they adopt is equal to their Equation 49 multiplied by 10, and is 100 G in the outer disk).
The magnetic alignment timescale can be brought down in the presence of a stronger magnetic field (and hence a larger accretion rate, e.g., Equations 7 and 16 of Bai & Goodman 2009). Recent estimates of IM Lup’s accretion rate suggest a rate of yr-1 (Alcalá et al., 2017), a typical value for Class II disks. If accretion is not far from steady state in IM Lup, it implies a 1–5 mG field strength at the 50–100 au scale.444The steady-state assumption in this estimate may not hold. Recent theoretical work by Simon et al. (2017) suggests that in order to have turbulent line-widths consistent with the current observational constraints, the magnetic field strength in the outer disk is likely to be very weak (e.g., 20 G at 100 au in the disk of HD 163296, analyzed by Flaherty et al. 2015, 2017), making the accretion rate there much smaller than the instantaneous accretion rate. Considering the calculations by Tazaki et al. (2017), such a field strength still appears insufficient to produce alignment in millimeter-sized grains. On the other hand, alignment might still be possible for Class 0/I disks with higher accretion rates (and hence stronger fields), and there is indeed evidence of magnetically aligned grains in the very early stages of star formation (Cox et al., 2015; Segura-Cox et al., 2015; Liu et al., 2016).
If the dominant grain size is 60 , as we infer above, then the precession timescale around the magnetic field is comparable to or smaller than the gas damping timescale, assuming the grains contain super-paramagnetic inclusions (whose properties are very uncertain). The magnetic alignment timescale is expected to be larger than the precession timescale by an unknown factor (Tazaki et al. 2017 assume a factor of 30). Given the substantial uncertainties, the case for magnetic alignment of 60 grains is unclear, but may be possible in the outer disk of IM Lup (where we detect no polarization). On the other hand, magnetic alignment becomes more favorable for smaller grains ( 1–10 in size), as was discussed in Li et al. (2016).
It is also worth noting that based on Tazaki et al. (2017), it appears that the timescales for alignment of both 60 and sub-millimeter-sized grains by the anisotropic radiation field are well below both the gas damping timescale and the magnetic alignment timescale, thus favoring alignment with the radiation field. However, we do not see an obvious contribution to the polarization pattern from alignment with the radiation field, suggesting that there are still substantial uncertainties in our understandings of the grain alignment theory.
V. Conclusions
We have presented 870 ALMA observations of polarized dust emission toward the protoplanetary disk surrounding the Class II source IM Lup. After analyzing the IM Lup polarization maps and comparing the results with previously published polarization data toward the Class I/II source HL Tau, we come to the following conclusions:
-
1.
We find that the orientation of the polarized emission is along the minor axis of the disk, and that the value of the polarization fraction increases steadily toward the center of the disk, reaching a peak value of 1.1%. All of these characteristics are consistent with models of self-scattering of submillimeter-wave emission from an optically thin inclined disk.
-
2.
The distribution of the polarization position angles across the IM Lup disk reveals that while the average orientation is along the minor axis, the polarization orientations show a significant spread in angles. This is consistent with models of pure scattering.
-
3.
We compare the polarization of IM Lup with that of HL Tau. A comparison of cuts of the polarization fraction across the major and minor axes of both sources reveals that IM Lup has a substantially higher polarization fraction than HL Tau toward the center of the disk. This enhanced polarization fraction could be due a number of factors, including higher optical depth in HL Tau, or scattering by larger dust grains in the more evolved IM Lup disk. However, models yield similar maximum grain sizes for both HL Tau (72 ) and IM Lup (61 , this work). This reveals continued tension between grain-size estimates from scattering models and from models of the dust emission spectrum, which find that the bulk of the (unpolarized) emission in disks is most likely due to millimeter (or even centimeter) sized grains.
The mounting evidence for scattering in (sub)millimeter-wavelength observations of protoplanetary disks, combined with the evidence for different polarization mechanisms at different wavelengths (Kataoka et al., 2017; Stephens et al., 2017), yield several requirements for progress in the field of disk polarization. The first is multi-wavelength observations, which, in combination with models and synthetic observations, will allow us to disentangle the various mechanisms that may be causing disk polarization, including dust self-scattering, alignment with the dust emission gradient, and alignment with the magnetic field. The second is higher-resolution observations of polarization in disks (given sufficient signal-to-noise) in order to understand the effects of disk sub-structure such as rings (e.g., ALMA Partnership et al., 2015) and spiral arms (Pérez et al., 2016; Boehler et al., 2018) on polarization profiles.
Finally, in light of the scant evidence for magnetically aligned grains at (sub)millimeter wavelengths in Class II disks, it seems likely that the best way to directly detect magnetic fields in disks will be via the Zeeman effect (Brauer et al., 2017) or via spectral-line polarization (e.g., the Goldreich-Kylafis effect; Goldreich & Kylafis 1981). Spectral-line polarization observations are already possible with ALMA; Zeeman observations will also soon be possible (although Brauer et al. note that the signal will be difficult to detect in all but the brightest disks with high [ 1 mG] magnetic field strengths and high abundances of CN.) These spectropolarimetric observations will allow us to continue to refine our understanding of the role of the magnetic in star formation at the scales of protoplanetary disks, while in parallel we can use observations of scattering-induced polarization to probe grain growth in protoplanetary disks, which is a crucial step toward the formation of planets (Testi et al., 2014).
| (°) | (°) | (°) | (°) | ||||
|---|---|---|---|---|---|---|---|
| 239.03854 | –37.93539 | 15.953 | 0.086 | 51.7 | 6.2 | 0.0054 | 0.0011 |
| 239.03846 | –37.93539 | 18.887 | 0.112 | 48.3 | 4.7 | 0.0059 | 0.0010 |
| 239.03839 | –37.93539 | 19.832 | 0.106 | 50.6 | 4.9 | 0.0053 | 0.0009 |
| 239.03832 | –37.93539 | 18.730 | 0.076 | 66.4 | 6.8 | 0.0041 | 0.0010 |
| 239.03854 | –37.93533 | 19.116 | 0.111 | 40.5 | 4.7 | 0.0058 | 0.0009 |
| 239.03846 | –37.93533 | 24.032 | 0.164 | 43.4 | 3.2 | 0.0068 | 0.0007 |
| 239.03839 | –37.93533 | 27.408 | 0.188 | 50.9 | 2.8 | 0.0068 | 0.0007 |
| 239.03832 | –37.93533 | 27.130 | 0.163 | 59.1 | 3.2 | 0.0060 | 0.0007 |
| 239.03824 | –37.93533 | 23.048 | 0.111 | 55.7 | 4.7 | 0.0048 | 0.0008 |
| 239.03817 | –37.93533 | 17.343 | 0.069 | 45.8 | 7.5 | 0.0040 | 0.0010 |
| 239.03861 | –37.93527 | 15.020 | 0.079 | 23.8 | 6.6 | 0.0052 | 0.0012 |
| 239.03854 | –37.93527 | 21.742 | 0.134 | 32.5 | 3.9 | 0.0062 | 0.0008 |
| 239.03846 | –37.93527 | 31.406 | 0.242 | 43.5 | 2.1 | 0.0077 | 0.0006 |
| 239.03839 | –37.93527 | 43.068 | 0.369 | 49.7 | 1.4 | 0.0086 | 0.0004 |
| 239.03832 | –37.93527 | 48.296 | 0.403 | 51.2 | 1.3 | 0.0084 | 0.0004 |
| 239.03824 | –37.93527 | 39.648 | 0.284 | 48.5 | 1.8 | 0.0072 | 0.0005 |
| 239.03817 | –37.93527 | 25.788 | 0.105 | 49.0 | 5.0 | 0.0041 | 0.0007 |
| 239.03854 | –37.93521 | 22.950 | 0.101 | 35.2 | 5.1 | 0.0044 | 0.0008 |
| 239.03846 | –37.93521 | 39.601 | 0.293 | 46.6 | 1.8 | 0.0074 | 0.0005 |
| 239.03839 | –37.93521 | 71.463 | 0.733 | 49.9 | 0.7 | 0.0103 | 0.0003 |
| 239.03832 | –37.93521 | 96.251 | 1.069 | 50.3 | 0.5 | 0.0111 | 0.0002 |
| 239.03824 | –37.93521 | 76.670 | 0.780 | 49.2 | 0.7 | 0.0102 | 0.0002 |
| 239.03817 | –37.93521 | 41.019 | 0.283 | 47.7 | 1.8 | 0.0069 | 0.0004 |
| 239.03854 | –37.93515 | 21.263 | 0.084 | 41.6 | 6.3 | 0.0039 | 0.0008 |
| 239.03846 | –37.93515 | 40.420 | 0.279 | 49.2 | 1.9 | 0.0069 | 0.0004 |
| 239.03839 | –37.93515 | 83.335 | 0.835 | 52.0 | 0.6 | 0.0100 | 0.0002 |
| 239.03832 | –37.93515 | 118.774 | 1.301 | 52.7 | 0.4 | 0.0110 | 0.0002 |
| 239.03824 | –37.93515 | 94.140 | 0.974 | 52.3 | 0.5 | 0.0103 | 0.0002 |
| 239.03817 | –37.93515 | 49.330 | 0.405 | 50.0 | 1.3 | 0.0082 | 0.0004 |
| 239.03809 | –37.93515 | 25.967 | 0.113 | 42.1 | 4.6 | 0.0043 | 0.0007 |
| 239.03854 | –37.93510 | 17.115 | 0.069 | 44.7 | 7.7 | 0.0041 | 0.0011 |
| 239.03846 | –37.93510 | 28.915 | 0.160 | 45.3 | 3.2 | 0.0055 | 0.0006 |
| 239.03839 | –37.93510 | 51.895 | 0.414 | 52.8 | 1.2 | 0.0080 | 0.0003 |
| 239.03832 | –37.93510 | 70.911 | 0.643 | 55.3 | 0.8 | 0.0091 | 0.0003 |
| 239.03824 | –37.93510 | 62.504 | 0.597 | 54.7 | 0.9 | 0.0096 | 0.0003 |
| 239.03817 | –37.93510 | 41.216 | 0.359 | 51.2 | 1.4 | 0.0087 | 0.0004 |
| 239.03809 | –37.93510 | 25.989 | 0.150 | 43.3 | 3.5 | 0.0058 | 0.0007 |
| 239.03839 | –37.93504 | 27.455 | 0.133 | 59.3 | 3.9 | 0.0048 | 0.0007 |
| 239.03832 | –37.93504 | 34.876 | 0.248 | 60.4 | 2.1 | 0.0071 | 0.0005 |
| 239.03824 | –37.93504 | 35.688 | 0.300 | 55.6 | 1.7 | 0.0084 | 0.0005 |
| 239.03817 | –37.93504 | 30.041 | 0.238 | 50.3 | 2.2 | 0.0079 | 0.0006 |
| 239.03809 | –37.93504 | 22.773 | 0.161 | 42.3 | 3.2 | 0.0071 | 0.0008 |
| 239.03802 | –37.93504 | 16.565 | 0.094 | 38.4 | 5.6 | 0.0057 | 0.0011 |
| 239.03832 | –37.93498 | 21.929 | 0.117 | 55.5 | 4.4 | 0.0054 | 0.0008 |
| 239.03824 | –37.93498 | 23.556 | 0.141 | 52.2 | 3.7 | 0.0060 | 0.0008 |
| 239.03817 | –37.93498 | 22.219 | 0.120 | 46.5 | 4.3 | 0.0054 | 0.0008 |
| 239.03809 | –37.93498 | 18.752 | 0.115 | 41.7 | 4.5 | 0.0062 | 0.0010 |
| 239.03802 | –37.93498 | 14.755 | 0.079 | 37.5 | 6.7 | 0.0053 | 0.0012 |
| 239.03824 | –37.93492 | 16.979 | 0.077 | 48.9 | 6.7 | 0.0045 | 0.0011 |
| 239.03817 | –37.93492 | 16.740 | 0.068 | 42.9 | 7.5 | 0.0041 | 0.0011 |
| 239.03824 | –37.93486 | 11.755 | 0.068 | 42.8 | 7.6 | 0.0058 | 0.0015 |
| 239.03817 | –37.93486 | 11.965 | 0.076 | 43.5 | 6.9 | 0.0064 | 0.0015 |
Note. is the total intensity, reported where . is the polarized intensity, reported where . is the orientation of the polarization, measured counterclockwise from north. is the statistical uncertainty in the polarization orientation. is the polarization fraction , reported where . is the statistical uncertainty in the polarization fraction (note that in the highest signal-to-noise points, these values are smaller than the 0.03% systematic uncertainty in ). This table, in machine-readable format, is available in the online version of this publication.
References
- Alcalá et al. (2017) Alcalá, J. M., Manara, C. F., Natta, A., et al. 2017, A&A, 600, A20
- ALMA Partnership et al. (2015) ALMA Partnership, Brogan, C. L., Pérez, L. M., et al. 2015, ApJ, 808, L3
- Andersson et al. (2015) Andersson, B.-G., Lazarian, A., & Vaillancourt, J. E. 2015, ARA&A, 53, 501
- Avenhaus et al. (2018) Avenhaus, H., Quanz, S. P., Garufi, A., et al. 2018, ArXiv e-prints, arXiv:1803.10882
- Bai (2017) Bai, X.-N. 2017, ApJ, 845, 75
- Bai & Goodman (2009) Bai, X.-N., & Goodman, J. 2009, ApJ, 701, 737
- Balbus & Hawley (1991) Balbus, S. A., & Hawley, J. F. 1991, ApJ, 376, 214
- Blandford & Payne (1982) Blandford, R. D., & Payne, D. G. 1982, MNRAS, 199, 883
- Boehler et al. (2018) Boehler, Y., Ricci, L., Weaver, E., et al. 2018, ApJ, 853, 162
- Bohren & Huffman (1983) Bohren, C. F., & Huffman, D. R. 1983, Absorption and scattering of light by small particles (Wiley (New York))
- Brauer et al. (2017) Brauer, R., Wolf, S., & Flock, M. 2017, A&A, 607, A104
- Carrasco-González et al. (2016) Carrasco-González, C., Henning, T., Chandler, C. J., et al. 2016, ApJ, 821, L16
- Cho & Lazarian (2007) Cho, J., & Lazarian, A. 2007, ApJ, 669, 1085
- Cleeves et al. (2016) Cleeves, L. I., Öberg, K. I., Wilner, D. J., et al. 2016, ApJ, 832, 110
- Cox et al. (2018) Cox, E. G., Harris, R. J., Looney, L. W., et al. 2018, ArXiv e-prints, arXiv:1802.00449
- Cox et al. (2015) —. 2015, ApJ, 814, L28
- Dullemond et al. (2012) Dullemond, C. P., Juhasz, A., Pohl, A., et al. 2012, RADMC-3D: A multi-purpose radiative transfer tool, Astrophysics Source Code Library, ascl:1202.015
- Fernández-López et al. (2016) Fernández-López, M., Stephens, I. W., Girart, J. M., et al. 2016, ApJ, 832, 200
- Finkenzeller & Basri (1987) Finkenzeller, U., & Basri, G. 1987, ApJ, 318, 823
- Flaherty et al. (2015) Flaherty, K. M., Hughes, A. M., Rosenfeld, K. A., et al. 2015, ApJ, 813, 99
- Flaherty et al. (2018) Flaherty, K. M., Hughes, A. M., Teague, R., et al. 2018, ArXiv e-prints, arXiv:1803.03842
- Flaherty et al. (2017) Flaherty, K. M., Hughes, A. M., Rose, S. C., et al. 2017, ApJ, 843, 150
- Gaia Collaboration et al. (2016) Gaia Collaboration, Brown, A. G. A., Vallenari, A., et al. 2016, A&A, 595, A2
- Girart et al. (2006) Girart, J. M., Rao, R., & Marrone, D. P. 2006, Science, 313, 812
- Girart et al. (2018) Girart, J. M., Fernandez-Lopez, M., Li, Z.-Y., et al. 2018, ArXiv e-prints, arXiv:1803.06165
- Goldreich & Kylafis (1981) Goldreich, P., & Kylafis, N. D. 1981, ApJ, 243, L75
- Guilloteau et al. (2012) Guilloteau, S., Dutrey, A., Wakelam, V., et al. 2012, A&A, 548, A70
- Günther et al. (2010) Günther, H. M., Matt, S. P., Schmitt, J. H. M. M., et al. 2010, A&A, 519, A97
- Hughes et al. (2013) Hughes, A. M., Hull, C. L. H., Wilner, D. J., & Plambeck, R. L. 2013, AJ, 145, 115
- Hughes et al. (2011) Hughes, A. M., Wilner, D. J., Andrews, S. M., Qi, C., & Hogerheijde, M. R. 2011, ApJ, 727, 85
- Hughes et al. (2009) Hughes, A. M., Wilner, D. J., Cho, J., et al. 2009, ApJ, 704, 1204
- Hull & Plambeck (2015) Hull, C. L. H., & Plambeck, R. L. 2015, Journal of Astronomical Instrumentation, 4, 1550005
- Hull et al. (2013) Hull, C. L. H., Plambeck, R. L., Bolatto, A. D., et al. 2013, ApJ, 768, 159
- Hull et al. (2014) Hull, C. L. H., Plambeck, R. L., Kwon, W., et al. 2014, ApJS, 213, 13
- Hull et al. (2017a) Hull, C. L. H., Girart, J. M., Tychoniec, Ł., et al. 2017a, ApJ, 847, 92
- Hull et al. (2017b) Hull, C. L. H., Mocz, P., Burkhart, B., et al. 2017b, ApJ, 842, L9
- Jin et al. (2016) Jin, S., Li, S., Isella, A., Li, H., & Ji, J. 2016, ApJ, 818, 76
- Kataoka et al. (2016a) Kataoka, A., Muto, T., Momose, M., Tsukagoshi, T., & Dullemond, C. P. 2016a, ApJ, 820, 54
- Kataoka et al. (2017) Kataoka, A., Tsukagoshi, T., Pohl, A., et al. 2017, ApJ, 844, L5
- Kataoka et al. (2015) Kataoka, A., Muto, T., Momose, M., et al. 2015, ApJ, 809, 78
- Kataoka et al. (2016b) Kataoka, A., Tsukagoshi, T., Momose, M., et al. 2016b, ApJ, 831, L12
- Lazarian (2007) Lazarian, A. 2007, J. Quant. Spec. Radiat. Transf., 106, 225
- Lee et al. (2018) Lee, C.-F., Li, Z.-Y., Ching, T.-C., Lai, S.-P., & Yang, H. 2018, ApJ, 854, 56
- Li et al. (2016) Li, D., Pantin, E., Telesco, C. M., et al. 2016, ApJ, 832, 18
- Li et al. (2018) Li, D., Telesco, C. M., Zhang, H., et al. 2018, MNRAS, 473, 1427
- Liu et al. (2016) Liu, H. B., Lai, S.-P., Hasegawa, Y., et al. 2016, ApJ, 821, 41
- Liu et al. (2017) Liu, Y., Henning, T., Carrasco-González, C., et al. 2017, A&A, 607, A74
- Lommen et al. (2007) Lommen, D., Wright, C. M., Maddison, S. T., et al. 2007, A&A, 462, 211
- Lynden-Bell & Pringle (1974) Lynden-Bell, D., & Pringle, J. E. 1974, MNRAS, 168, 603
- Martin et al. (1994) Martin, E. L., Rebolo, R., Magazzu, A., & Pavlenko, Y. V. 1994, A&A, 282, 503
- Mathis et al. (1977) Mathis, J. S., Rumpl, W., & Nordsieck, K. H. 1977, ApJ, 217, 425
- McMullin et al. (2007) McMullin, J. P., Waters, B., Schiebel, D., Young, W., & Golap, K. 2007, in Astronomical Society of the Pacific Conference Series, Vol. 376, Astronomical Data Analysis Software and Systems XVI, ed. R. A. Shaw, F. Hill, & D. J. Bell, 127
- Nagai et al. (2016) Nagai, H., Nakanishi, K., Paladino, R., et al. 2016, ApJ, 824, 132
- Panić et al. (2009) Panić, O., Hogerheijde, M. R., Wilner, D., & Qi, C. 2009, A&A, 501, 269
- Pérez et al. (2012) Pérez, L. M., Carpenter, J. M., Chandler, C. J., et al. 2012, ApJ, 760, L17
- Pérez et al. (2015) Pérez, L. M., Chandler, C. J., Isella, A., et al. 2015, ApJ, 813, 41
- Pérez et al. (2016) Pérez, L. M., Carpenter, J. M., Andrews, S. M., et al. 2016, Science, 353, 1519
- Pinte et al. (2008) Pinte, C., Padgett, D. L., Ménard, F., et al. 2008, A&A, 489, 633
- Pohl et al. (2016) Pohl, A., Kataoka, A., Pinilla, P., et al. 2016, A&A, 593, A12
- Pollack et al. (1994) Pollack, J. B., Hollenbach, D., Beckwith, S., et al. 1994, ApJ, 421, 615
- Rao et al. (2014) Rao, R., Girart, J. M., Lai, S.-P., & Marrone, D. P. 2014, ApJ, 780, L6
- Rao et al. (2009) Rao, R., Girart, J. M., Marrone, D. P., Lai, S.-P., & Schnee, S. 2009, ApJ, 707, 921
- Segura-Cox et al. (2015) Segura-Cox, D. M., Looney, L. W., Stephens, I. W., et al. 2015, ApJ, 798, L2
- Simon et al. (2017) Simon, J. B., Bai, X.-N., Flaherty, K. M., & Hughes, A. M. 2017, ArXiv e-prints, arXiv:1711.04770
- Simon et al. (2015) Simon, J. B., Hughes, A. M., Flaherty, K. M., Bai, X.-N., & Armitage, P. J. 2015, ApJ, 808, 180
- Stephens et al. (2013) Stephens, I. W., Looney, L. W., Kwon, W., et al. 2013, ApJ, 769, L15
- Stephens et al. (2014) —. 2014, Nature, 514, 597
- Stephens et al. (2017) Stephens, I. W., Yang, H., Li, Z.-Y., et al. 2017, ApJ, 851, 55
- Tazaki et al. (2017) Tazaki, R., Lazarian, A., & Nomura, H. 2017, ApJ, 839, 56
- Tazzari et al. (2016) Tazzari, M., Testi, L., Ercolano, B., et al. 2016, A&A, 588, A53
- Teague et al. (2016) Teague, R., Guilloteau, S., Semenov, D., et al. 2016, A&A, 592, A49
- Testi et al. (2014) Testi, L., Birnstiel, T., Ricci, L., et al. 2014, Protostars and Planets VI, 339
- Tripathi et al. (2017) Tripathi, A., Andrews, S. M., Birnstiel, T., & Wilner, D. J. 2017, ApJ, 845, 44
- Trotta et al. (2013) Trotta, F., Testi, L., Natta, A., Isella, A., & Ricci, L. 2013, A&A, 558, A64
- Turner et al. (2014) Turner, N. J., Fromang, S., Gammie, C., et al. 2014, Protostars and Planets VI, 411
- Vaillancourt (2006) Vaillancourt, J. E. 2006, PASP, 118, 1340
- Vlemmings et al. (2017) Vlemmings, W. H. T., Khouri, T., Martí-Vidal, I., et al. 2017, A&A, 603, A92
- Yang et al. (2016a) Yang, H., Li, Z.-Y., Looney, L., & Stephens, I. 2016a, MNRAS, 456, 2794
- Yang et al. (2016b) Yang, H., Li, Z.-Y., Looney, L. W., et al. 2016b, MNRAS, 460, 4109
- Yang et al. (2017) Yang, H., Li, Z.-Y., Looney, L. W., Girart, J. M., & Stephens, I. W. 2017, MNRAS, 472, 373