Analysis of interacting and isolated quasars
Abstract
Aims. The main goal of this study was to determine the effects on equivalent widths (EWs) of some spectral lines produced in the quasars by the presence of surrounding galaxies. To carry this out, a sample of 4663 quasars (QSOs) in the redshift range of 0.20 to 0.40 from the Sloan Digital Sky Survey–Data Release 7 was analyzed.
Methods. Three QSO sub-samples were defined, taking into account the projected separations and radial velocity differences with neighboring galaxies. In this way, we utilized two sub-samples of QSOs with strong and weak galaxy interactions, with projected separations smaller than 70 kpc, and between 70 and 140 kpc, respectively, and with radial velocity differences less than km s-1. These sub-samples were compared with isolated QSOs defined as having greater projected separations and radial velocity differences to the galaxies.
Results. From a statistical study of the EWs of relevant spectral lines in the QSOs, we show an increment of the EWs of about 20% in the [OIII] lines and 7% in Hα for QSOs with stronger galaxy interactions relative to the isolated QSOs. These increments were also observed restricting the sub-samples to velocity differences of km s-1. These results indicate that some line EWs of QSOs could be marginally influenced by the environment and that they are not affected by the emission of the host galaxy, which was estimated to be around 10% of the total emission.
Furthermore, in order to gain a better understanding of the origin of the Hα emission line, we performed broad and narrow line decomposition in 100 QSOs in the restricted Sint sub-sample and also 100 randomly selected QSOs in the Iso sub-sample. When these QSOs were compared, the narrow component remained constant whereas the broad component was incremented. Our results, which reveal slight differences in EWs of some emission lines, suggest that galaxy interactions with QSOs may affect the QSO activity.
Key Words.:
galaxies: interactions – (galaxies:) quasars: general.1 Introduction
Active galactic nuclei (AGN) typically emit large amounts of radiation at all frequencies, with the observed spectra being composed of a non-thermal continuum with emission and absorption lines arising from small central regions, only a few parsecs across (Osterbrock 1989, Carswell et al. 1976). The AGNs are powered by gas, dust, and stars in a disk when falling into a super-massive black hole (Zel’dovich & Novikov 1965; Lynden-Bell 1969). To model AGNs, the existence of different regions is taken into account, such as the broad (BLR) and narrow line (NLR) regions, and the accretion disk and jets (Antonucci 1993; Urry & Padovani 1995).
Quasars (QSOs) are the most luminous AGNs, in which the optical images are dominated by a blue, very luminous, and variable unresolved nucleus (Schmidt 1969). The observed spectrum is the result of the integrated spectrum of both the host galaxy and the nucleus associated with the AGN. An important characteristic of the spectra is the presence of strong emission lines that can be used to infer both the physical conditions of the emitting gas and the properties of the ionization sources (Strittmatter & Williams 1976). In this sense, the broad lines, such as the Balmer series, are produced in the innermost regions (BLR, a few parsecs from the nucleus), that surround the accretion disk where the gas densities and velocities are high. These are the brightest recombination lines in the optical spectra of AGNs, and normally have complex line profiles that often exhibit both broad and narrow components emitted from physically distinct regions. In contrast, the narrow lines have their origin in more extended regions of about 50 pc in size, or NLRs, which are characterized by lower gas densities and velocities. The most important lines that are thought to be emitted within the NLRs of the AGNs are [OII], [OIII], [NeIII] and [NeV] (Osterbrock 1989). Heckman et al. (2004) and Kauffmann et al. (2003) have also suggested that the luminosity of the line [OIII] is a good tracer of AGN activity. This line is the strongest narrow emission line in the optical part of the spectrum with low contamination from the contribution of star formation in the host galaxy.
The intense brightness of QSOs puts serious constraints on the study of the host galaxies. However, at lower redshifts, the use of the Hubble Space Telescope has made possible the host galaxy observations, with interesting details in their morphologies. Bahcall, Kirhakos & Schneider (1997) studied luminous QSOs in different environments, and reported normal ellipticals and spirals and also strongly disturbed or interacting systems at z 0.3. Floyd et al. (2004) found that QSOs with nuclear luminosities M -24 mag and z 0.4 are massive bulge-dominated galaxies, thereby confirming the main results of Dunlop et al. (2003). At even lower redshifts (z 0.2), Jahnke, Kuhlbrodt & Wisotzki (2004) observed the presence of symmetric disk and elliptical host galaxies, suggesting that minor mergers or gas accretion are responsible for galaxy activity. More recently, Falomo et al. (2014) studied galaxy hosts in a QSO sample extracted from the Sloan Digital Sky Survey Seven Data Release (Abazajian et al. 2009, hereafter SDSS–DR7) Stripe 82 at z 0.5, and reported complex morphologies with bulge- and disk-dominated galaxies.
Hydrodynamical simulations of galaxy mergers (Di Matteo, Springel & Hernquist 2005) showed that two different phenomena may be generated, namely the production of intense star formation in the host galaxy and a fast increase in the accretion rate of the black hole. These interactions also have the potential to transport material to the central regions, producing AGN activity (Jogee 2006). Moreover, the proximity of the companion galaxy could affect the mass distribution, leading to gas inflows enhancing star formation activity when compared with isolated systems. Based on these simulations, we were interested in looking at QSO interactions with nearby galaxies to try to determine whether this phenomenon can generate changes in the QSO spectrum when compared with isolated QSOs. These changes in, for example, equivalent widths (EWs) can provide information about the physical conditions, and the distribution and dynamics of the emitting gas. Thus, a statistical analysis of EW spectral lines can reveal the influence of strong and weak galaxy interactions with QSOs.
The paper is organized as follows: in 2 we discuss the QSO sample and the available photometric and spectroscopic data for QSOs and neighboring galaxies. Based on typical projected distances and radial velocity differences, we also present our criteria for defining the three sub-samples used to analyze QSO interactions with galaxies. In 3 we discuss the spectral analysis including the statistical analysis of the EWs and uncertainties in relevant spectral lines together with the spectral decomposition. Finally, in 4 a summary is presented with the main results of this study. For all cosmology-dependent calculations, we have assumed = 0.7, = 0.3 and H0 = 70 km s-1.
2 Data and samples
In order to study the effects in the spectra of QSOs produced by surrounding galaxies, we need to define the QSO sample and the characterization of the QSO environments.
2.1 The quasars
We have selected QSOs from the SDSS Quasar Catalog–DR7 (SDSSQ–DR7, Schneider et al. 2010), which contains spectroscopically confirmed QSOs fainter than 15.0 mag and having at least one broad emission line in the spectrum with full width at half maximum (FWHM) larger than 1000 km s-1 or with complex absorption features. The QSOs have ugriz magnitudes with typical uncertainties of 0.03 mag, and have reliable spectroscopic redshifts in the range 0.065 to 5.460 with uncertainties of about 310-4 that roughly corresponds to 90 km s-1 (Stoughton et al. 2002). The QSO sample used in this study was defined in the redshift range 0.20 0.40 as the only restriction, comprising 4663 objects. This redshift range is adequate to perform the analysis of the QSO interactions with galaxies. The lower limit assures a significant number of QSOs with statistical significance, and the upper limit allows us to find galaxies around the QSOs within the completeness levels of the SDSS. Although there are new releases of the quasar catalog, DR10 (Pâris et al. 2014) and DR12 (Pâris et al. 2017), these adopt different procedures to define QSOs since their aim is to study those QSOs at higher redshifts, z 2.15. The SDSSQ–DR7 is the catalog with the most objects in our redshift range, (see Fig. 4 of Pâris et al. 2017) and therefore better suited for this study.
Figure 1 shows the distributions of absolute magnitudes in the i passband and redshifts of the QSO sample. The absolute magnitudes extend between -26.18 and -22.00 mag in the redshift range from 0.2 to 0.4.


2.2 Selection criteria
In order to establish the QSO interaction with neighboring galaxies, we used the projected separation, rp to the QSO and the relative radial velocity, defined as , where and are the QSO and galaxy redshift estimates, respectively. In this sense, we define the interaction QSO–galaxy as strong using tight rp and and weak, with moderate values. Also, isolated QSOs were defined as being those without neighboring galaxies. A similar procedure was adopted by Lambas et al. (2003) in a sample of galaxy pairs to analyze the interaction effects on galaxy star formation rates.
In order to define the three QSO sub-samples, we used galaxy data obtained from the Galaxy table of the CasJobs database from the SDSS–DR7 (Abazajian et al. 2009), which contains the photometric parameters of the objects classified as galaxies. This survey has photometric data in the ugriz passbands with an r′ limiting magnitude of 22.20 mag representing a 95% photometric completeness for point sources (Abazajian et al. 2004). The spectroscopic information has wavelength coverage in the range 3800-9200 Å with a spectral resolution of 2000, and the spectroscopic catalog is complete with a Petrosian r′ magnitude (Petrosian 1976) of 17.77 mag (Strauss et al. 2002).
Most of the galaxies have redshift information only from photometric estimates. They are based, for example, on empirical methods (e.g., Connolly et al. 1995) that use an artificial Neural Network and the ANNz code developed by Collister & Lahav (2004). These methods require a priori redshift information obtained through a training set of galaxies with both photometric and precise spectroscopic redshifts. O’ Mill et al. (2011) obtained photometric redshifts and k-corrections for galaxies with r′ = 21.5 mag of the SDSS–DR7 using the five ugriz passbands. The limiting magnitude guarantees a reasonable photometric redshift quality and a good separation between galaxies and stellar objects (Stoughton et al. 2002, Scranton et al. 2002). Their photometric redshift estimates are based on the empirical methods using the ANNz code and their Fig. 1 shows the comparison with the SDSS–DR7 spectroscopic redshfits. The agreement is excellent, especially in the range of our study, 0.2 0.40, with uncertainties of . We used O’ Mill et al. (2011) photometric estimates of galaxy redshifts in this work.
To define the QSO environment, we first determined suitable values of rp and parameters by estimating average galaxy surface density profiles and overdensities around the QSOs. We selected galaxies around the QSOs with rp from 0 to 500 kpc and with from 0 to 12000 km s-1. We used , the QSO spectroscopic redshift from SDSSQ–DR7 and , the galaxy photometric redshift estimates from O’ Mill et al. (2011).
For a given QSO, we obtained the galaxy surface density by counting the number of galaxies within concentric annuli of a 50 kpc radius around the QSO fixing the value. Subsequently, all the QSOs in the sample were stacked to obtain the average profile. Figure 2 shows the density profile of galaxies for five different values. The profile obtained for km s-1 is highlighted in the figure and it is also reproduced in the upper-right corner in rp bins of 25 kpc. The density profiles have, in general, the same behavior: the density decreases down to a critical radius of 350 kpc and then it is almost constant as expected for a homogeneous background. Comparable critical distances were also used in studying the effects of galaxy interactions on star formation in Nikolic, Cullen & Alexander (2004). Power-law fits of the density profiles were obtained for each value. A lower slope is an indication of contamination and/or projection effects. We found that the steepest profiles are obtained for in the range 4000 to 6000 km s-1.

Therefore, we counted galaxies (Ngal) within rp = 350 kpc to estimate galaxy overdensities centered in a given QSO and normalized it to the expected number () from the mean background density, . This mean background density was calculated taking into account the densities obtained from random centers at the QSO redshifts with rp up to 650 kpc. The overdensities were then calculated by counting the number of galaxies within the fixed rp for different values and the final overdensity profile was averaged for all QSOs in the sample. The errors are the standard deviation in each bin. The average overdensity within 350 kpc as a function of is shown in Fig. 3. This overdensity reaches a maximum value of = 0.356 0.037 at = 5000 km s-1 , in agreement with the value providing the steepest density profile. We notice that in spite of the individual error bars in the photometric redshifts ( 7000 km/s), the average overdensity across the QSO sample for each bin substantially reduces the uncertainties.

Serber et al. (2006) studied the small-scale environment of QSOs using only projected separations. They showed that the enhanced mean overdensity around the QSOs affects the 100 kpc closest region. The local density excess of neighboring galaxies within 100 to 500 kpc may contribute to trigger the QSO activity through mergers and interactions. According to our analysis, rp of 350 kpc and of 5000 km s-1 can be considered as reliable upper limits to define the QSO sub-samples. To better establish the QSO interaction with neighbor galaxies, we defined rp = 140 kpc and 5000 km s-1 as a good compromise to be used in the definition of the QSO environment.
2.3 The QSO sub-samples
Taking into account the sample of QSOs and their surrounding galaxies, we defined three QSO sub-samples. The extreme case was defined as the strong QSO–galaxy interaction, the Sint sub-sample with at least one galaxy with projected separation kpc and relative radial velocity 5000 km s-1. A moderate case representing the weak QSO–galaxy interaction, the Wint sub-sample corresponds to QSOs with a companion galaxy with between 70 and 140 kpc and 5000 km s-1. Finally, for isolated QSOs, the Iso sub-sample corresponds to objects without companion galaxies with projected separations between 140 and 500 kpc and 5000 12000 km s-1.
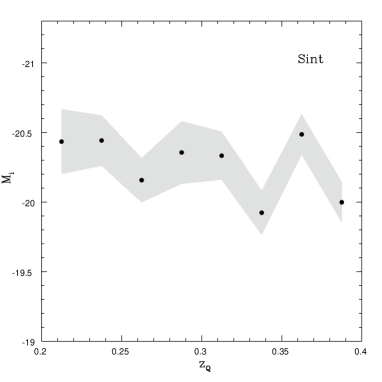
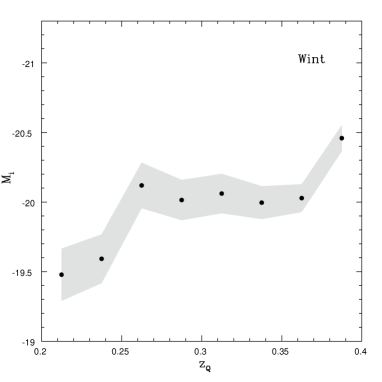
Table 1 shows a summary of the three defined QSO sub-samples with the adopted criteria and the number of objects. According to our criteria, 75% of the QSOs are isolated objects. The Sint sub-sample includes the brightest QSOs with mean absolute magnitude differences of 0.1 and 0.6 mag with respect to the Wint and Iso sub-samples. The QSO redshift distributions are similar for the three sub-samples. Figure 4 shows median absolute magnitudes of neighbor galaxies in redshift bins of 0.025 for Sint (left) and Wint (right panel) sub-samples. It can be seen that the neighbor galaxies of the Sint sub-sample are generally brighter than those of the Wint sub-sample. The limiting magnitude given by O’ Mill et al. (2011) is fainter than the absolute magnitudes of the galaxies in both sub-samples, except at z 0.35, when they become comparable.
| Sub-Sample | rp | Number of QSOs | |
|---|---|---|---|
| Sint | r 70 kpc | 5000 km s-1 | 389 |
| Wint | 70 kpc 140 kpc | 5000 km s-1 | 751 |
| Iso | r 140 kpc | 5000 km s-1 | 3523 |
3 Spectral analysis
3.1 Statistical analysis
From the SpecLineAll table of the CasJobs database, we extracted the EWs of the relevant spectral lines and their associated errors for the studied QSOs. We performed a visual inspection of the spectra to check their quality. We found some lines: Hϵ; [SII]; G band ; [OI] and [SII] showing in general low signal to noise ratios (S/Ns) and they were confused with the continuum. The lines [NeV], Hη, HeI and [OI], were only observed in certain QSO spectra (less than 20%), implying few measurements with high uncertainties. The line MgII has, in general, a good S/N, but it was observed only for QSOs with z 0.35. None of these lines were included in the following analysis. For our study, the most important emission lines showing a better S/N were: [NeV]; [OII]; Hδ; Hγ; [OIII]; Hβ; [OIII]; MgI; NaI; [NII]; Hα and [NII].
Figure 5 shows the normalized EW distribution for the Hα emission lines for the Sint, Wint and Iso sub-samples, where it can be observed that the distribution for the strong QSO-galaxy interaction sub-sample is almost constant for EW values from 50 to 350 Å. The distribution for the Wint sub-sample has a peak for EWs ranging from 50 to 150 Å. The same behavior is observed for the isolated QSOs between 50 and 100 Å. To avoid large outliers, which roughly represents 4 of the EW distribution, we only used spectral lines in our analysis when the ratio between the EW and the associated error was less than 0.3.

To investigate how the interaction with neighbor galaxies affects the QSOs, for each sub-sample we obtained median EWs and uncertainties using bootstrapping of the most important spectral lines listed above. Table 2 shows the median EW values and errors for the 14 studied spectral lines together with the number of EW measurements for the three different sub-samples. Figure 6 displays the differences in percentage between the EW median values obtained for the strong and weak QSO-galaxy interactions with those for isolated QSOs. Five lines, , [OII], [OIII] and Hα of the QSOs in the Sint sub-sample, show larger median EW values when compared with isolated QSOs. As shown in the table, the number of measurements for and [OII] are about half the number of measurements of the other three lines. Also, in the case of the [OII] lines, it is difficult to separate the two lines with the available spectra. They are not considered in the further analysis of the lines. For Hα, the difference is around 7% and for the [OIII] lines this difference is more than 20%. The EW values for the QSOs in the Wint sub-sample are smaller than 5% with the exception of [OII]. We argue that the observed difference in the three most important lines is related to the QSO interaction with neighboring galaxies.
| Spectral line | Sint | Wint | Iso | |||
|---|---|---|---|---|---|---|
| 3.67 0.23 | 173 | 3.47 0.17 | 309 | 3.42 0.19 | 1450 | |
| 4.09 0.34 | 96 | 4.05 0.35 | 162 | 4.00 0.31 | 663 | |
| 4.93 0.38 | 171 | 4.35 0.30 | 284 | 4.11 0.34 | 1353 | |
| Hδ | 8.55 0.82 | 201 | 8.94 0.80 | 349 | 8.55 0.62 | 1612 |
| Hγ | 14.58 1.06 | 312 | 14.93 1.22 | 572 | 14.89 1.09 | 2699 |
| 4.45 0.29 | 276 | 4.30 0.27 | 513 | 4.42 0.30 | 2436 | |
| Hβ | 37.88 2.75 | 381 | 37.21 2.31 | 732 | 37.66 2.72 | 3399 |
| 8.63 1.02 | 337 | 7.39 0.74 | 604 | 7.18 0.74 | 2856 | |
| 19.92 2.23 | 386 | 15.77 1.44 | 738 | 16.32 1.57 | 3477 | |
| 9.44 0.52 | 163 | 9.29 0.80 | 314 | 9.99 0.62 | 1429 | |
| 4.34 0.23 | 127 | 4.56 0.24 | 226 | 4.65 0.20 | 1074 | |
| 29.48 3.63 | 376 | 28.04 3.78 | 727 | 28.93 3.61 | 3391 | |
| Hα | 248.56 24.33 | 386 | 235.73 24.42 | 745 | 231.57 26.35 | 3494 |
| 26.85 2.82 | 380 | 25.27 2.31 | 716 | 26.49 2.75 | 3363 |

To add further statistical significance to the results, we applied the Kolmogorov-Smirnov (KS) test to the distributions of these three spectral lines. We compared the EW distributions of the Sint relative to the Iso sub-sample, finding that for the [OIII] lines they are different distributions. For the Wint relative to Iso sub-sample, the results show that the distributions are drawn from the same parent population. With the Hα line, the results show the same parent population in both sub-samples relative to the isolated QSOs.
We also used bootstrap in the EW distribution for these three lines to provide robust uncertainty bounds for our median estimates. We computed the bootstrapped 95% confidence intervals (CIs) around the median EW values. Table 3 shows the CIs for the three studied spectral lines for the different QSO sub-samples. The results show higher median EWs within wider CIs for the Sint sub-sample in comparison with the other two sub-samples. The most evident difference is related to the Hα line.
| Spectral line | Sint | Wint | Iso |
|---|---|---|---|
| Hα |
We also restricted the definition of the strong QSO-galaxy interaction by using a smaller of 3000 km s-1, implying 235, 486 and 3942 QSOs in the new Sint, Wint, and Iso sub-samples, respectively. We obtained median EW values for the [OIII] and Hα lines that showed similar results to previous percentage differences. The observed increments in the [OIII] EW could be related to strong AGN activity (Kauffmann et al. 2003) induced by galaxy interactions.
The results obtained for the Hα line for QSOs with strong galaxy interactions is consistent with some studies of normal galaxy pairs. Bushouse, Werner & Lamb (1988) and Donzelli & Pastoriza (1997) have shown that the nuclear star formation increases in galaxy interactions and mergers. In these sub-samples, less than 10% of the pairs are low-luminosity AGNs (LINER and Seyfert II galaxies). Barton Gillespie, Geller & Kenyon (2003) studied recent star formation in galaxy pairs, and demonstrated that the Hα EWs were strongly correlated with the inverse of the pair spatial separation or velocity difference. Using stellar population synthesis models, they obtained a merger scenario in which close interaction triggers starburst and increases the EWs.
3.2 Spectral decomposition
In this subsection, we explore the importance of the host galaxy and the role of the environment on the QSO activity. We analyzed the SDSS spectra of the QSOs with z 0.31 with a well defined Hα emission line. In this redshift range, we obtained a sub-sample of 100 QSOs in the restricted Sint sub-sample and also 100 randomly selected QSOs in the Iso sub-sample, which represents about 10% of the total.
First, we estimated the contribution of the host galaxy to the total emission. We applied the STARLIGHT code (Cid Fernandes et al. 2005, Mateus et al. 2006) that combines empirical population synthesis with evolutionary synthesis models. We used a base consisting of 80 single stellar population templates with different ages and metallicities (Bruzual & Charlot 2003) and six power-law components (e.g., Cardoso et al. 2017). Considering these two QSO sub-samples, we found that the contribution of the host galaxy to the total emission is 11% in median for the restrictive Sint sub-sample and 8% for the isolated QSOs. This contribution is in agreement with previous works, for example, at lower redshifts; Younes et al. (2010) studying the galaxy NGC 4278 at z = 0.002. At higher redshifts, the stellar contribution was estimated to be around 5 to 25% (Dey et al. 2008 and Donley et al. 2010) for a sample of galaxies at z = 2. The left panel of Fig. 7 shows the normalized distribution of the host contribution to the total emission for the restricted Sint (solid line) and Iso (dot line) sub-samples. We estimated that 80% of the QSOs have host contributions smaller than 30% and the lowest contributions are found for the brightest QSOs in the sample (Fig. 1). The right panel of the figure shows as an example, the STARLIGHT results of a QSO spectrum with 9% of the host contribution to the total emission. In the upper panel, we show the observed spectrum (solid line); the synthetic spectrum (dot - short dash line) obtained from the AGN contribution in a power-law form (short dash line); and the host contribution (dotted line). The bottom panel shows the residuals between the observed and synthethic spectra, which correspond to the emission spectrum of the ionized gas.


The Hα emission line can be decomposed into narrow and broad components, and these might be affected by different physical processes (Antonucci 1993) originated in different regions (the NLR and BLR). An increase in the narrow emission component may indicate an important contribution from enhanced star formation, while an increment in the broad component would be related to the AGN itself. However, from the analysis of median EW values alone, it is not possible to disentangle the different component contributions. Therefore, in the present study, we assumed two components for the Hα emission line profiles by adopting a combination of Gaussian profiles. The LINER routine (Pogge & Owen 1993) based on a minimization algorithm was used to fit the narrow and broad components for the Hα profile with some assumptions (e.g., Schmidt et al. 2016). One of these is that [NII] and [NII] are considered to be of equal FWHM, because both lines are emitted in the same region. The second one is that the flux ratio of the two [NII] components is equal to their theoretical value of 1:3. For some objects, it was also necessary to impose a third constraint for these lines: that their wavelength separation is equal to their theoretical value (36 Å). In most of the cases, we obtained FWHM values of approximately 400 km s-1 and 3000 km s-1 for the narrow and broad components of the Hα line, respectively, in agreement with previous results (e.g., Marziani et al. 2010, Coatman et al. 2017).
Figure 8 shows a typical fit of the Hα emission line together with the [NII] lines, and also the corresponding residuals. The observed emission spectrum is represented by a thick black line, with the different Gaussian components, including the Hα broad and narrow lines and the [NII], represented by dotted lines.


Figure 9 shows the results of the decomposition in broad (left panel) and narrow (right panel) Hα components of the two QSO sub-samples. The solid (dot) lines represent the EW distributions for the QSOs from the restricted Sint (Iso) sub-samples. For the analyzed QSOs that had a strong interaction with neighboring galaxies, the median values were 22.60 4.59 Å for the narrow component and 161.40 12.92 Å for the broad one. For the isolated QSOs, we obtained a median value of 18.71 3.87 Å for the narrow component, and 135.52 10.42 Å for the broad one. Within the uncertainties, the distribution of the narrow component was similar for QSOs with strong interaction and in isolation. However, the broad components of interacting QSOs were 20% wider than in isolated QSOs. This result might show that the connection between the galaxy interactions and QSO activity was via the central regions. Considering that the broad component of Hα is originated at the BLR, the emission lines which could be contaminated are the narrow lines. According to the synthesis results, this contamination is around 10% in median.
Finally, we applied the KS test to the EW measurements of the narrow and broad components obtained from the decomposition of the Hα emission line to the Sint and Iso sub-samples. The results show that the broad component distributions are two different populations while the narrow components are similar distributions.
4 Summary
We defined a QSO sample using the SDSS Quasar catalog derived from the SDSS-DR7 (Schneider et al. 2010), which was comprised of 4663 QSOs in the redshift range of 0.20 0.40. In order to study the effects in the QSO spectra produced by the environment, we defined three different QSO sub-samples. We selected neighboring galaxies relative to the QSOs using the projected separations and radial velocity differences. Using a projected separation of 140 kpc and = 5000 km s-1, three QSO sub-samples were defined representing the strong and weak interactions with galaxies, and isolated QSOs. These QSO sub-samples were also restricted using a smaller value of 3000 km s-1 to perform statistical and spectral analyses.
From the study of the EW medians of the most relevant spectral lines, we found that the [OIII] lines show values larger than 20% for QSOs in the Sint sub-sample when compared with isolated QSOs, and about 7% for the Hα line. The changes in EWs were, in general, comparable between the weak QSO-galaxy interactions and isolated QSOs. For these three lines, we also performed the KS test and obtained confidence intervals for the EW medians. For the [OIII] lines, the EW distributions of the Sint are different from those of the Iso sub-sample. For the Wint relative to Iso sub-sample, the results show that the distributions are drawn from the same parent population. For the Hα line, the CIs have higher median EWs within wider intervals for the Sint sub-sample in comparison with the other two sub-samples. These results show that only some line EWs of QSOs are marginally influenced by environment. Similar results were obtained when restricting the sub-samples with 3000 km s-1. None of these results are affected by the emission of the host galaxy, which contributes about 10% in median to the total emission.
To gain a better understanding of the connection between the increment of the Hα emission line and the effect produced by the QSO-galaxy interactions, we performed broad and narrow line decomposition. Throughout this decomposition, for the restricted sub-samples, the narrow component remained constant for QSOs with strong galaxy interactions and isolated QSOs. In contrast, the broad component revealed an increase for the QSOs with strong galaxy interactions. Our results suggest that the QSO central regions (BLR and inner NLR) could be mostly affected by the galaxy interaction. This conclusion is derived from the increase of the broad component of Hα for the Sint sub-sample and the lack of variation in the narrow component of Hα and the lines, both originated in the NLR. This is also reinforced by the changes in the [OIII] lines, which are originated mainly in the inner parts of the NLR due to their higher degree of ionization.
Our findings suggest that QSO interactions with neighboring galaxies may affect AGN activity as evidenced by the EW values of some emission lines. A scenario where the accretion rate of massive black holes is triggered by galaxy interactions as suggested by Di Matteo, Springel & Hernquist (2005) simulations could provide important clues about the joint evolution of QSOs and galaxies.
Acknowledgements.
We would like to thank the anonymous referee for the suggestions to improve the manuscript. This work was partially supported by Consejo de Investigaciones Científicas y Técnicas (CONICET) and Secretaría de Ciencia y Técnica de la Universidad Nacional de Córdoba (SecyT). SDSS-III is managed by the Astrophysical Research Consortium of the Participating Institutions of the SDSS-III Collaboration including the University of Arizona, the Brazilian Participation Group, Brookhaven National Laboratory, University of Cambridge, University of Florida, the French Participation Group, the German Participation Group, the Instituto de Astrofísica de Canarias, the Michigan State/Notre Dame/JINA Participation Group, Johns Hopkins University, Lawrence Berkeley National Laboratory, Max Planck Institute for Astrophysics, New Mexico State University, New York University, Ohio State University, Pennsylvania State University, University of Portsmouth, Princeton University, the Spanish Participation Group, University of Tokyo, University of Utah, Vanderbilt University, University of Virginia, University of Washington, and Yale University.References
- Abazajian et al. (2004) Abazajian, K., Adelman-McCarthy, J. K., Agüeros, M. A., et al. 2004, AJ, 128, 502
- Abazajian et al. (2009) Abazajian, K. N., Adelman-McCarthy, J. K., Agüeros, M. A., et al. 2009, ApJS, 182, 543
- Antonucci (1993) Antonucci, R. 1993, ARA&A, 31, 473
- Bahcall et al. (1997) Bahcall, J. N., Kirhakos, S., & Schneider, D. P. 1997, Quasar Hosts, 37
- Barton Gillespie et al. (2003) Barton Gillespie, E., Geller, M. J., & Kenyon, S. J. 2003, ApJ, 582, 668
- Bruzual & Charlot (2003) Bruzual, G., & Charlot, S. 2003, MNRAS, 344, 1000
- Bushouse et al. (1988) Bushouse, H. A., Werner, M. W., & Lamb, S. A. 1988, ApJ, 335, 74
- Cardoso et al. (2017) Cardoso, L. S. M., Gomes, J. M., & Papaderos, P. 2017, A&A, 604, A99
- Carswell et al. (1976) Carswell, R. F., Coleman, G., Williams, R. E., & Strittmatter, P. A. 1976, A&A, 53, 275
- Cid Fernandes et al. (2005) Cid Fernandes, R., Mateus, A., Sodré, L., Stasińska, G., & Gomes, J. M. 2005, MNRAS, 358, 363
- Coatman et al. (2017) Coatman, L., Hewett, P. C., Banerji, M., et al. 2017, American Astronomical Society Meeting Abstracts #229, 229, 302.03
- Collister & Lahav (2004) Collister, A. A., & Lahav, O. 2004, PASP, 116, 345
- Connolly et al. (1995) Connolly, A. J., Csabai, I., Szalay, A. S., et al. 1995, AJ, 110, 2655
- Dey et al. (2008) Dey, A., Soifer, B. T., Desai, V., et al. 2008, ApJ, 677, 943-956
- Di Matteo et al. (2005) Di Matteo, T., Springel, V., & Hernquist, L. 2005, Growing Black Holes: Accretion in a Cosmological Context, 340
- Donley et al. (2010) Donley, J. L., Rieke, G. H., Alexander, D. M., Egami, E., & Pérez-González, P. G. 2010, ApJ, 719, 1393
- Donzelli & Pastoriza (1997) Donzelli, C. J., & Pastoriza, M. G. 1997, ApJS, 111, 181
- Dunlop et al. (2003) Dunlop, J. S., McLure, R. J., Kukula, M. J., et al. 2003, MNRAS, 340, 1095
- Falomo et al. (2014) Falomo, R., Bettoni, D., Karhunen, K., Kotilainen, J. K., & Uslenghi, M. 2014, MNRAS, 440, 476
- Floyd et al. (2004) Floyd, D. J. E., Kukula, M. J., Dunlop, J. S., et al. 2004, MNRAS, 355, 196
- Heckman et al. (2004) Heckman, T. M., Kauffmann, G., Brinchmann, J., et al. 2004, ApJ, 613, 109
- Jahnke et al. (2004) Jahnke, K., Kuhlbrodt, B., & Wisotzki, L. 2004, MNRAS, 352, 399
- Jogee (2006) Jogee, S. 2006, Physics of Active Galactic Nuclei at all Scales, 693, 143
- Kauffmann et al. (2003) Kauffmann, G., Heckman, T. M., Tremonti, C., et al. 2003, MNRAS, 346, 1055
- Lambas et al. (2003) Lambas, D. G., Tissera, P. B., Alonso, M. S., & Coldwell, G. 2003, MNRAS, 346, 1189
- Lynden-Bell (1969) Lynden-Bell, D. 1969, Nature, 223, 690
- Mateus et al. (2006) Mateus, A., Sodré, L., Cid Fernandes, R., et al. 2006, MNRAS, 370, 721
- Marziani et al. (2010) Marziani, P., Sulentic, J. W., Negrete, C. A., et al. 2010, MNRAS, 409, 1033
- O’ Mill et al. (2011) O’ Mill, A. L., Duplancic, F., García Lambas, D., & Sodré, L., Jr. 2011, MNRAS, 413, 1395
- Nikolic et al. (2004) Nikolic, B., Cullen, H., & Alexander, P. 2004, MNRAS, 355, 874
- Osterbrock (1989) Osterbrock, D. E. 1989, Annals of the New York Academy of Sciences, 571, 99
- Pâris et al. (2014) Pâris, I., Petitjean, P., Aubourg, É., et al. 2014, A&A, 563, A54
- Pâris et al. (2017) Pâris, I., Petitjean, P., Ross, N. P., et al. 2017, A&A, 597, A79
- Petrosian (1976) Petrosian, V. 1976, ApJ, 209, L1
- Pogge & Owen (1993) Pogge, R. W. and Owen, J. M. 1993, OSU Internal Report 93-01
- Scranton et al. (2002) Scranton, R., Johnston, D., Dodelson, S., et al. 2002, ApJ, 579, 48
- Schmidt (1969) Schmidt, M. 1969, ARA&A, 7, 527
- Schmidt et al. (2016) Schmidt, E. O., Ferreiro, D., Vega Neme, L., & Oio, G. A. 2016, A&A, 596, A95
- Schneider et al. (2010) Schneider, D. P., Richards, G. T., Hall, P. B., et al. 2010, AJ, 139, 2360
- Serber et al. (2006) Serber, W., Bahcall, N., Ménard, B., & Richards, G. 2006, ApJ, 643, 68
- Strauss et al. (2002) Strauss, M. A., Weinberg, D. H., Lupton, R. H., et al. 2002, AJ, 124, 1810
- Strittmatter & Williams (1976) Strittmatter, P. A., & Williams, R. E. 1976, ARA&A, 14, 307
- Stoughton et al. (2002) Stoughton, C., Lin, H., Yanny, B., et al. 2002, Bulletin of the American Astronomical Society, 34, #114.12
- Urry & Padovani (1995) Urry, C. M., & Padovani, P. 1995, PASP, 107, 803
- York et al. (2000) York, D. G., Adelman, J., Anderson, J. E., Jr., et al. 2000, AJ, 120, 1579
- Younes et al. (2010) Younes, G., Porquet, D., Sabra, B., et al. 2010, A&A, 517, A33
- Zel’dovich & Novikov (1965) Zel’dovich, Y. B., & Novikov, I. D. 1965, Soviet Physics Doklady, 9, 834