Classification of Phase Transitions by Microcanonical Inflection-Point Analysis
Abstract
By means of the principle of minimal sensitivity we generalize the microcanonical inflection-point analysis method by probing derivatives of the microcanonical entropy for signals of transitions in complex systems. A strategy of systematically identifying and locating independent and dependent phase transitions of any order is proposed. The power of the generalized method is demonstrated in applications to the ferromagnetic Ising model and a coarse-grained model for polymer adsorption onto a substrate. The results shed new light on the intrinsic phase structure of systems with cooperative behavior.
Conventionally, the identification of phase transitions is based on locating non-analyticities, discontinuities, or divergences in thermodynamic variables (e.g., entropy, pressure, magnetization) and response functions (specific heat, compressibility, susceptibility, etc.), respectively. These quantities can be represented by distinct derivatives of appropriate thermodynamic potentials. According to Ehrenfest’s classification scheme ehrenfest1 , the order of the transition is determined by the lowest derivative which exhibits catastrophic behavior at the transition temperature. However, this can only occur in the thermodynamic limit. Thermodynamic quantities describing the macrostate of finite systems do not show any such obvious transition behavior. Therefore, the rapidly growing interest in understanding thermodynamic activity in finite systems, such as nanoscale systems relevant for biology and modern nanotechnology, necessitate a generalized identification and classification scheme for phase transitions. Microcanonical statistical analysis Thirring1970 ; Janke1998 ; Kastner2000 ; Gross2001 ; dunkel1 ; Junghans2006 has turned out to be a useful basis for first systematic schemes Schnabel2011 ; BachmannBook2014 .
In this context, it has been common to analyze first-order-like transitions in finite systems by means of Maxwell’s construction, where the backbending region in the transition regime of the energetic temperature curve is replaced by a flat segment. However, Maxwell construction only applies to single transitions of first order and can neither be used if the transition is composed or accompanied by subphase transitions kb1 , nor if it is of higher order. However, by replacing the “flatness” idea of Maxwell’s construction by the more general principle of minimal sensitivity Stevenson1981 , these issues can be resolved as will be discussed in the following.
The principle of minimal sensitivity (PMS) was proposed to solve the ambiguity of results obtained by applying different renormalization schemes (RS) in conventional perturbation theory Stevenson1981 ; Stevenson1981-2 . It asserts that if a truncated perturbation expansion in some RS depends on unphysical parameters, of which the exact result must be independent, the parameter values should be chosen so as to minimize the sensitivity of the approximant to small variations in those parameters. The PMS has found numerous applications Kleinert2009 ; Kauffmann1984 ; Duke1982 ; Akeyo1993 ; Canet2005 ; Wrigley1983 ; Stevenson1983 ; Inui2006 ; Buckley1993 ; Lu2007 ; Canet2003 .
In this Letter, we show that the combination of microcanonical inflection-point analysis Schnabel2011 and the PMS enable the systematic identification, characterization, and classification of first- and higher-order transitions in complex systems of any size. The analysis reveals surprising transition features, suggesting the discrimination of regular (independent) transitions from dependent transitions, which only exist in combination with a regular transition. Unexpectedly, even the two-dimensional ferromagnetic Ising model exhibits signals of transitions other than the established single second-order phase transition. Furthermore, the difficulty in uniquely identifying the compact phases in the long-standing problem of polymer adsorption can be traced back to a complex structure of subphases separated by higher-order transitions. By employing the generalized analysis method proposed here, we obtain novel results for these systems.
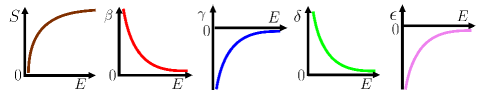
The microcanonical entropy, defined by , where is the density of states with system energy , contains the complete information about the phase behavior of a system. In the thermodynamically relevant energetic region, it is a monotonically increasing concave function [Fig. 1]. Changes of the phase behavior are signaled by alterations of the curvature of leading to characteristic monotonic features of the inverse microcanonical temperature, which is given by
| (1) |
In energetic regions without transition signals, is a strictly monotonically decreasing convex function [Fig. 1].
Canonically, large fluctuations at the transition temperature lead to a dramatically increased expectation value of the system energy , signaling a phase or pseudophase transition. In consequence, in microcanonical analysis, it is expected to occur in the energetic region, where the inverse temperature responds least sensitively to energy changes. However, in situations where transitions are not identified in , higher-order derivatives of the entropy might still reveal signals of cooperative behavior. Generally, if no transition occurs, the derivatives of are either monotonically increasing concave or monotonically decreasing convex functions [Fig. 1] in the energetic regime where thermodynamic phase transitions can occur. A change in monotonicity causes an inflection point which we call inflection point of least sensitivity if the derivative changes least upon variation in energy and provides a transition signal at this energy.
The typical first-order transition scenario is sketched in Fig. 2(a). For finite systems, the entropy possesses a convex region caused by surface effects Gross2001 ; BachmannBook2014 . The slope of the unique double-tangent across the convex regime is the Gibbs-Maxwell hull and the energy difference between the touching points of double-tangent and defines the latent heat. In the thermodynamic limit, the convex “intruder” disappears as surface effects become irrelevant and the slope of the Gibbs-Maxwell line corresponds to the inverse transition temperature. The convex region in causes a “backbending” of the curve. If we define the transition energy associated with the least sensitive inflection point in , has a positive-valued minimum at ,
| (2) |
and is the inverse transition temperature. Since the backbending region is formed directly in the otherwise monotonically decreasing convex curve, the occurrence of the first-order transition is independent of the possible existence of other transition signals.
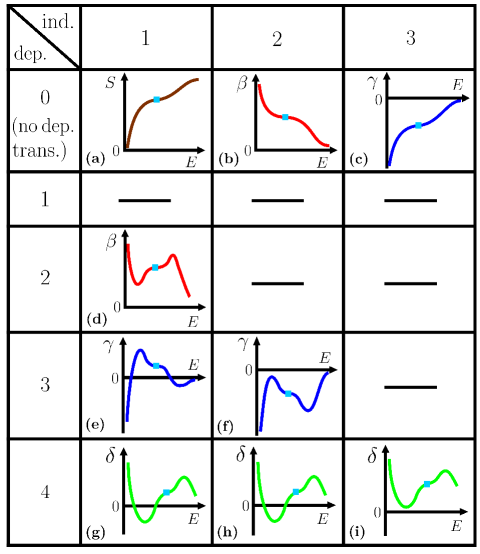
Consequently, we identify an independent second-order phase transition by an inflection point, where is least sensitive to changes in energy [see Fig. 2(b)]. The corresponding derivative exhibits a negative-valued peak at the transition energy, i.e.,
| (3) |
Note that only signatures of first- and second-order transitions are directly visible in . However, if such transition signals are not found, the PMS condition can be applied to higher derivatives of as well. For example, since is strictly concave if no transition occurs, an inflection point at which the curve behaves least sensitively signals an independent third-order phase transition [Fig. 2(c)]. The derivative of near forms a valley with a positive-valued minimum, i.e.,
| (4) |
To generalize, we define an independent transition of odd order (where is a positive integer), if there is a least-sensitive inflection point in the th derivative of and the corresponding minimum in the th derivative of is positive, i.e.,
| (5) |
Analogously, an independent transition of even order ( is a positive integer) is associated with a least-sensitive inflection point in the th derivative of and the corresponding negative-valued maximum in the th derivative of , i.e.,
| (6) |
It is noteworthy that generalized inflection-point analysis also reveals another type of transitions. These dependent transitions can only occur in coexistence with an independent transition of lower order (see Fig. 2).
According to our proposed classification scheme, a dependent transition of even order (where is a positive integer) exists, if there is a least-sensitive inflection point in the th derivative of which can be identified by a positive-valued minimum in the th derivative in the transition region of the corresponding independent transition,
| (7) |
Consequently, a dependent transition of odd order () (with being positive integer) is indicated by a least-sensitive inflection point in the th derivative of and is characterized by a negative-valued maximum in the th derivative:
| (8) |
It is important to note that the occurrence of an independent transition does not necessarily imply the existence of dependent transitions, whereas the opposite is true. Least-sensitive inflection points indicating dependent transitions are not simply a consequence of the monotonic shape associated with the curve of a derivative of that features an independent transition. As Fig. 2 shows, for example, a first-order independent transition can be (but does not necessarily have to be) accompanied by a dependent transition of any order higher than 1.
We leave it to future work to determine the circumstances for dependent transitions to exist and their scaling properties in the thermodynamic limit. Since dependent transitions always occur at a higher energy than the corresponding independent transition, the former can be interpreted as a precursor of the latter in the less ordered phase. This might be of interest in applications in materials science as the dependent transitions indicate instabilities in an otherwise stable phase. This relationship sheds new light on our general understanding of ordering principles leading to phase transitions.
We now demonstrate the power of this novel method. In the first example, we re-analyze the ferromagnetic-paramagnetic phase transition of the two-dimensional Ising model on a square lattice. The energy of a spin configuration is given by , where represents the possible spin orientations. Only nearest-neighbor spin pairs contribute. The energy scale, given by the coupling constant , is set to unity. The extraordinary advantage of this model is that it has been solved rigorously Onsager1944 ; Kaufman1949 . The microcanonical entropy can be obtained exactly for any system size Beale1996 and allows for a direct application and test of our method.
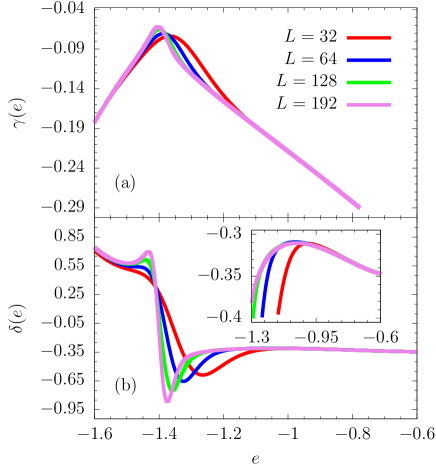
To compare the results for different system sizes , we introduce energies and entropies per spin and , respectively. Figure 3 shows the and derivatives of and, as expected, strong second-order transition signals are indicated by the negative-valued maxima in for all system sizes studied. The transition signal becomes more pronounced with increasing system size. Remarkably, the value of is independent of system size and one is reminded of the Binder cumulant crossings binder1 . It is obvious that a microcanonical scaling analysis is worth being tested (note that the peak value of must converge to zero in the thermodynamic limit), but this is left to future work.
More interesting in the given context is the revelation of additional transition signals shadowing the well-known independent second-order phase transition at (). At the lower energy (), exhibits a positive-valued minimum for and , which corresponds to an independent transition of third order (for the smaller systems and , it is of fourth order). Furthermore, the inset in Fig. 3(b) reveals a negative peak at higher energies () for all systems studied. It features an additional dependent third-order transition in the paramagnetic phase.
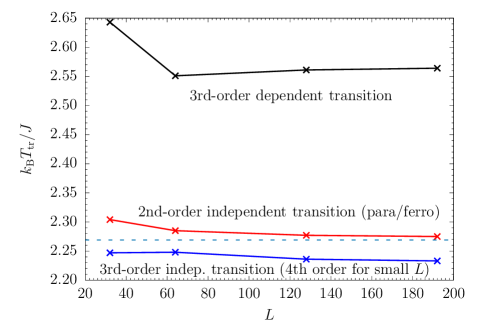
It is worth noting that all transition signals become more significant with increasing system size, implying that the two higher-order transitions may also exist in the thermodynamic limit. As Fig. 4 shows, the transition temperatures remain well separated for larger systems. A thorough scaling analysis is needed and more detailed studies are necessary to characterize their nature, though. Due to their lower significance compared to the critical transition, it is likely that in all previous studies their effects have been absorbed in corrections-to-scaling of the power laws of the critical transition and, hence, remained undetected.
As a second example, we study a coarse-grained model of a grafted lattice polymer interacting with an adhesive surface. The energy of the system can be written as , where and denote the numbers of nearest-neighbor monomer-substrate contacts and nearest-neighbor non-bonded monomer-monomer contacts, respectively Bachmann2006 . The dimensionless reciprocal solubility effectively controls the quality of the implicit solvent. Simulations were performed using the contact-density chain-growth algorithm, which yields the number of states for given pairs BachmannBook2014 . This so-called contact density can be transformed into the density of states for any given value of without additional simulations. By means of generalized inflection-point analysis, transition signals are located and classified, and the microcanonical transition temperatures identified. Accumulating this information, we can construct the - hyperphase diagram. For a polymer with 503 monomers, it is shown in Fig. 5. At high temperatures, the polymer is desorbed and expanded (DE) in the free space. Below the second-order adsorption transition, larger sections of the polymer get adsorbed onto the substrate (AE2).
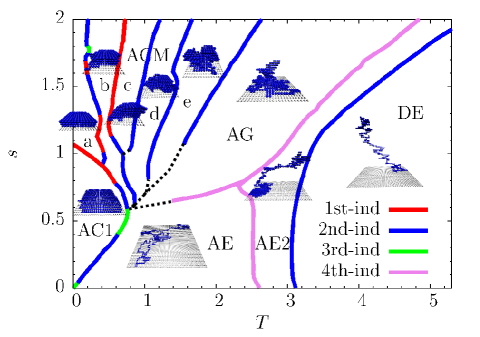
Under sufficiently good solvent conditions, the polymer forms fully adsorbed and expanded conformations (AE), whereas adsorbed globular (AG) or crystalline and multi-layered (ACM) structures dominate otherwise. In the ACM subphases, the compactness of the polymer is divided into different levels. The ACMa subphase contains the most compact conformations, whereas the compactness of the structures is the least in the ACMe subphase. In the conformational phase AC1, the polymer forms a compact, filmlike single layer on the substrate. The identification of the compact phases has been a long-standing problem, but our novel analysis method provides a unique approach with no room for ambiguities. It should be noted that the simulation of larger systems in the compact phases is extremely difficult, but conventional scaling analyses of the adsorption-desorption transition yield promising results pmb1 .
In the novel statistical analysis method introduced in this Letter, least sensitive inflection points in the microcanonical entropy and its derivatives are used as indicators of phase and pseudophase transitions. The hierarchical classification scheme applies to two different classes of transitions, which we call independent and dependent. Dependent transitions can only exist in combination with a lower-order independent transition and may be interpreted as precursors of the latter. As a proof of concept for the power of the method we studied the two-dimensional Ising model, which revealed additional higher-order transitions in the vicinity of the critical transition, and polymer adsorption. In the latter example, the complete hyperphase diagram in solubility-temperature space could be constructed, which helps understand better the structure of the compact phases. An in-depth discussion of the intriguing details is future work.
The methodology presented here is versatile and promising as it can be universally applied to complex physical systems of any size. The consequently hierarchical scheme significantly advances previous methods in identifying and classifying phase and pseudophase transitions and is particularly useful for applications in the emerging field of complex systems on mesoscopic scales with high cooperativity, for which no thermodynamic limit exists.
This work has been supported by the NSF under Grant No. DMR-1463241.
References
- (1) P. Ehrenfest, Phasenumwandlungen im ueblichen und erweiterten Sinn, classifiziert nach den entsprechenden Singularitaeten des thermodynamischen Potentiales, in: Proc. Royal Acad. Amsterdam (Netherlands), Vol. 36 (1933), p. 153; Comm. Leiden Suppl. No. 75b.
- (2) W. Thirring, Z. Phys. 235, 339 (1970).
- (3) W. Janke, Nucl. Phys. B 63A-C, 631 (1998).
- (4) M. Kastner, M. Promberger, and A. Hüller, J. Stat. Phys. 99, 1251 (2000).
- (5) D. H. E. Gross, Microcanonical Thermodynamics (World Scientific, Singapore, 2001).
- (6) J. Dunkel and S. Hilbert, Physica A 370, 390 (2006).
- (7) C. Junghans, M. Bachmann, and W. Janke, Phys. Rev. Lett. 97, 218103 (2006).
- (8) S. Schnabel, D. T. Seaton, D. P. Landau, and M. Bachmann, Phys. Rev. E 84, 011127 (2011).
- (9) M. Bachmann, Thermodynamics and Statistical Mechanics of Macromolecular Systems (Cambridge University Press, Cambridge, 2014).
- (10) T. Koci and M. Bachmann, Phys. Rev. E 95, 032502 (2017).
- (11) P. M. Stevenson, Phys. Rev. D 23, 2916 (1981).
- (12) P. M. Stevenson, Phys. Lett. B 100, 61 (1981).
- (13) H. Kleinert, Path Integrals in Quantum Mechanics, Statistics, Polymer Physics, and Financial Markets, 5th ed. (World Scientific, Singapore, 2009).
- (14) S. K. Kauffmann and S. M. Perez, J. Phys. A: Math. Gen. 17, 2027 (1984).
- (15) D. W. Duke and J. D. Kimel, Phys. Rev. D 25, 2960 (1982).
- (16) J. O. Akeyo and H. F. Jones, Phys. Rev. D 47, 1668 (1993).
- (17) L. Canet, Phys. Rev. B 71, 012418 (2005).
- (18) J. C. Wrigley, Phys. Rev. D 27, 1965 (1983).
- (19) P. M. Stevenson, Phys. Rev. D 27, 1968 (1983).
- (20) M. Inui, A. Niégawa, and H. Ozaki, Prog. Theor. Phys. 115, 411 (2006).
- (21) I. R. C. Buckley, A. Duncan, and H. F. Jones, Phys. Rev. D 47, 2554 (1993).
- (22) W. F. Lu, C. K. Kim, and K. Nahm, J. Phys. A: Math. Theor. 40, 14457 (2007).
- (23) L. Canet, B. Delamotte, D. Mouhanna, and J. Vidal, Phys. Rev. D 67, 065004 (2003).
- (24) L. Onsager, Phys. Rev. 65, 117 (1944).
- (25) B. Kaufman, Phys. Rev. 76, 1232 (1949).
- (26) P. D. Beale, Phys. Rev. Lett. 76, 78 (1996).
- (27) K. Binder, Z. Phys. B 43, 119 (1981).
- (28) M. Bachmann and W. Janke, Phys. Rev. E 73, 041802 (2006).
- (29) J. A. Plascak, P. H. L. Martins, and M. Bachmann, Phys. Rev. E 95, 050501(R) (2017).