How does the stellar disk of the
Milky Way get its gas?
Abstract
In chemodynamical evolution models it is usually assumed that the Milky Way galaxy forms from the inside-out implying that gas inflows onto the disk decrease with galactocentric distance. Similarly, to reproduce differences between chemical abundances of the thick disk and bulge with respect to those of the thin disk, higher accretion fluxes at early times are postulated. By using a suite of Milky Way-like galaxies extracted from cosmological simulations, we investigate the accretion of gas on the simulated stellar disks during their whole evolution. In general, we find that the picture outlined above holds, although the detailed behavior depends on the assembly history of the Galaxy and the complexities inherent to the physics of galaxy formation.
keywords:
Galaxy: formation, Galaxy: evolution, Galaxy: disk, Galaxy: bulge, Galaxy: abundances, methods: numerical1 Introduction
A fundamental question in galaxy formation is how galaxies accrete their gas and its connection with star formation. Three main channels are believed to be responsible of bringing gas to the galaxies, namely: interactions with other systems, either by mergers or tidal effects; filamentary accretion from the intergalactic medium, and quasi-spherical accretion of shock-heated material in the galactic halo (e.g., [Putman et al. (2012), Putman et al. 2012]). Provided gas penetrates into the central regions of galactic halos and cools down, stellar disks can be feeded with material potentially available for star formation. Decades ago chemical evolution models (CEMs) have been proposed as a way to study the production of chemical elements by subsequent stellar generations which, in turn, can provide insights on the required gas accretion and star formation history of galaxies.
The Milky Way is a benchmark for our understanding of galaxy formation and evolution due to the wealth of data now available. In general, CEMs are quite successful in reproducing the mean chemical patterns of stars in the solar neighborhood ([Chiappini et al. (2001), e.g., Chiappini et al. 2001]) and the time evolution of the thin disk metallicity gradients ([Anders et al. (2017), Anders et al. 2017]). Several extensions to classical CEMs can be done, considering, for instance, inhomogeneous models designed to reproduce the spread in chemical abundances ([Cescutti (2008), Cescutti & Chiappini (2014), e.g., Cescutti 2008; Cescutti & Chiappini 2014]), and chemodynamical models to include stellar dynamics information ([Minchev et al. (2013), Minchev et al. (2013), Minchev et al. 2013, 2014]). These models, however, rely on a handful of key assumptions which are usually not very well constrained. One of such assumptions is the idea that spirals like our own Galaxy, and in particular their thin disk component, are assembled from the inside-out. Generally speaking, this means that gas inflows onto the galaxies are larger in the inner regions. Another key assumption is that the inflows have to be significantly stronger at early times, leading, afterwards, to a more gentle gas accretion history where stellar disks have enough time to grow as a result of the formation of younger stellar populations ([Chiappini et al. (1997), Chiappini et al. 1997]).
In this contributed paper, we discuss these ideas by analyzing a set of Milky Way-like galaxies extracted from cosmological simulations that we use as a proxy for the accretion of material in our own Galaxy. In particular, we quantify the inflow of gas onto the simulated stellar disks as a function of cosmic time and radius inspired in the framework adopted by CEMs.
2 The simulations
We use two simulated Milky Way-like systems performed within the CDM cosmology including star formation and supernova feedback: the one used in the chemodynamical models of [Minchev et al. (2013), Minchev et al. (2013), Minchev et al. (2013, 2014)], and the Milky Way candidate of [Nuza et al. (2014), Nuza et al. (2014)].
The former, labelled g106, is selected from the galaxy sample of [Martig et al. (2012), Martig et al. (2012)], generated adopting the technique introduced by [Martig et al. (2009), Martig et al. (2009)]. This technique allows to reduce computational costs at the expense of an approximate treatment of cosmological evolution, making possible to achieve higher resolutions. Particle masses in this simulation are set to M⊙ for gas, M⊙ for stars and M⊙ for dark matter. The target halo was chosen to inhabit a relatively isolated environment at with no halo more massive than half of its mass within a region of Mpc radius. Therefore, by construction, the resulting galaxy candidate displays a quiet merger history.
The other galaxy, dubbed MWc, is extracted from a fully-cosmological simulation of the Local Group (LG) carried out within the CLUES project (www.clues-project.org). As a result, MWc inhabits a more realistic environment, having today an approaching companion resembling Andromeda at a distance of about 700 kpc and farther aggregations such as Virgo and Coma, among other known large-scale structures in the local Universe. This simulation is done with the Smoothed Particle Hydrodynamics GADGET-3 code ([Springel08, Springel et al. 2008]) including additional modules for metal-dependent cooling, chemical enrichment, multiphase gas treatment and UV background field (see e.g., [Creasey et al. (2015), Scannapieco et al. (2015), Creasey et al. 2015; Scannapieco et al. 2015]). In this case, mass resolution is set to M⊙ for gas (with two stellar generations) and M⊙ for dark matter.
3 Computing gas fluxes onto the stellar disks
Following CEMs, we define, at any given time, a cylindrical coordinate system in the plane of the stellar disk. The orientation of the latter is obtained by computing the angular momentum vector of star particles in each galaxy. Gas particle trajectories are approximated computing the acceleration of matched particles between neighboring simulation snapshots. To accommodate the disk, and set the outer boundaries for the flux calculations, we use a cylinder of radius kpc and scale height kpc centered on the stellar disk midplane. Then, the cylinder is sliced in radial bins and gas fluxes accross surface boundaries are computed in the radial and vertical directions. Here, we only focus on the vertical infall flux onto the stellar disk leaving to a future study a more thorough analysis (Nuza et al., in preparation).
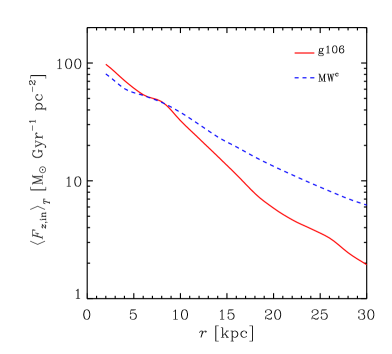
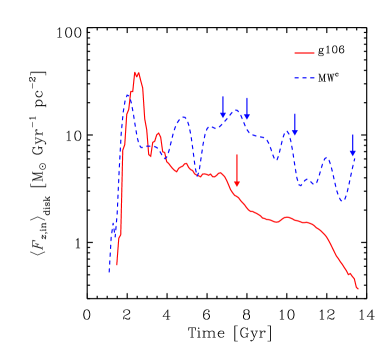
Figure 1 shows the mean vertical infall flux of gas onto the disk for the two simulated galaxies. The left-hand panel corresponds to the infall mass per unit area for different radii averaged over the entire evolution history, whereas the right-hand panel corresponds to the mass accretion rate as a function of time averaged over the whole disk area. Both simulated galaxies show a behavior consistent with the inside-out formation scenario, where the inner regions of the disk get more of the accreting material. The time-averaged infall versus radius displays an exponential downfall towards larger distances. The same behavior is still seen at radii well beyond typical stellar disk sizes, suggesting a continuous – albeit low – infall of material directly feeding the disks. The MWc galaxy shows a flatter decline with radius than g106 due to the more active merger history taking place in the LG simulation. Depending on their strength and/or orbital parameters, mergers can significantly affect the growth of stellar disks either by completely/partially destroying them, or by bringing additional gas leading to star formation.
The radially-integrated infall versus cosmic time shows a downturn towards the present epoch for both galaxies. However, g106 displays a much more pronounced decline than MWc. As mentioned before, this is a direct consequence of the dynamically significant mergers present at later times for MWc (see small arrows in Figure 1), which are revealed by the relative height of the infall peaks seen at different times. Most of these peaks are related to accretion flows induced by interactions/mergers with satellite galaxies.
Besides the particular assembly history of each model galaxy, we find that, in general, the infall flux of gas onto the disk is higher at early times; followed by a more gentle accretion period after the first few Gyr of evolution. This scenario is in broad agreement with conclusions of CEMs for the Milky Way which seem to indicate that gas infall was more violent in the past than what it is today (e.g., [Chiappini et al. (1997), Chiappini et al. 1997]). From this plot, however, it is clear that a simple accretion law cannot encompass all the details of the complex evolution history of the Galaxy. This is fairly evident in the case of MWc but the same can be concluded for g106, despite its more regular decline due to the more quiet evolution. Nevertheless, when investigating mean abundance patterns with CEMs, an average description of the infall may be justified.
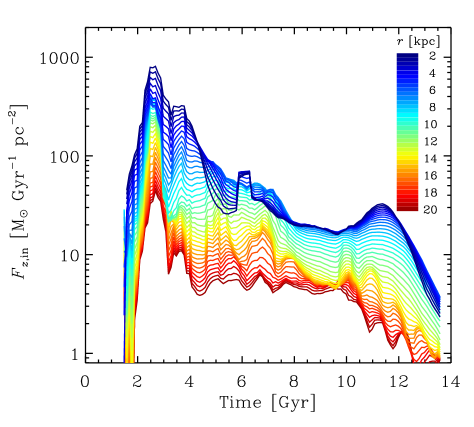
Figure 2 shows the vertical infall flux as a function of cosmic time for our best-resolved Milky Way candidate, g106, split in radial bins. In this way, the infall contribution at each annulus in the plane of the stellar disk can be cleary seen. As one moves away from the galactic center, the amount of gas accreted per unit time and area decreases in a way that is broadly consistent with the already mentioned inside-out formation scenario. Interestingly, for each annulus, the infall flux declines exponentially, in average. This is specially true at late times, where a more quiet decline with typical timescales of the order of Gyr is observed. At early times, the downturn is much more pronounced and occurs in timescales of Gyr. These two different accretion episodes might shed light on the formation mechanisms of the thin and thick disks (and bulge), as suggested in the two-infall model of [Chiappini et al. (1997), Chiappini et al. (1997)], although the discontinuity seen in chemical space does suggest a gap in star formation rate (which could be produced by a large merger event, in agreement with the results presented by A. Wetzel at this meeting).
References
- [Anders et al. (2017)] Anders, F., Chiappini, C., Minchev, I., et al. 2017, A&A, 600, 70
- [Cescutti (2008)] Cescutti, G. 2008, A&A, 481, 691
- [Cescutti & Chiappini (2014)] Cescutti, G., & Chiappini, C. 2014, A&A, 565, 51
- [Chiappini et al. (1997)] Chiappini, C., Matteucci, F., & Gratton, R. 1997, ApJ, 477, 765
- [Chiappini et al. (2001)] Chiappini, C., Matteucci, F., & Romano, D. 2001, ApJ, 554, 1044
- [Creasey et al. (2015)] Creasey, P., Scannapieco, C., Nuza, S. E., et al. 2015, ApJ, 800, L4
- [Putman et al. (2012)] Putman, M. E., Peek, J. E. G., & Joung, M. R. 2012, ARA&A, 50, 491
- [Martig et al. (2009)] Martig, M., Bournaud, F., Teyssier, R., & Dekel, A. 2009, ApJ, 707, 250
- [Martig et al. (2012)] Martig, M., Bournaud, F., Croton, D. J., Dekel, A., & Teyssier, R. 2012, ApJ, 756, 26
- [Minchev et al. (2013)] Minchev, T., Chiappini, C., & Martig, M. 2013, A&A, 558, A9
- [Minchev et al. (2013)] Minchev, T., Chiappini, C., & Martig, M. 2014, A&A, 572, A92
- [Nuza et al. (2014)] Nuza, S. E., Parisi, F., Scannapieco, C., et al. 2014, MNRAS, 441, 2593
- [Scannapieco et al. (2015)] Scannapieco, C., Creasey, P., Nuza, S. E., et al. 2015, A&A, 577, A3
- [Springel et al. (2008)] Springel, V., Wang, J., Vogelsberger, M., et al. 2008, MNRAS, 391, 1685