Gaia and the Galactic Center Origin of Hypervelocity Stars
Abstract
We use new Gaia measurements to explore the origin of the highest velocity stars in the Hypervelocity Star Survey. The measurements reveal a clear pattern in the B-type stars. Halo stars dominate the sample at speeds 100 km s-1 below Galactic escape velocity. Disk runaway stars have speeds up to 100 km s-1 above Galactic escape velocity, but most disk runaways are bound. Stars with speeds 100 km s-1 above Galactic escape velocity originate from the Galactic center. Two bound stars may also originate from the Galactic center. Future Gaia measurements will enable a large, clean sample of Galactic center ejections for measuring the massive black hole ejection rate of hypervelocity stars, and for constraining the mass distribution of the Milky Way dark matter halo.
1 Introduction
Hills (1988) first proposed that a 3-body exchange between a pair of stars and a massive black hole (MBH) can eject “hypervelocity stars” (HVSs) at 1000 km s-1 velocities from the Galactic center. We discovered the first HVS (Brown et al., 2005). This 3 main sequence B star moves with a Galactic rest frame velocity 670 km s-1, about twice Galactic escape velocity at its current distance of 100 kpc. Only a gravitational interaction with a massive compact object can plausibly explain its motion.
The discovery of HVS1 inspired the HVS Survey, a targeted radial velocity survey of B-type stars that should not exist at faint magnitudes in the halo (Brown et al., 2006, 2007b). Twenty one stars are significantly unbound in radial velocity alone (Brown et al., 2014). The extreme velocities, the short-lived nature of the stars, their distribution in Galactic latitude, and their overall numbers match theoretical expectations for the Galactic center origin proposed by Hills (1988). However the measurements provide only an indirect link to the MBH.
Alternative origins for unbound stars include ejection from the Galactic disk through binary disruption (Blaauw, 1961; Poveda et al., 1967) and ejection from the Large Magellanic Cloud (Boubert & Evans, 2016; Boubert et al., 2017). Galactic disk ejections are called “runaways” (Blaauw, 1961; Greenstein & Sargent, 1974). The disruption of a binary by a supernova, where the surviving star is released at the orbital velocity of the progenitor binary, can yield unbound runaways in extreme circumstances (e.g. Tauris, 2015). The first example of an unbound main sequence runaway is the B star HD 271791 (Heber et al., 2008; Przybilla et al., 2008a). The first example of an unbound Large Magellanic Cloud ejection is the B star HE 04375439 (Edelmann et al., 2005; Przybilla et al., 2008b; Erkal et al., 2018). Compact objects like white dwarfs can have higher binary disruption ejection velocities than main sequence stars. The first observational examples are the unbound subdwarf O star US 708 (Hirsch et al., 2005; Justham et al., 2009; Wang & Han, 2009; Geier et al., 2015), the white dwarf LP (Vennes et al., 2017; Raddi et al., 2018), and three white dwarf candidates found with Gaia (Shen et al., 2018).
The European Space Agency mission Gaia has begun a new era of precision astrometry. The trajectories of unbound stars hold the key to their origin. Measuring radial velocity to km s-1 precision is easy with modern spectroscopy; measuring tangential velocity, the product of distance and proper motion, is difficult. Known hypervelocity stars are at distances of 50 to 100 kpc; their expected proper motions are 1 mas yr-1. Newly released Gaia Data Release 2 provides improved proper motions for many HVSs (Gaia Collaboration et al., 2018a). Here, we use Gaia measurements to determine the origin of stars from the HVS Survey (Brown et al., 2007b, 2014) on the basis of their trajectory and velocity.
In Section 2 we define the sample and compare Gaia proper motions with previous Hubble Space Telescope (HST) measurements. In Section 3 we evaluate the origin of these stars on the basis of computed trajectories and ejection velocities. The results are in Section 4, and we conclude in Section 5. We identify Galactic center HVSs, Galactic disk runaways, and Galactic halo stars with different but overlapping velocities; the highest velocity stars are probably Galactic center ejections.
| ID | RA | Dec | GPS1 | |||
|---|---|---|---|---|---|---|
| (J2000) | (J2000) | (mag) | (mas yr-1, mas yr-1) | (mas yr-1, mas yr-1) | (mas yr-1, mas yr-1) | |
| HVS1 | 9:07:45.0 | 2:45:07 | 19.79 | , | , | |
| HVS5 | 9:17:59.5 | 67:22:38 | 17.93 | , | , | , |
| HVS4 | 9:13:01.0 | 30:51:20 | 18.40 | , | , | , |
| HVS6 | 11:05:57.5 | 9:34:39 | 19.06 | , | , | , |
| HVS19 | 11:35:17.8 | 8:02:01 | 20.18 | , | ||
| HVS22 | 11:41:46.4 | 4:42:17 | 20.26 | , | ||
| HVS9 | 10:21:37.1 | -0:52:35 | 18.84 | , | , | , |
| HVS18 | 23:29:04.9 | 33:00:11 | 19.66 | , | , | |
| B733 | 14:49:55.6 | 31:03:51 | 15.75 | , | , | , |
| HVS17 | 16:41:56.4 | 47:23:46 | 17.50 | , | , | |
| HVS13 | 10:52:48.3 | -0:01:34 | 20.18 | , | , | |
| HVS12 | 10:50:09.6 | 3:15:51 | 19.77 | , | , | , |
| HVS10 | 12:03:37.9 | 18:02:50 | 19.30 | , | , | , |
| HVS8 | 9:42:14.0 | 20:03:22 | 18.05 | , | , | , |
| HVS7 | 11:33:12.1 | 1:08:25 | 17.75 | , | , | , |
| HVS20 | 11:36:37.1 | 3:31:07 | 19.89 | , | ||
| HVS21 | 10:34:18.3 | 48:11:35 | 19.78 | , | ||
| B485 | 10:10:18.8 | 30:20:28 | 16.16 | , | , | , |
| HVS24 | 11:11:36.4 | 0:58:56 | 18.98 | , | , | |
| HVS16 | 12:25:23.4 | 5:22:34 | 19.40 | , | , | |
| B1080 | 10:33:57.3 | -1:15:07 | 18.73 | , | ||
| HVS15 | 11:33:41.1 | -1:21:14 | 19.24 | , | , | |
| B1085 | 11:22:55.8 | -9:47:35 | 17.53 | , | , | |
| B434 | 11:02:24.4 | 2:50:03 | 18.15 | , | , | , |
| B537 | 0:28:10.3 | 21:58:10 | 17.35 | , | ||
| B080 | 11:06:28.2 | -8:22:48 | 18.68 | , | , | |
| B572 | 0:59:56.1 | 31:34:39 | 18.02 | , | , | |
| B458 | 10:43:18.3 | -1:35:03 | 19.44 | , | , | |
| B711 | 14:20:01.9 | 12:44:05 | 17.00 | , | , | , |
| B576 | 14:04:32.4 | 35:22:58 | 17.53 | , | , | |
| B095 | 10:13:59.8 | 56:31:12 | 19.86 | , | , | |
| B495 | 11:52:45.9 | -2:11:16 | 18.22 | , | , | |
| B1139 | 18:00:50.9 | 48:24:25 | 17.66 | , | , | |
| B598 | 14:17:23.3 | 10:12:46 | 18.49 | , | , | |
| B329 | 15:48:06.9 | 9:34:24 | 19.05 | , | , | |
| B129 | 7:49:50.2 | 24:38:41 | 18.63 | , | , | |
| B143 | 8:18:28.1 | 57:09:22 | 17.55 | , | , | |
| B481 | 23:22:29.5 | 4:36:51 | 17.63 | , | , | |
| B167 | 9:07:10.1 | 36:59:58 | 18.16 | , | , |
2 Data
2.1 Sample
We study 42 radial velocity outliers from the Hypervelocity Star Survey (Brown et al., 2007b, 2014). We include all stars with heliocentric radial velocity transformed to the Galactic frame +275 km s-1,
| (1) |
where and are Galactic longitude and latitude, respectively, and we assume the Sun is moving with respect to the local standard of rest as measured by Schönrich et al. (2010) and the Galactic disk circular velocity is 235 km s-1 (Reid et al., 2014). We choose +275 km s-1 because of the significant absence of negative velocity outliers in the HVS Survey. The four most negative velocity stars have km s-1 (Brown et al., 2014), implying that the 42 stars with km s-1 are a relatively clean sample of ejected stars with minimal halo star contamination.
The HVS Survey targeted stars selected by color (Brown et al., 2012) with no kinematic selection. The spectroscopy is 99% complete. Stellar atmosphere fits establish that the majority of unbound stars are main sequence B stars (Brown et al., 2014, 2015, and references therein). The bound stars are also probably main sequence B stars on the basis of their velocity distribution. The absence of km s-1 stars in the HVS Survey implies that the km s-1 stars must have lifetimes less than their 1 Gyr orbital turn-around time (Brown et al., 2007a; Kollmeier & Gould, 2007; Yu & Madau, 2007). Thus they are B stars, and we calculate stellar distances using Padova main-sequence tracks (Girardi et al., 2004; Marigo et al., 2008; Bressan et al., 2012) with an estimated precision of 15%. We transform heliocentric distances to the Galactic frame assuming that the Sun is located 8 kpc from the Galactic center (Camarillo et al., 2018).
The HVS Survey exclusively samples the stellar halo. The apparent magnitude limit corresponds to approximately kpc in Galactocentric radial distance. For completeness, we include five stars from the bright portion of the initial HVS Survey (Brown et al., 2007b). The bright stars are nearby kpc and bound, but four have HST proper motion measurements for comparison with Gaia.
Table 1 lists the sample of 42 stars with their coordinates and apparent -band SDSS magnitude. We sort the table by decreasing . We refer to bound objects with the letter B followed by their target number in the HVS Survey, and unbound objects by their published HVS number. We also list the east-west and north-south components of proper motion, (, ), obtained from three sources.
2.2 Proper Motions
Gaia Data Release 2 contains proper motions for 39 of the 42 stars listed in Table 1. The three missing stars (HVS14, HVS23, and B149) have too few Gaia measurements for a robust solution. We drop them from further consideration. The remaining 39 velocity outliers satisfy the quality controls recommended by Lindegren et al. (2018): i.e. the objects all have visibility periods, mas astrometric excess noise, and the longest semi-major axis in the 5-dimensional error ellipses is mas. For reference, the median Gaia proper motion error for the 39 objects is mas yr-1. The brightest stars have errors of only 0.11 mas yr-1.
2.2.1 Gaia Covariances
Because Gaia values are derived from a 5-parameter astrometric solution (Lindegren et al., 2018), the Gaia proper motions are correlated with our choice of parallax = 1/distance. We simplify the issue by assuming that position errors are zero. The remaining three covariances are between parallax and the two components of proper motion.
In practice, Gaia parallax errors provide so little constraint that the covariances affect our results very little. Gaia parallaxes for our sample range from -1.06 mas to +1.20 mas, with a mean of mas. The mean spectrophotometric parallax in our sample, mas, is 100 times more precise. The typical 0.5- difference between the Gaia parallax and our spectrophotometric parallax yields a typical 0.055 mas yr-1 shift in the Gaia proper motion value, a shift that is about 10% of the published proper motion error. Physically, this shift corresponds to a 13 km s-1 (10%) change in tangential velocity, and an even smaller change to the total velocity of the stars.
Tables 1 lists the Gaia proper motion values appropriate for our adopted distances.
2.2.2 HST Comparison
Brown et al. (2015) publish independent proper motion measurements made with HST for 14 stars. The HST proper motions were measured relative to background galaxies. They thus provide a test of Gaia’s absolute reference frame.
Figure 1 (upper panel) plots the difference between Gaia and HST proper motion divided by the errors summed in quadrature. Clipping two 3 outliers (see below), the average difference mas yr-1 and mas yr-1 consistent with zero.
The comparison also reveals that the most problematic HST measurements are the brightest stars. For bright stars, Brown et al. (2015) paired short and long exposures to tie the stars to faint background galaxies. This approach likely introduced additional error. We add 0.5 mas yr-1 in quadrature to the published HST error for those objects (B434, B485, B711, B711, HVS7, HVS8). The median HST proper motion error for the 14 stars is then mas yr-1; the best-measured star has an error of mas yr-1.
The HST measurements highlight the value of obtaining pointed observations with long exposure times. Although Gaia errors are 3 times better than HST errors for bright stars, HST errors are 4 times better than Gaia errors for faint stars like HVS1. Errors are comparable in size at mag. A weighted mean would maximize the information from HST and Gaia, however we do not want to add measurements that include possible systematic error.
We adopt Gaia proper motions for the seven bright stars with . This subset includes all stars observed with paired short+long exposures in the HST program. We adopt a weighted mean for the three stars where and are within a factor of two (HVS4, HVS6, and HVS9). We adopt the HST proper motions for the four stars with (HVS1, HVS10, HVS12, HVS13).

2.2.3 GPS1 Comparison
We compare Gaia proper motions with the Gaia-PanStarrs1-SDSS catalog (GPS1, Tian et al., 2017). GPS1 proper motions are based on astrometric positions from ground-based PanStarrs1, SDSS, and 2MASS catalogs plus Gaia Data Release 1. Because the GPS1 time baseline comes from the ground-based catalogs, and because Gaia Data Release 2 is a new solution to the Gaia measurements, GPS1 proper motions are essentially independent of Gaia Data Release 2 values. GPS1 proper motions are available for 33 stars.
Figure 1 (lower panel) plots the difference between Gaia and GPS1 proper motion divided by the errors summed in quadrature. Clipping two 3 outliers, the average difference mas yr-1 and mas yr-1 consistent with zero. The distribution in declination shows a possible asymmetry.
Despite the longer time baseline of ground-based observations, . Thus we do not use GPS1 values here. The median GPS1 proper motion error for the 33 stars is mas yr-1; the best-measured star has an error of mas yr-1.
3 Analysis
We evaluate the probability of origin on the basis of computed trajectories and ejection velocities. We select a gravitational potential model, trace the trajectory of each star backwards in time, and calculate the required ejection velocity from that position in the Milky Way. We estimate likelihood from the density distribution of simulated trajectories as they cross the Galactic plane.
3.1 Gravitational Potential Model
To address the origin of HVS ejections from the Galactic center, we require a gravitational potential model that fits observed mass measurements from the Galactic center to the outer halo. We adopt the three component bugle-disk-halo model of Kenyon et al. (2014). The model has a flat 235 km s-1 rotation curve and a halo mass consistent with recent Gaia measurements from the orbits of globular clusters and dwarf galaxies (Gaia Collaboration et al., 2018b; Fritz et al., 2018; Posti & Helmi, 2018; Watkins et al., 2018).
The results are insensitive to the choice of potential model because the stars are on nearly radial trajectories. Inserting a simulated Large Magellanic Cloud into the potential model (see Kenyon et al., 2018) changes the computed flight times by 1 Myr, changes the Galactic plane crossing location of the orbits by 0.4 kpc, and changes the effective escape velocity by 10 km s-1. We thus choose to work with the 3-component model.
We determine effective Galactic escape velocity, , by dropping a test particle from rest at the virial radius. At the Solar circle kpc, km s-1 consistent with the most recent Solar neighborhood escape velocity measurement (Monari et al., 2018). At the radius of influence of the supermassive black hole, km s-1 (Kenyon et al., 2008). Only a gravitational interaction with the supermassive black hole can eject a main sequence star at 900 km s-1 (Hills, 1988). At the median kpc depth of the HVS Survey sample, km s-1.
3.2 Trajectory Calculation
Calculations are straightforward for the nearly radial trajectories of the stars. We start from the measured position and velocity of each star, and integrate its trajectory backward in time through the Galactic potential. We record where each trajectory crosses the Galactic plane, and its distance from the Galactic center. We also record the ejection velocity required to launch the star from the disk-crossing location, given the angle of the trajectory relative to Galactic rotation.
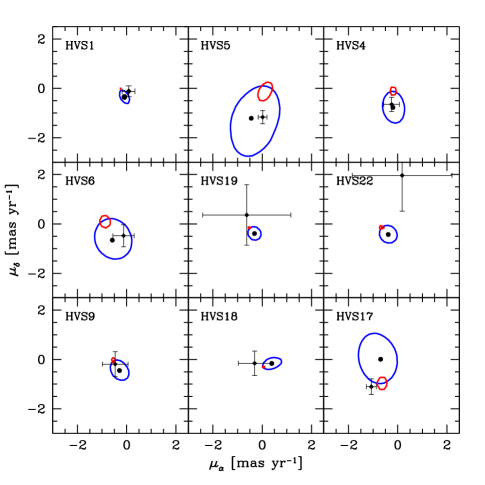
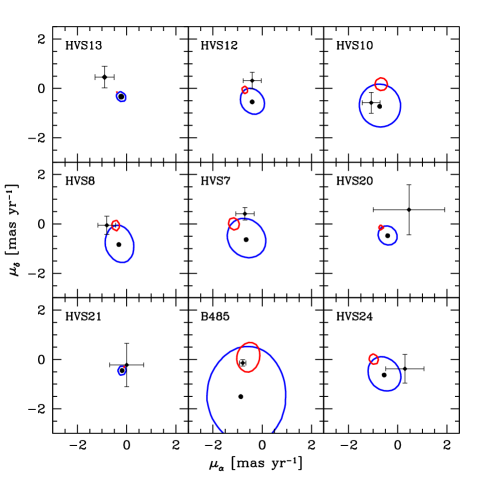
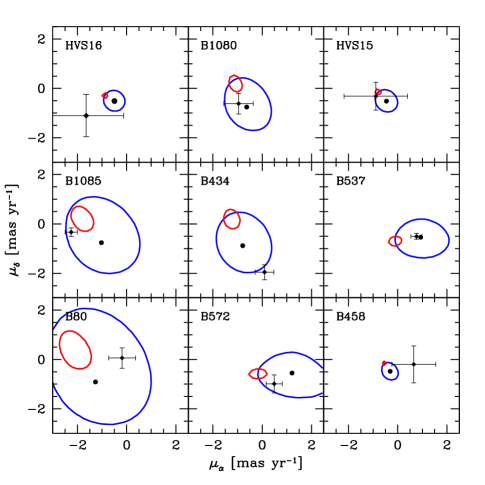
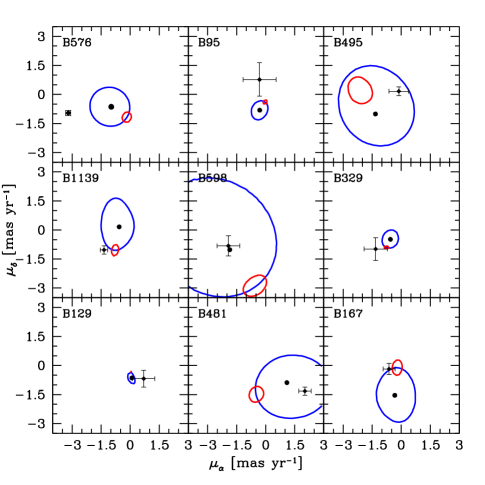
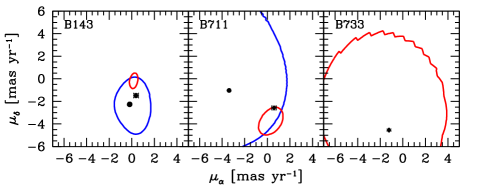
Figure 2 plots the proper motion measurement for each star. Because we know position and radial velocity, a proper motion in Figure 2 corresponds to a unique trajectory through the Galaxy given a gravitational potential model. The blue ellipses in Figure 2 are the loci of proper motions with trajectories that cross the Galactic plane at kpc, the edge of the Milky Way disk. The red circle is the region of minimum Galactic disk ejection velocity, the region where Galactic disk ejections can most easily escape the gravitational pull of the Milky Way. A Galactic Center trajectory is marked by the large black dot.
Measurement errors broaden the range of possible trajectories. Thus we draw final conclusions from the density distribution of possible trajectories. For each star, we perform Monte Carlo trajectory calculations assuming that measurement errors are normally distributed. We generate correlated normal distributions for parallax, , using the Gaia correlation matrix and a Cholesky decomposition. A 0.5 kpc uncertainty in solar position or a 10 km s-1 uncertainty in circular velocity yield negligible 0.5 kpc changes in Galactic plane crossing location and 0.2 Myr changes in flight times. Thus we set the solar position and circular velocity error to zero for simplicity. Distance and proper motion are the two dominant sources of uncertainty. We then measure the density of simulated trajectories as they cross the Galactic disk plane.
We evaluate likelihood of origin based on the 0.3173 (1), 0.0455 (2), and 0.0027 (3) thresholds of the trajectory distribution at the Galactic plane. This approach is valid for testing the origin of unbound stars that cross the Galactic plane only once, or bound stars with lifetimes less than their orbital turn-around time; this approach is invalid for long-lived stars that cross the plane more than once. The measurements provide trajectory constraints for about half of the sample, namely for the stars with kpc.
3.3 Large Magellanic Cloud
Our northern hemisphere sample of stars is poorly suited to test the Large Magellanic Cloud origin hypothesis, which predicts a monopole of unbound stars in the southern sky (Boubert & Evans, 2016; Boubert et al., 2017). Nearly all of our stars must pass through the disk of the Milky Way to reach the Large Magellanic Cloud in the south. A better test is provided by the southern hemisphere star HE 04375439 (Edelmann et al., 2005): its trajectory points from the Large Magellanic Cloud (Erkal et al., 2018) and its unbound velocity possibly requires dynamical interaction with an intermediate mass black hole (Gualandris & Portegies Zwart, 2007).
3.4 Ejection Velocity
The ejection velocity required to explain the present position and motion of our stars provides another constraint on their origin. In the absence of a massive black hole, the speed limit for ejection from a stellar binary is set by the finite sizes of the stars (Leonard, 1991). The orbital velocity of an equal-mass pair of stars separated by their radii is equal to the escape velocity from the surface of the stars. Because stars on the main sequence have a quasi-linear relation between mass and radius, most stars in the Milky Way share a common escape velocity from their surface of about 600 km s-1. To achieve higher binary orbital speeds, main sequence stars would have to orbit inside each other, which is impossible. A 600 km s-1 speed limit is optimistic; the speed can only be lower if mass transfer, tidal heating, or binary evolution are taken into account (e.g. Fregeau et al., 2004; Renzo et al., 2018).
Chaining together dynamical and supernova ejections can theoretically yield a higher velocity (Pflamm-Altenburg & Kroupa, 2010), but the observable rate of such events is reduced by the joint probability of dynamically ejecting a binary and then disrupting it through a supernova explosion at maximum velocity in the same direction. We estimate that the Galactic center ejection rate is orders of magnitude larger at 600 km s-1 speeds (Brown et al., 2009).
The ejection velocities required for the fastest stars in the HVS Survey exceed 600 km s-1. Thus the ejection velocities demand a Galactic center origin. For stars near Galactic escape velocity, however, there is finite region of the Milky Way disk where the stars can be ejected at 600 km s-1. The region is set by the Milky Way gravitational potential and the rotation of the Milky Way disk: the ejection velocity minimum is located in the outer disk, at the position where the disk rotation vector points in the direction of ejection (Bromley et al., 2009). Convolved with the power-law distribution of runaway ejection velocities (Portegies Zwart, 2000; Perets & Subr, 2012; Renzo et al., 2018), the most probable disk runaway origin location is this region of minimum ejection velocity. We mark the minimum disk ejection velocity region for each star in Figure 2 with a red ellipse.
4 Constraints on Origin
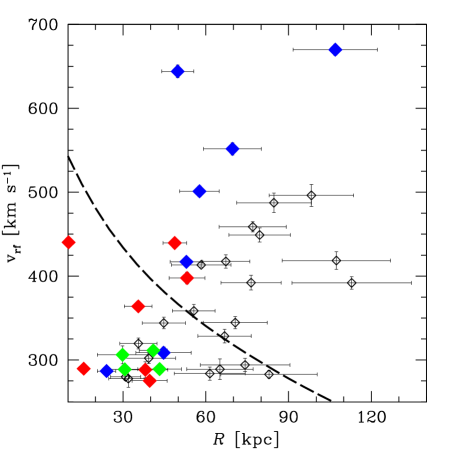
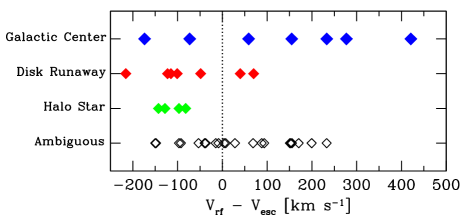
We identify three classes of objects with distinct but overlapping velocity distributions in our sample: 1) Galactic center HVSs, 2) Galactic disk runaways, and 3) Galactic halo stars. Figure 3 and Figure 4 summarize the results. We discuss the results in terms of , the heliocentric radial velocity transformed to the Galactic frame, because it is the largest component of velocity and the most accurately measured. Figure 3 plots versus Galactic radial distance . The dashed line is the Galactic escape velocity curve, and symbol color indicates the likely origin of each star. Figure 4 groups the origins together and plots them relative to Galactic escape velocity, . A total of 18 objects have robust constraints.
4.1 Galactic Center Hypervelocity Stars
A Galactic center origin is statistically preferred for all of the fastest stars with km/s (HVS1, HVS4, HVS5, and HVS6). The trajectories currently provide 2 constraints. The velocity itself provides an additional physical constraint for the unbound stars: the minimum Galactic disk ejection velocity is comparable to the escape velocity from the surface of the stars, a severe challenge to disk ejection. We identify seven probable Galactic center HVS ejections.
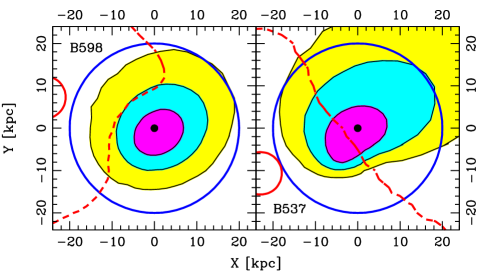
Two bound stars, B537 and B598, have trajectories that point directly from the Galactic center, and reject the Galactic disk origin hypothesis at 3 significance. To better understand these objects, Figure 5 plots the probability contours where these two objects cross the Galactic plane in Cartesian coordinates. The solid red lines in Figure 5 mark the regions of minimum Galactic disk ejection velocity, excluded at 3 confidence. The dashed red lines in Figure 5 mark the locus of trajectories with 500 km s-1 Galactic disk ejection velocities. Thus it is possible that B537 and B598 are high speed Galactic disk ejections. A factor of 2 improvement in proper motion error would exclude this possibility for B598. It is also possible that B537 and B598 are halo stars on very radial orbits. High resolution spectroscopy can determine whether these are metal-poor halo stars or main sequence B stars.
Extrapolating these results to the unconstrained half of the sample, we expect that about half of the unbound stars in the HVS Survey are Galactic center ejections. Brown et al. (2014) thus overestimate the number of Galactic center ejections by a factor of two. The implication is that, if HVSs are ejected continuously and isotropically, there are about 50 unbound 2.5-4 HVSs over the entire sky to 100 kpc. We compare this number with the theoretical predictions of Zhang et al. (2013). The models that best match the observed distribution of S-stars in the Galactic center and unbound stars in the Galactic halo predict about 10 to 30 unbound 3-4 HVSs over the entire sky. Our revised number of unbound HVSs from the Galactic center is thus in better agreement with theoretical ejection calculations for the MBH ejection scenario.
4.2 Disk Runaways
We estimate the likelihood of Galactic disk origin by averaging the trajectory density over a 5 kpc radius region centered on the position of minimum Galactic disk ejection velocity. This metric can be pessimistic for the nearest bound objects, but it is well-matched to the average distance and proper motion errors of the sample. We identify seven disk runaways with trajectories inconsistent with the Galactic center hypothesis at 3 significance, and statistically consistent with a Galactic disk ejection.
Disk runaways and Galactic center HVSs have comparable frequency at speeds around the Galactic escape velocity (Figure 4). The fastest disk runaways have km s-1. However, most disk runaways are bound.
Interestingly, the two unbound disk runaways are spectroscopically unusual. HVS7 and HVS17 are both chemically peculiar B stars (Przybilla et al., 2008c; Brown et al., 2013). HVS7 is 10-100 times under-abundant in He and in CNO relative to the Sun, and 100-10,000 time over-abundant in iron group and rare-earth elements (Przybilla et al., 2008c). It is unclear whether abundance patterns are linked to a supernova binary disruption origin, however. The abundance patterns of the unbound runaway B stars HVS7, HVS17, and HD 271791 (Przybilla et al., 2008a) differ significantly. McEvoy et al. (2017) find no correlation in a more detailed abundance analysis of 38 runaway B stars.
The frequency of unbound runaways is linked to their ejection rate. Theoretical ejection models predict a power-law distribution of ejection velocities (Portegies Zwart, 2000; Perets & Subr, 2012; Renzo et al., 2018). In these models, 99% of runaways are launched from the disk with 200 km s-1 speeds. Simulated distributions of runaways in the Milky Way therefore predict a flattened spatial distribution of runaways with a scale height comparable to the thick disk (Bromley et al., 2009). We expect that magnitude-limited surveys of less luminous types of stars than B stars will find many more runaways near the disk.
4.3 Halo stars
Halo stars first appear at km s-1 in our sample. There are four bound objects with trajectories that significantly reject both Galactic center and Galactic disk origins, and which cross the disk in the direction opposite Galactic rotation. These stars are likely halo stars, presumably hot blue horizontal branch stars with temperatures and surface gravities similar to main sequence B stars. The number of halo stars is consistent with the number of km s-1 negative velocity outliers in the HVS Survey. At even lower km s-1 velocities, halo stars completely dominate the HVS Survey (Brown et al., 2014).
Indeed, the Gaia measurements show that 94% of previously claimed unbound stars are likely bound halo stars (Boubert et al., 2018). Searches targeting high velocity stars in Gaia (Marchetti et al., 2018; Hattori et al., 2018a) predominantly find low-mass, metal-poor stars moving in equal numbers towards and away from the Sun; in other words, halo stars.
5 Conclusions
Gaia proper motions enable distinction between true Galactic center HVSs and other high velocity stars. We examine the probable origin for B-type stars from the HVS Survey. Eighteen objects have robust constraints. Halo stars dominate the sample at bound speeds, km s-1. We identify seven disk runaways with trajectories that significantly reject the Galactic center hypothesis. The fastest disk runaways have km s-1, but the majority are bound. We identify seven probable Galactic center HVS ejections. The Galactic center ejections dominate the sample at speeds significantly above Galactic escape velocity.
A clean sample of HVSs is important for constraining the Galactic center ejection mechanism. With a sample of 50 HVSs, for example, discrimination between a single and a binary MBH ejection scenario might be possible (Sesana et al., 2007). Different MBH ejection mechanisms predict different spatial distributions of HVSs on the sky (Levin, 2006; Abadi et al., 2009; Zhang et al., 2013; Boubert & Evans, 2016; Kenyon et al., 2018). These distributions can be tested with larger samples of HVSs.
A well-defined sample of HVSs will also enable measurement of the ejection rate of stars encountering the MBH. Tidal disruption events may be closely related to the encounters that produce HVSs (Bromley et al., 2012).
Gaia end-of-mission proper motion errors should improve by a factor of 3. There are a dozen objects in our sample with 1-2 trajectory constraints that will have 3 constraints in only a few years. For the faintest stars, however, Gaia cannot compete with pointed observations. Next generation missions like the proposed Theia mission (Theia Collaboration et al., 2017) are needed to measure HVS proper motions with uncertainties significantly below 0.1 mas yr-1.
With uncertainties below 0.1 mas yr-1, HVSs become important tools for measuring the Milky Way mass distribution (Gnedin et al., 2005; Yu & Madau, 2007). HVSs integrate the gravitational potential from the very center of the Milky Way to its outermost regions. Theorists have proposed measuring the angular momentum of one very nearby HVS (Hattori et al., 2018b) or using the phase space distribution of hundreds of HVSs (Perets et al., 2009; Rossi et al., 2017; Contigiani et al., 2018) to constrain the Milky Way mass distribution. Thus HVSs can complement studies possible now, that use halo star streams (Bonaca & Hogg, 2018), globular clusters (Posti & Helmi, 2018; Watkins et al., 2018), or dwarf galaxies (Fritz et al., 2018) to constrain the Milky Way dark matter halo. Any deviation of a HVS’s trajectory from the Galactic center measures the Milky Way’s non-spherical mass distribution, independent of any other technique.
Gaia
| ID | R | ||||
|---|---|---|---|---|---|
| km s-1 | kpc | km s-1 | |||
| HVS1 | 0.41959 | 0.13256 | |||
| HVS5 | 0.02566 | 0.00234 | |||
| HVS4 | 0.80644 | 0.02091 | |||
| HVS6 | 0.60588 | 0.08691 | |||
| HVS19 | 0.84863 | 0.72447 | |||
| HVS22 | 0.06899 | 0.06631 | |||
| HVS9 | 1.00000 | 0.59219 | |||
| HVS18 | 0.79264 | 0.93030 | |||
| B733 | 0.00000 | 0.00016 | |||
| HVS17 | 0.00036 | 0.07498 | |||
| HVS13 | 0.12816 | 0.84341 | |||
| HVS12 | 0.06419 | 0.36458 | |||
| HVS10 | 0.92961 | 0.10883 | |||
| HVS8 | 0.43309 | 0.52037 | |||
| HVS7 | 0.00100 | 0.11113 | |||
| HVS20 | 0.22497 | 0.16428 | |||
| HVS21 | 0.87222 | 0.54908 | |||
| B485 | 0.00000 | 0.28713 | |||
| HVS24 | 0.53504 | 0.16045 | |||
| HVS16 | 0.98818 | 0.65225 | |||
| B1080 | 1.00000 | 0.21767 | |||
| HVS15 | 1.00000 | 0.73678 | |||
| B1085 | 0.22286 | 0.01703 | |||
| B434 | 0.00155 | 0.00000 | |||
| B537 | 0.72596 | 0.00000 | |||
| B080 | 0.00036 | 0.02590 | |||
| B572 | 0.16757 | 0.00489 | |||
| B458 | 0.46156 | 0.13478 | |||
| B711 | 0.00000 | 0.04737 | |||
| B576 | 0.02239 | 0.00000 | |||
| B095 | 0.41893 | 0.97142 | |||
| B495 | 0.00000 | 0.00243 | |||
| B1139 | 0.00000 | 0.02608 | |||
| B598 | 0.93866 | 0.00000 | |||
| B329 | 1.00000 | 0.41425 | |||
| B129 | 0.21733 | 0.02988 | |||
| B143 | 0.02091 | 0.00000 | |||
| B481 | 0.36545 | 0.00000 | |||
| B167 | 0.00000 | 0.47101 |
References
- Abadi et al. (2009) Abadi, M. G., Navarro, J. F., & Steinmetz, M. 2009, ApJ, 691, L63
- Blaauw (1961) Blaauw, A. 1961, Bull. Astron. Inst. Netherlands, 15, 265
- Bonaca & Hogg (2018) Bonaca, A. & Hogg, D. W. 2018, ApJ, submitted
- Boubert et al. (2017) Boubert, D., Erkal, D., Evans, N. W., & Izzard, R. G. 2017, MNRAS, 469, 2151
- Boubert & Evans (2016) Boubert, D. & Evans, N. W. 2016, ApJ, 825, L6
- Boubert et al. (2018) Boubert, D., Guillochon, J., Hawkins, K., et al. 2018, MNRAS, 479, 2789
- Bressan et al. (2012) Bressan, A., Marigo, P., Girardi, L., et al. 2012, MNRAS, 427, 127
- Bromley et al. (2009) Bromley, B. C., Brown, W. R., Geller, M. J., & Kenyon, S. J. 2009, ApJ, 706, 925
- Bromley et al. (2012) Bromley, B. C., Kenyon, S. J., Geller, M. J., & Brown, W. R. 2012, ApJ, 749, L42
- Brown et al. (2015) Brown, W. R., Anderson, J., Gnedin, O. Y., et al. 2015, ApJ, 804, 49
- Brown et al. (2013) Brown, W. R., Cohen, J. G., Geller, M. J., & Kenyon, S. J. 2013, ApJ, 775, 32
- Brown et al. (2009) Brown, W. R., Geller, M. J., & Kenyon, S. J. 2009, ApJ, 690, 1639
- Brown et al. (2012) —. 2012, ApJ, 751, 55
- Brown et al. (2014) —. 2014, ApJ, 787, 89
- Brown et al. (2005) Brown, W. R., Geller, M. J., Kenyon, S. J., & Kurtz, M. J. 2005, ApJ, 622, L33
- Brown et al. (2006) —. 2006, ApJ, 640, L35
- Brown et al. (2007a) Brown, W. R., Geller, M. J., Kenyon, S. J., Kurtz, M. J., & Bromley, B. C. 2007a, ApJ, 660, 311
- Brown et al. (2007b) —. 2007b, ApJ, 671, 1708
- Camarillo et al. (2018) Camarillo, T., Mathur, V., Mitchell, T., & Ratra, B. 2018, PASP, 130, 024101
- Contigiani et al. (2018) Contigiani, O., Rossi, E. M., & Marchetti, T. 2018, MNRAS, submitted
- Edelmann et al. (2005) Edelmann, H., Napiwotzki, R., Heber, U., Christlieb, N., & Reimers, D. 2005, ApJ, 634, L181
- Erkal et al. (2018) Erkal, D., Boubert, D., Gualandris, A., Evans, N. W., & Antonini, F. 2018, MNRAS, submitted
- Fregeau et al. (2004) Fregeau, J. M., Cheung, P., Portegies Zwart, S. F., & Rasio, F. A. 2004, MNRAS, 352, 1
- Fritz et al. (2018) Fritz, T. K., Battaglia, G., Pawlowski, M. S., et al. 2018, A&A, submitted
- Gaia Collaboration et al. (2018a) Gaia Collaboration, Brown, A. G. A., Vallenari, A., et al. 2018a, A&A, accepted
- Gaia Collaboration et al. (2018b) Gaia Collaboration, Helmi, A., van Leeuwen, F., et al. 2018b, A&A, accepted
- Geier et al. (2015) Geier, S., Fürst, F., Ziegerer, E., et al. 2015, Science, 347, 1126
- Girardi et al. (2004) Girardi, L., Grebel, E. K., Odenkirchen, M., & Chiosi, C. 2004, A&A, 422, 205
- Gnedin et al. (2005) Gnedin, O. Y., Gould, A., Miralda-Escudé, J., & Zentner, A. R. 2005, ApJ, 634, 344
- Greenstein & Sargent (1974) Greenstein, J. L. & Sargent, A. I. 1974, ApJS, 28, 157
- Gualandris & Portegies Zwart (2007) Gualandris, A. & Portegies Zwart, S. 2007, MNRAS, 376, L29
- Hattori et al. (2018a) Hattori, K., Valluri, M., Bell, E. F., & Roederer, I. U. 2018a, ApJ, submitted
- Hattori et al. (2018b) Hattori, K., Valluri, M., & Castro, N. 2018b, ApJ, submitted
- Heber et al. (2008) Heber, U., Edelmann, H., Napiwotzki, R., Altmann, M., & Scholz, R.-D. 2008, A&A, 483, L21
- Hills (1988) Hills, J. G. 1988, Nature, 331, 687
- Hirsch et al. (2005) Hirsch, H. A., Heber, U., O’Toole, S. J., & Bresolin, F. 2005, A&A, 444, L61
- Justham et al. (2009) Justham, S., Wolf, C., Podsiadlowski, P., & Han, Z. 2009, A&A, 493, 1081
- Kenyon et al. (2014) Kenyon, S. J., Bromley, B. C., Brown, W. R., & Geller, M. J. 2014, ApJ, 793, 122
- Kenyon et al. (2018) —. 2018, ApJ, submitted
- Kenyon et al. (2008) Kenyon, S. J., Bromley, B. C., Geller, M. J., & Brown, W. R. 2008, ApJ, 680, 312
- Kollmeier & Gould (2007) Kollmeier, J. A. & Gould, A. 2007, ApJ, 664, 343
- Leonard (1991) Leonard, P. J. T. 1991, AJ, 101, 562
- Levin (2006) Levin, Y. 2006, ApJ, 653, 1203
- Lindegren et al. (2018) Lindegren, L., Hernandez, J., Bombrun, A., et al. 2018, A&A, submitted
- Marchetti et al. (2018) Marchetti, T., Rossi, E. M., & Brown, A. G. A. 2018, MNRAS, submitted
- Marigo et al. (2008) Marigo, P., Girardi, L., Bressan, A., et al. 2008, A&A, 482, 883
- McEvoy et al. (2017) McEvoy, C. M., Dufton, P. L., Smoker, J. V., et al. 2017, ApJ, 842, 32
- Monari et al. (2018) Monari, G., Famaey, B., Carrillo, I., et al. 2018, A&A, accepted
- Perets & Subr (2012) Perets, H. B. & Subr, L. 2012, ApJ, 751, 133
- Perets et al. (2009) Perets, H. B., Wu, X., Zhao, H. S., et al. 2009, ApJ, 697, 2096
- Pflamm-Altenburg & Kroupa (2010) Pflamm-Altenburg, J. & Kroupa, P. 2010, MNRAS, 404, 1564
- Portegies Zwart (2000) Portegies Zwart, S. F. 2000, ApJ, 544, 437
- Posti & Helmi (2018) Posti, L. & Helmi, A. 2018, A&A, submitted
- Poveda et al. (1967) Poveda, A., Ruiz, J., & Allen, C. 1967, Bol. Obs Tonantzintla Tacubaya, 4, 860
- Przybilla et al. (2008a) Przybilla, N., Nieva, M. F., Heber, U., & Butler, K. 2008a, ApJ, 684, L103
- Przybilla et al. (2008b) Przybilla, N., Nieva, M. F., Heber, U., et al. 2008b, A&A, 480, L37
- Przybilla et al. (2008c) Przybilla, N., Nieva, M. F., Tillich, A., et al. 2008c, A&A, 488, L51
- Raddi et al. (2018) Raddi, R., Hollands, M. A., Gänsicke, B. T., et al. 2018, MNRAS, 479, L96
- Reid et al. (2014) Reid, M. J., Menten, K. M., Brunthaler, A., et al. 2014, ApJ, 783, 130
- Renzo et al. (2018) Renzo, M., Zapartas, E., de Mink, S. E., et al. 2018, A&A, submitted
- Rossi et al. (2017) Rossi, E. M., Marchetti, T., Cacciato, M., Kuiack, M., & Sari, R. 2017, MNRAS, 467, 1844
- Schönrich et al. (2010) Schönrich, R., Binney, J., & Dehnen, W. 2010, MNRAS, 403, 1829
- Sesana et al. (2007) Sesana, A., Haardt, F., & Madau, P. 2007, MNRAS, 379, L45
- Shen et al. (2018) Shen, K. J., Boubert, D., Gänsicke, B. T., et al. 2018, ApJ, submitted
- Tauris (2015) Tauris, T. M. 2015, MNRAS, 448, L6
- Theia Collaboration et al. (2017) Theia Collaboration, Boehm, C., Krone-Martins, A., et al. 2017, ArXiv, 1707.01348
- Tian et al. (2017) Tian, H.-J., Gupta, P., Sesar, B., et al. 2017, ApJS, 232, 4
- Vennes et al. (2017) Vennes, S., Nemeth, P., Kawka, A., et al. 2017, Science, 357, 680
- Wang & Han (2009) Wang, B. & Han, Z. 2009, A&A, 508, L27
- Watkins et al. (2018) Watkins, L. L., van der Marel, R. P., Sohn, S. T., & Evans, N. W. 2018, ApJ, submitted
- Yu & Madau (2007) Yu, Q. & Madau, P. 2007, MNRAS, 379, 1293
- Zhang et al. (2013) Zhang, F., Lu, Y., & Yu, Q. 2013, ApJ, 768, 153