Load Dependence of Power Outage Statistics
Abstract
The size distributions of power outages are shown to depend on the stress, or the proximity of the load of an electrical grid to complete breakdown. Using the data for the U.S. between 2002-2017, we show that the outage statistics are dependent on the usage levels during different hours of the day and months of the year. At higher load, not only are more failures likely, but the distribution of failure sizes shifts, to favor larger events. At a finer spatial scale, different regions within the U.S. can be shown to respond differently in terms of the outage statistics to variations in the usage (load). The response, in turn, corresponds to the respective bias towards larger or smaller failures in those regions. We provide a simple model, using realistic grid topologies, which can nonetheless demonstrate biases as a function of the applied load, as in the data. Given sufficient data of small scale events, the method can be used to identify vulnerable regions in power grids prior to major blackouts.
I Introduction
Sustained and secure supply of power is a vital component of a prosperous society. Other essential services, such as water supply, medical infrastructure, communication, transport and so on are all dependent on the stability of their power supplies. Interruptions or outages in the power supply can have catastrophic consequences, as was witnessed in many occasions (e.g. August 14th, 2003 in the U.S. and Canada; September 28th, 2003 in Italy; and July 30th, 2012 in India) list . Characterizations of power grid instabilities and outages, therefore, have been active topics of research for decades in engineering and physics communities (see e.g., anatomy ; dobson2015 ; timme12 ; pahwa14 ; brummitt12 ; simonsen08 ; vaiman12 ; ji16 ). An operating power grid, particularly near its permissible level of capacity, can suffer from large outages triggered from small initial fluctuations or disturbances. For example, a software failure in an early warning management system report , a falling tree on a line report_italy or overloading by users blackout_india caused the above mentioned blackouts affecting, respectively, about 55, 56 and 620 million people. An amplified response to a small scale perturbation is a prominent signature of system-wide correlations developed near a critical point.
A clear example of correlated response in power grids is the distribution function of the outage sizes, determined, for example, by the number of customers left unserved during an outage. While a random failure probability would give an exponentially decaying distribution for outage sizes, in reality the probability of an outage of size has a power law tail 2007chaos : , implying relatively higher probabilities for large outages. This is due to local correlations and causally connected cascades or avalanches of outage events. Statistical analysis of those avalanches, particularly those demonstrating the universality of the exponent value across different countries 2007chaos , has led to the identification of the dynamics of the power grid avalanches with that of self organized criticality (SOC) dobson00 ; dobson04 . Indeed, a connected set of objects (grid lines) having finite failure thresholds, with drive (customer demand) and dissipation (load unserved) is a suitable system for showing universal collective behavior in a self-organized critical state. Drawing such a parallel allows for investigation of power grid dynamics using the standard tools of SOC developed over decades bak . Furthermore, it also puts power grids in the generic class of driven dissipative systems having intermittent activities or avalanches with scale free size distributions. For example, this is reminiscent of the Gutenberg-Richter-like law seen in various scales such as originally for the earthquake statistics gr , also for stressed brittle solids main_kun , sheared granular media takahiro and so on.
While in the steady state the time series of the avalanches show scale free size distribution with universal exponent value, a common observation in these systems is the variation of this exponent value with the ‘load’ on the system. Load is in general considered here to be the relevant driving field, e.g. tectonic stress for earthquakes, compressive stress for fracture experiments and so on. Specifically, if only the events occurring at a higher stress are sampled, the magnitude of the exponent is smaller than what is obtained for events occurring at a lower stress. This was first observed for sheared rocks scholtz where the exponent decreases linearly with the differential stress. Subsequently, it was observed in other failure dynamics amitrano , including famously for the Gutenberg-Richter law exponent in earthquakes sch05 ; scholz15 . Although the magnitudes of earthquakes follow universal scaling, in some regions the exponent value tends to be lower, signaling a higher risk of large earthquakes obara .
Here we show that such lowering of size distribution exponent with increased load, i.e. customers’ demands, also takes place for power outage statistics. Using the data for the outages in the U.S. between 2002-2017, we found that the size distribution of the outages between night and day times, where the usage level approximately changes by 35%, are significantly different. Such changes in the exponent are also observed for smaller regions in the U.S., where it can be indicative of the relative risks of outages. Indeed there is a systematic variation of the exponent value with the load on the grid for different hours of a day and different months of a year. We are able to reproduce this feature using a minimal model both for a realistic topology of the U.S. grid and other simpler topologies. The load dependence of the size distribution exponent for outages opens a new path towards possible forecasting of large outage prone regions. For power grids, such identifications are very advantageous, as focused mitigation efforts (e.g. upgrading lines) can help in preventing large outages.
II Outages in the U.S. grid
The size distribution of the power outages in the U.S. has been studied, both in terms of the power left unserved and the number of customers affected clauset2009 ; dobson2015 ; hines09 . In fact, these quantities vary almost co-linearly, except in a few instances involving load shed affecting e.g. one customer, such as may be the case for a large industrial facility. The two metrics also show power law size distributions and are more or less equivalent in terms of the exponent values hines09 . For example, the cumulative distribution function for the number of customers affected during blackouts has been reported to follow a power law, with exponents variously estimated in the range of 0.8 - 1.3 clauset2009 ; hines09 ; dobson2015 . Similar studies for outages in Sweden hol06 , Norway bakke06 , New Zealand ancell05 and China weng06 also show scale-free size distributions of power outages. Here we show that the exponent value of such distributions depends on the load carried by the power grid, at the time of failure.
For events with a power-law size distribution, the probability of an event of size scales as . When these events are arranged in descending order of magnitude, the resulting rank-plot will follow , where is the -th largest event, and the exponent (see Methods).
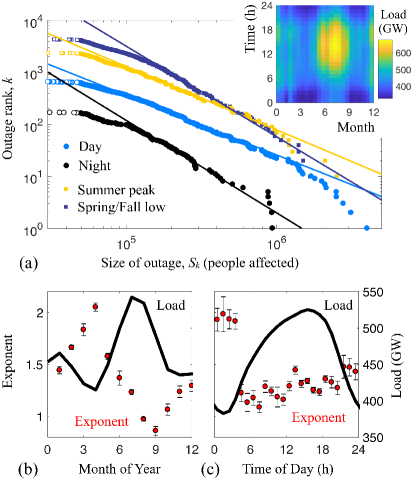
In Fig. 1(a) the rank plots, or cumulative size distributions, are given for the subsets of power outages occurring respectively during the day (08:00-20:00, local times), night (22:00-04:00), summer (July-October), or winter (October-May). These periods were chosen to correspond with the times of peak and off-peak loads, as measured in the national electricity demand during 2016, and shown in the inset to 1(a). All data are taken from the public reports of the U.S. Energy Information Administration USEIA , which lists outage events affecting more than 50,000 consumers, or resulting in a load shedding of more than 300 MW, as well as the hourly electricity demand. The outage data used covers 1193 events in the years 2002-2016.
A power law fit of the whole data set gives an exponent , consistent with previous reports clauset2009 ; dobson2015 ; hines09 . However, with a day/night division these outages split into a shallower daytime distribution with and a steeper nighttime distribution with . While it is known that there are fewer outages at night, than in the day hines09 , this result shows that those outages that do occur at night are generally also much less severe. Similarly, if the data are split seasonally, we find an exponent of in the months of peak summer usage, but an exponent of during the off-peak winter months.
To show that there is a significant relationship between the load on the grid and the exponent value of the outage size distribution, we have considered outages in rolling 3-hour time windows. Fig. 1(b) shows the variations of the exponent and the load for different hours of the day. Similarly, Fig. 1(c) shows the load and exponents for different months of the year, using a three month window. For both cases an anti-correlation between the load and the fitted exponent value can be seen. Like a variety of other driven disordered systems, including earthquakes sch05 ; scholz15 , laboratory scale fracture amitrano , and sheared granular systems riviere2017 , we find that a higher load is associated with a smaller value, and hence a more extreme distribution of events.
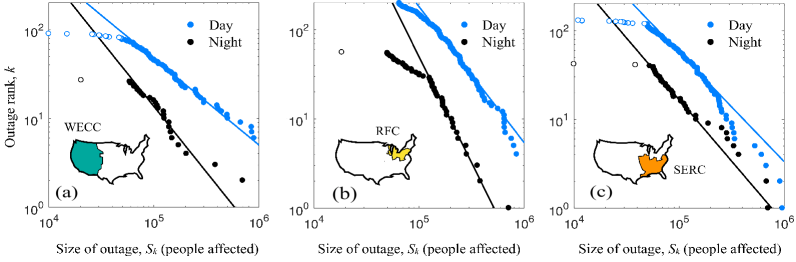
So far we have shown the temporal variation of the outage size distribution exponent over the entire data. However, to identify the vulnerable areas or dangerous hot-spots on a grid, it is important to analyze such load dependence on different spatial segments as well. The U.S. grid is divided between 10 electricity regulatory authorities map . We chose the largest three in terms of the number of events and performed the similar analysis of splitting the data between day and night and find a similar variation in the exponent values (see Fig. 2). This establishes that our method can be useful for identification of a vulnerable sub-volume of a larger grid. For that, however, one needs to calibrate the variation in exponent with risk of large outage, which requires a large volume of fine grained data. With the present data, requiring more than 50,000 people or loss of 300MW of load to get reported, such analysis is not feasible.
III Model
We now explore the load-dependence of power grids via a simple network model, with different topologies and loading conditions. There are several approaches to modeling the dynamics of a power grid, including examples of networks obeying circuit laws chen05 ; rios02 ; kirschen04 ; simonsen08 , sometimes incorporating phase information timme12 ; yang17 , as well as more abstract models demarco ; stubna03 , alongside a large volume of literature on failures in complex networks in general (see e.g. boccaletti03 ; buldyrev10 ; goh01 ; panzieri ). Here we use a model of the power grid similar to that studied in Refs. pahwa10 ; yagan1 ; yagan2 , and demonstrate how the observed U.S. outage data match generic features of the load-dependence of outage statistics.
Specifically, we consider a set of elements, or nodes, having finite failure thresholds. The elements are either arranged on a regular grid, or connected to each other by the topology given in Ref. watts98 , which simulates the Western Interconnection of the U.S. grid. The thresholds and loads of the -th element are related by
| (1) |
We assign a random load to each element, from a uniform distribution between zero and one. The second term on the right hand side provides a buffer or redundancy for the elements. This ensures that the capacity of an element is always higher than its initial load. The random variables are also chosen from a uniform distribution on . Therefore, on average, the network carries a load of , relative to its maximum capacity.
The dynamics of the model follows from randomly choosing an element and equating its threshold to its load thereby triggering a failure event. This can happen due to external causes (storm, vandalism etc.) on a grid or due to sudden surge in demand among the customers and so on. The load carried by that element now has to be redistributed among the remaining surviving elements. That may, in turn, cause some of those elements to break, triggering an avalanche. We can quite reasonably assume a separation of time scales between successive triggering events and internal redistribution of loads. Therefore, during an avalanche the total load remains constant and the only dynamics is the redistribution of loads in successive steps following a breakdown. An avalanche is then the number of elements breaking until a stable configuration is reached. After an avalanche, all the elements are again restored with another random threshold and load chosen from the same distributions. This allows an average over disorder in the system. Clearly, the value of will determine the relative stress on an element with respect to its carrying capacity. Higher the , lower is the relative stress.
It is important to note, however, that due to the long-range nature of the correlation developed in the system, a failure somewhere in the grid can trigger an avalanche or cascade failure at a different location. Specific examples of such events include the August 10, 1996 outage 96outage . Therefore, one version of our model is long range, taking into account the long range nature of electrical current variation, so that a local disturbance can indeed trigger a remote event. In another version, we take the exact topology watts98 of the Western Interconnection.
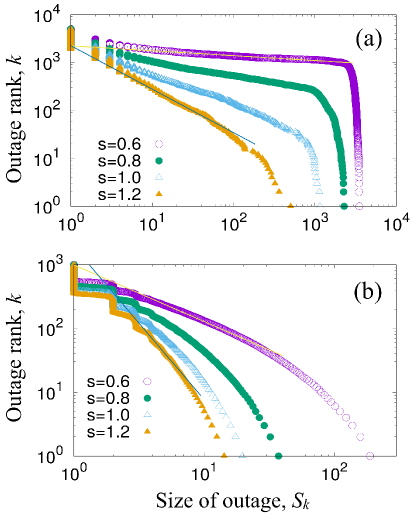
While the statistics of the avalanches can depend on the particular topology considered, the qualitative observation of lowering of the size distribution exponent (or that of the rank plot) should remain valid independent of it. To begin with, we consider the two-dimensional square lattice network. Following a local failure, the load carried by the element is redistributed to the entire remaining network. However, the load sharing depends with distance from the failure point in a power law (considering periodic boundary conditions). For the simulations here we have taken in keeping with the similar dependence of current flow in the random fuse model lucilla . The resulting avalanches are recorded over time and the above mentioned rank-plots are shown in Fig. 3 for different values of the relative stress . The exponent varies significantly within the range of studied. Particularly, for the range , the exponent value changed from . This covers the observed range () in the data for the whole country or that of its parts ().
The topology of the power grid is also an important factor in its dynamics. The characterization of the network properties is a debated issue pagani13 , with claims of small-world and scale-free properties in the topologies of power grids in various countries. Nevertheless, the qualitative feature of stress-dependence as discussed above, are not expected to change with the topology of the grid. To have a more realistic feature in our model, we have studied the model in the exact topology of the North-Eastern grid as reported in Ref. watts98 . The load sharing in this case is confined only among the connected neighbors. The resulting statistics (Fig. 4) of the outages for various values of stress still has a substantial overlap in the observed exponent values.
IV Discussion and Conclusions
The intermittent dynamics of the power grid outages and its association with self-organized criticality is known for over a decade now. Characteristic signatures, including scale-free size distribution of the outage sizes are seen for outages in different countries, for example, the U.S., Sweden, Norway, China. This connection of power grids with self-organized criticality enables comparisons of statistics of power outages with other similar systems, for example, that of earthquakes.
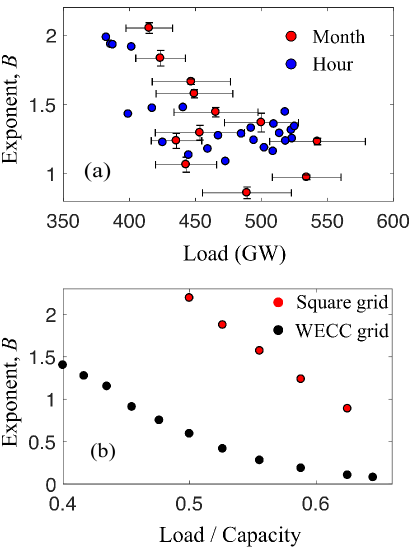
Here we show that like in earthquakes and several other driven disordered systems, for power grids as well the exponent value of the size distribution of the avalanches, which in this case is the number of customers affected in an outage, depends on the load on the system. Particularly, for higher values of the load, the magnitude of the exponent becomes smaller, indicating a relatively increased probability for outages of higher sizes. We demonstrated this anti-correlation between the load on the grid and the exponent value of the outage size distribution by analyzing the data for different months of the year and different hours of the day (Fig. 1). This property is also valid for sub-regions, for example in several Reliability Commission areas in the U.S. The scatter plot of the exponent values with the average load on the grid at the time of outage show a clear signature of the decay of the exponent value with the load (Fig. 4), which is almost linear, as in the case of earthquakes scholtz .
Given the generic nature of the anti-correlation between load and avalanche size distribution exponent, we attempted to use a toy model for power grids to explore the effect of load dependence on the outage size distribution. The model is defined as a collection of nodes, each carrying a load lower than their randomly assigned capacity, connected in certain topologies. We tested the results in a square lattice topology with distance dependent load redistribution, as well as the exact topology of the Western Interconnects (Fig. 4). Depending on the average load on the system, the model reproduces the load dependence of the avalanche size distribution as seen in the model for various topologies.
In conclusion, we have demonstrated that scale free variation of the outage size distribution in power grids depends on the load on the grid at the time of outage. The variation of the exponent, an almost linear decay of the exponent value with the load, is similar to that found in earthquake size distributions. Given sufficient resolution of the outage data, the method can be used to identify vulnerable regions of power grids, as is done for statistical predictions of earthquakes.
Methods
Data are collected from the U. S. Energy Information Administration website USEIA , over the period 2002-2016, inclusive. There are 1193 reported forced (i.e. unplanned) outages in this period affecting known, non-zero numbers of customers, which we consider. Outage times are given according to the appropriate local time zone. The load values used are for 2016, and reported nationally using the Pacific time (PT) zone as a reference USEIA . Hourly load data was taken from the 1st and 15th of every month, avoiding weekends and holidays (specifically, using January 4th/15th; May 2nd/13th; and October 3rd/14th), when load patterns would be different. Daily average loads were collected on each day throughout the year. Averages and standard deviations of the load were calculated from these data for each window of hours or months used.
For fitting the outage size distributions, we use rank plots. The events can be arranged in the descending order of their sizes:
The th ranked element has size . For events with a probability distribution , the number of events having size greater than or equal to is
| (2) |
If , one then has
| (3) |
The ranked data was fit in two ways. First, a maximum likelihood estimator (MLE) method clauset2009 was applied to measure the exponent , and an event size cutoff. Second, we applied a least-squares fit to data that were binned to have equal widths on a log-scale. For this an a priori cutoff is required. This is taken as 50,000 (the requirement for reporting) or somewhat above, when there are other signatures of under-reporting (e.g. kink at 100,000 consumers in Fig. 2(b)). Error estimates were checked by repeating fits on randomly subsampled data sets (100 trials on half-sampled data); the resulting spread in exponents is consistent with the stated fit errors. While the precise exponent values differ depending on the method of fitting used, they show same trends with load. Fits given in the manuscript are least-squares fits.
References
- (1) Data on U.S. Power outages reported monthly through https://www.eia.gov/electricity/monthly/ and data on hourly electricity demand reported through https://www.eia.gov/realtime_grid/#/summary/demand
- (2) J. Rivière, Z. Lv, P.A. Johnson, C. Maroneb, Evolution of b-value during the seismic cycle: Insights from laboratory experiments on simulated faults Earth Planetary Sci. Lett. 20, 407 (2018).
- (3) G. Andersson, P. Donalck, R. Farmer, N. Hatziargyriou, I. Kamwa, P. Kundur, N. Martins, J. Paserba, P. Pourbeik, J. Sanchez-Gasca, R. Schulz, A. Stankovic, C. Taylor, V. Vittal, Causes of the 2003 Major Grid Blackouts in North America and Europe, and Recommended Means to Improve System Dynamic Performance, IEEE Trans. Power Syst. 20, 1922 (2005).
- (4) P. Pourbeik, P. S. Kundur, C. W. Taylor, The anatomy of a power grid blackout - Root causes and dynamics of recent major blackouts, IEEE Power and Energy Magazine 4, 22 (2006).
- (5) B. A. Carreras, D. E. Newman, I. Dobson, North American Blackout Time Series Statistics and Implications for Blackout Risk, IEEE Transactions on Power Systems 31, 4406 (2016).
- (6) D. Witthaut, M. Timme, Braess´s paradox in oscillator networks, desynchroniation and power outage, New J. Phys. 14, 083036 (2012).
- (7) S. Pahwa, C. Scoglio, A. Scala, Abruptness of cascade failures in power grids, Sci. Rep. 4, 3694 (2014).
- (8) C. D. Brummitt, R. M. D’Souza, E. A. Leicht, Supressing cascades of load in interdependent networks, Proc. Nat. Acad. Sci. 109, E680 (2012).
- (9) I. Simonsen, L. Buzna, K. Peters, S. Bornholdt, D. Helbing, Transient dynamics increasing network vulnerability to cascading failures, Phys. Rev. Lett. 100, 218701 (2008).
- (10) M. Vaiman, K. Bell, Y. Chen, B. Chowdhury, I. Dobson, P. Hines, M. Papic, S. Miller, P. Zhang, Risk assessment of cascading outages: Methodologies and challenges, IEEE Trans. Power Systems 27, 631 (2012).
- (11) C. Ji, Y. Wei, H. Mei, J. Calzada, M. Carey, S. Church, T. Hayes, B. Nugent, G. Stella, M. Wallace, J. White, R. Wilcox, Large-scale data analysis of power grid resilience across multiple US service regions, Nature Energy 1, 16052 (2016).
- (12) U.S.-Canada Power System Outage Task Force (2004), Final report on the August 14, 2003 Blackout in the United States and Canada: Causes and Recommendations, available online at www.nerc.com.
- (13) S. Larsson, E. Ek, The blackout in Southern Sweden and Eastern Denmark, September 23, 2003, IEEE PES General Meeting, Denver, CO 2004, Vol.2 pp. 1668-1672.
- (14) Final Report of the Investigation Committee on the 28th September 2003 Blackout in Italy, UCTE 2004 (available online at: http:www.rae.groldcasesC13italyUCTE_rept.pdf)
- (15) J. J. Romero, Blackouts illuminate India’s power problems, IEEE SPectrum 49, 11 (2012).
- (16) B. A. Carreras, D. E. Newman, I. Dobson, Initial evidence for self-organized criticality in electric power system blackouts, in Proc. 33rd Hawai Int. Conf. System Sci., Jan. 2000.
- (17) B. A. Carreras, D. E. Newman, I. Dobson, Evidence for self-organized criticality in electric power system blackouts, IEEE Trans. Circuits Syst. I 51, 1733 (2004).
- (18) P. Bak, How nature works: the science of self.organized criticality, Springer-Verlag, New York 1996.
- (19) I. Dobson, B. A. Carreras, V.E. Lynch, D. E. Newman, Complex systems analysis of series of blackouts: Cascading failure, critical points, and self-organization, Chaos 17, 026103 (2007).
- (20) B. Gutenberg, C. F. Richter, Earthquake Magnitude, Intensity, Energy and Acceleration, Bull- Seismol. Soc. Am. 46, 105 (1956).
- (21) I. G. Main, F. Kun, A. F. Bell, Crackling Noise in Digital and Real Rocks–Implications for Forecasting Catastrophic Failure in Porous Granular Media. In: Salje E., Saxena A., Planes A. (eds) Avalanches in Functional Materials and Geophysics. Understanding Complex Systems. Springer, Cham (2017).
- (22) T. Hatano, C. Narteau, P. Shebalin, Common dependence on stress for the statistics of granular avalanches and earthquakes, Sci. Rep. 5, 12280 (2015).
- (23) C. H. Scholz, The frequency-magnitude relation of microfracturing in rock and its relation to earthquakes, Bull. Seism. Soc. Am. 58, 399 (1968).
- (24) D. Amitrano, J. R. Grasso, G. Senfaute, Seismic precursory patterns before a cliff collapse and critical point phenomena, Geophys. Res. Lett. 32, L08314 (2005).
- (25) D. Schorlemmer, S. Wiemer, M. Wyss, Variations in earthquake-size distribution across different stress regimes, Nature 437, 539 (2005).
- (26) C. H. Scholz, On the stress dependence of the earthquake b value, Geophys. Res. Lett. 42, 1399 (2015).
- (27) K. Z. Nanjo, N. Hirata, K. Obara, K. Kasahara, Decade-scale decrease in b value prior to the M9-class 2011 Tohoku and 2004 Sumatra quakes, Geophys. Res. Lett. 39, L20304 (2012).
- (28) P. Hines, J. Apt, S. Talukdar, Large blackouts in North America: Historical trends and policy implications, Energy Policy 37, 5249 (2009).
- (29) Å. Holmgren, S. Molin, Using disturbance data to assess vulnerability of electric power delivery systems, J. Infrastruct. Syst. 12, 243 (2006).
- (30) J. Ø. H. Bakke, A. Hansen, J. Kertész, Failures and avalanches in complex networks, EPL 76, 717 (2006).
- (31) G. Ancell, C. Edwards, V. Krichtal, Is a large blackout of the New Zealand power system inevitable?, Electricity Engineers Association 2005 Conference: Implementing New Zealand’s Energy Options, Aukland, New Zealand, June 2005.
- (32) X. Weng, Y. Hong, A. Xue, S. Mei, Failure analysis on China power grid based on power law, Journal of Control Theory and Applications 4, 235 (2006).
- (33) https://www.epa.gov/energy/north-american-reliability-corporation-nerc-region-representational-map
- (34) J. Chen, J. S. Thorp, I. Dobson, Cascading dynamics and mittigation assessment in power system disturbances via a hidden failure model, Int. J. Electr. Power Energy Syst. 27, 318 (2005).
- (35) M. A. Rios, D. S. Kirschen, D. Jawayeera, D. P. Nedic, R. N. Allen, Value of security: modeling time-dependent phenomena and weather conditions, IEEE Trans. Power Syst. 17, 543 (2002).
- (36) D. S. Kirschen, D. Jawayeera, D. P. Nedic, R. N. Allan, A probabilistic indicator of system stress, IEEE Trans. Power Syst. 19, 1650 (2004).
- (37) C. L. DeMarco, A phase transition model for cascading network failure, IEEE Control Syst. Mag. 21, 40 (2001).
- (38) M. D. Stubna, J. Fowler, An application of the highly optimized tolerance model to electrical blackouts, Int. J. Bifurcation Chaos Appl. Sci. Eng. 13, 237 (2003).
- (39) S. Boccaletti, V. Latora, Y. Moreno, M. Chavez, D. -U. Hwanga, Complex networks: structure and dynamics, Phys. Rep. 424, 175 (2006).
- (40) S. Buldyrev, R. Parshani, G. Paul, H. E. Stanley, S. Havlin, Catastrophic cascade of failures in interdependent networks, Nature 464, 1025 (2010).
- (41) K. I. Goh, B. Kahng, D. Kim, Universal behavior of load distribution in scale-free networks, Phys. Rev. Lett. 87, 278701 (2001).
- (42) S. Panzieri, R. Setola, Failure propagation in critical interdependent infrastructure, Int. J. Crit. Infrastruct. 4, 63 (2008).
- (43) Y. Yang, T. Nishikawa, A. E. Motter, Vulnerability and Cosusceptibility determine the size of network cascades, Phys. Rev. Lett. 118, 048301 (2017).
- (44) D. N. Kosterev, C. W. Taylor, W. Mittelstadt, Model validation for the August 10, 1996 WSCC system outage, IEEE Trans. Power Syst. 14, 967 (1999).
- (45) S. Pahwa, A. Hodges, C. Scoglio, S. Wood, Topological analysis of the power grid and mittigation strategies against cascading failures, In Systems Conference, 4th Annual IEEE, 272 (2010).
- (46) O. Yagan, Robustness of power systems under a democratic-fiber-bundle-like model, Phys. Rev. E 91, 062811 (2015).
- (47) Y. Zhang, O. Yagan, Optimizing the robustness of electrical power systems against cascading failures, Sci. Rep. 6, 27625 (2016).
- (48) D. J. Watts, S. H. Strogatz, Collective dynamics of ‘small-world’ networks, Nature 393, 440 (1998).
- (49) L. de Arcangelis, S. Redner, H. J. Herrmann, A random fuse model for breaking processes, J. Physique Lett. 46, L585 (1985).
- (50) G. A. Pagani, M. Aiello, The Power Grid as a complex network: A survey, Physica A 392, 2688 (2013).
- (51) A. Clauset, C. R. Shalizi, M. E. J. Newman, Power-law Distributions in Emperical Data, SIAM Review 51, 661 (2009).