Towards Ultra Low Cobalt Cathodes: A High Fidelity Computational Phase Search of Layered Li-Ni-Mn-Co Oxides
Abstract
Layered Li(Ni,Mn,Co,)O2 (NMC) presents an intriguing ternary alloy design space for optimization as a cathode material in Li-ion batteries. In the case of NMC, however, only a select few proportions of transition metal cations have been attempted and even fewer have been adopted on a large scale. Recently, the high cost and resource limitations of Co have added a new design constraint and high Ni-containing NMC alloys have gained enormous attention despite possible performance trade-offs. Although the limited collection of NMC cathodes have been successful in providing the performance needed for many applications, specifically electric vehicles, this concern around Co requires further advancement and optimization within the NMC design space. Additionally, it is not fully understood if this material space is a disordered solid solution at room temperature and any arbitrary combination can be used or if there exist distinct transition metal orderings to which meta-stable solid solutions will decay during cycling and affect performance. Here, we present a high fidelity computational search of the ternary phase diagram with an emphasis on high-Ni, and thus low Co, containing compositional phases to understand the room temperature stability of the ordered and disordered solid solution phases. This is done through the use of density functional theory training data fed into a reduced order model Hamiltonian that accounts for effective electronic and spin interactions of neighboring transition metal atoms at various lengths in a background of fixed composition and position lithium and oxygen atoms. This model can then be solved to include finite temperature thermodynamics into a convex hull analysis to understand the regions of ordered and disordered solid solution as well the transition metal orderings within the ordered region of the phase diagram. We also provide a method to propagate the uncertainty at every level of the analysis to the final prediction of thermodynamically favorable compositional phases thus providing a quantitative measure of confidence for each prediction made. Due to the complexity of the three component system, as well as the intrinsic error of density functional theory, we argue that this propagation of uncertainty, particularly the uncertainty due to exchange-correlation functional choice is necessary to have reliable and interpretable results. We find that for the majority of transition metal compositions of the layered material, specifically medium to high-Ni content, prefer transition metal ordering and predict the collection of preferred compositions in the ordered region.
1 Introduction
The first rechargeable Li-ion battery cathode material, layered LiCoO2,1 revolutionized the world of portable electronics. The high cost and low operational capacity of this battery material was improved with the addition of Ni and Mn to create LiNixMnyCo(1-x-y)O2 (NMC). This was first successfully done by Lui et al.2 and later the most widespread phase, x=y=1/3 (NMC111) was synthesized by Ohzuku et al.3 Since then a small collection of phases have been used in various applications with some of the most promising candidates being x=0.5, y=0.3 (NMC532) 4, 5, 6, and x=0.8,y=0.1 (NMC811) 7, 8. Additionally, NMC cathode materials are now present in a majority of electric vehicle battery chemistries 9.
Many studies have explored trends of operational performance as a function of Ni, Mn, and Co content. Julien et al. demonstrated that with increasing Co content, the specific capacity increases10. Manthiram et al on the other hand demonstrated a capacity increase with increasing Ni content 11. The discrepancy between these studies can be attributed to their distinct, one-dimensional sweeps of the full two-dimensional phase space. Another consideration regarding transition metal composition is that of thermal stability. Recent work has shown that thermal stability decreases with increasing Ni content12. In this study, however, no phases were tested for Ni content between 60 and 80 and only one possible combination of Co and Mn content was used for each Ni content. Only with a full understanding of the entire compositional phase space, can trends such as these be understood and possibly broken. Additionally within all of these studies, the material space is assumed to be a disordered solid solution. While this is likely true at synthesis temperatures given the synthesizability of NMC at arbitrary compositions, this is likely not true at ambient temperatures at which the material is electrochemically cycled within a battery. In fact a tendency for ordering has been seen even for NMC materials that were rapidly quenched after synthesis 13, 14, 15, 16, 17. Additionally an influence of this ordering on aspects such as the voltage profile during cycling has also been seen 14. Thus the proper ordering of the transition metals is necessary for proper simulation of the material. Many previous computational works have provided reasonable guesses for various other phases with, however, no exploration for the stability with respect to other cation orderings at the same composition 5, 18, 19. Within this work, we also specifically attempt to address the need for new low-Co content cathode materials as Co production presents major price volatility and supply concerns in the near future. 20 Amid these concerns of material availability, the United States Department of Energy has identified the need for low-Co cathode materials as imperative for future battery technologies, setting a target of 50 of Co 21. This target however is far from realization in materials that can meet the performance needs currently satisfied by high-Co cathodes. We attempt to understand if the region of ultra low Co is a disordered solid solution where any composition can be expected to have stable transition metal orderings, or if there are preferred compositions and orderings that will emerge within low Co cathodes ultimately cause inhomogeneous electrochemical activity and cycling.
Density functional theory (DFT) alongside thermodynamic modeling has been successfully used as a method for understanding and predicting the stable phases of many binary alloys 22, 23 and battery materials 24, 25, 26. Density functional theory calculations train a computationally efficient model and with the use of statistical simulations using the model Hamiltonian, the thermodynamically stable phases with respect to composition can be predicted.
One of the largest factors in the accuracy of density functional theory calculations is the choice of the exchange correlation functional. Different exchange correlation functionals are shown to have drastically different levels of accuracy for different material classes with certain functionals performing better for certain applications 27, 28. Recently, a class of functionals known as Bayesian Error Estimation Functionals have been developed to incorporate a collection of exchange correlation functionals and therefore provide an estimate of uncertainty related to the calculation of exchange correlation energetics. Previous work has applied this uncertainty estimation to the prediction of magnetic ground states, bulk properties, and activity of catalysts 29, 30, 31, 32.
Given the complexity of the problem, it is necessary to fully understand the uncertainty from systematic errors in the DFT training data as well as random errors from the statistical nature of Monte Carlo simulations. We focus most heavily on understanding the uncertainty derived from density functional theory. Reduced order models such as cluster expansion can be fit to high accuracy given enough terms, and the statistical error of Monte Carlo can be controlled and understood given a sufficient number of sweeps in your simulation as well as repeated simulations. The systematic error in density functional theory, however, is impossible to control as there is no way to find an exchange correlation functional for an arbitrary system with arbitrary accuracy. We therefore attempt to understand the sensitivity of our results to variation of the exchange correlation functional within a systematically chosen subspace of exchange-correlation functional space. Additionally, we attempt to show that without considering uncertainty propagation, the goal of identifying promising new low-Co phases could not be done with trustable results. We do however find that for the majority of the computational phase space, the energetic difference between the ordered and disorder phase is much larger than the the uncertainty of our calculations. Ultimately, within this work, we present an extensive computational search of the ternary phase diagram of NMC cathodes to understand the compositional regions of order versus disorder, as well as the most favorable compositions in the ordered region.
2 Computational Details
In this work, we use a total of 118 density functional theory calculations for the formation energy of various NMC compositions, focusing on high Ni-content structures, to train a reduced order model in order to more efficiently evaluate the formation energy with only a minor decrease in accuracy compared to input. The reduced order model is then solved in a high fidelity search of the composition space using Monte Carlo simulations that incorporate finite temperature effects. From these simulations, the change in Gibbs free energy at 298 K from pure layered metal oxide end member states to a NMC compositions at a given composition is fed into a convex hull analysis where we are able to predict all thermodynamically stable NMC phases. Here we describe briefly each step of this process providing the full details in the Supplementary Materials.
For all of the 118 density functional calculations used as training data, the Bayesian Error Estimation Functional with van der Waals (BEEF-vdW) 33 was used to treat the exchange-correlation energy at the level of the generalized gradient approximation. Previous work has shown that systematic error related to oxide materials can be reduced if the prediction of energy differences is made with the proper reference state without the use of Hubbard U, even in the case of transition metal oxides where a U may commonly be used 34, 35. This was done by referencing the oxygen energy in the oxide to water rather than in order to match the oxidation state. This idea was further extended to show that the error in DFT predicted formation enthalpies of two similar reactions are correlated. That is the difference in formation enthalpies is constant and independent of exchange correlation function allowing the difference in these formation enthalpies to be compared accurately without the use of a Hubbard U correction 36. Again this is achieved by comparing two similar chemical environments to one another. Within this work, we therefore chose to predict and compare the formation energy of the mixed NMC phases with respect to the pure layered oxide end members and do not include the Hubbard correction within our calculations. As this reference compares oxygens in nearly identical chemical environments, we expect the errors to be reduced drastically versus the prediction of the formation energy from elements.
The BEEF-vdW functional has the ability to estimate the error of density functional theory with respect to experiment through the generation of an ensemble of energetic predictions and was chosen for this reason. The ensemble of energies is generated by feeding the electron density of a fully self consistent calculation of the empirically fit functional from BEEF-vdW to an ensemble of exchange correlation functionals. The spread of the energetic predictions has been pretuned to recreate the error of the DFT calculation with respect to the experimental data it was trained on. In this way, BEEF-vdW links the precision of the ensemble of predictions, to the accuracy of the prediction of the self consistent calculations. With this empirical error estimation, we can provide a quantification of uncertainty within each DFT calculation and propagate that uncertainty to the model parameters that are trained with respect to the DFT input. Beyond the result that the spread of energies estimates the uncertainty of the calculation, the ensemble of functionals provides a way to probe exchange-correlation space to understand the confidence of a prediction at the level of the generalized gradient approximations. This aspect can be used to ask if another exchange-correlation functional was used, would the prediction qualitatively change. The spread of the BEEF functional estimates has been been shown to bound the prediction of other general gradient approximation functionals for mechanical properties, magnetic ground states including, and reaction enthalpies for hydrocarbons 30, 29, 37, 36. As there is no way to ensure accuracy or even the estimation of accuracy, we argue this aspect of uncertainty quantification strengthens the interpretability of DFT prediction and predictions made by models trained on DFT.
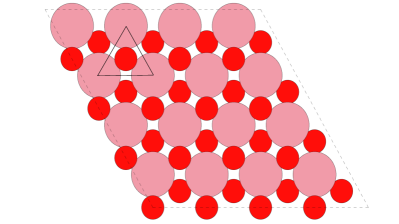
Once the DFT data is generated, a reduced order model for the formation enthalpy with respect to the layered transition metal oxide end-members is chosen. This reference is chosen as it has been shown that for Ni, Mn, and Co can all be synthesized in the layered structure 1, 38, 39. The change in volume of the lattice from pure states to the mixed state simulated by DFT is on the order of 1 and therefore the enthalpy is assumed to be the same as the energy predicted from DFT. The goal of this reduced order model is to recreate the change in enthalpy with respect to the end members of homogeneous layered lithium metal oxides, rather than the enthalpy from constituent elements. Therefore, our model focuses on the effective interactions of the changing compositions and arrangement of the transition metal ions. The energetic effects of these constant background lithium and oxygen atoms with each other and a particular cation should be largely subtracted away as these interaction are assumed to be independent of composition. Additionally, we explicitly choose to keep the composition of lithium fixed at the maximum amount of lithium stoichiometrically possible so that there are no lithium vacancies and therefore no lithium-vacancy orderings to consider. When considering our results in the context of an operational cathode, we therefore assume the transition metal orderings predicted here to be relative constant over cycling. By treating the lithium and oxygen atoms as a constant background, that is only considering them indirectly within the model, we create a model lattice containing the relevant cations and only consider the energetics and interactions related to the proportions and orderings of the transition metal ions. This type of consideration of only specific interaction terms while leaving other atoms as a constant background term has been used successfully in other cluster expansion studies of transition metal oxide materials 40, 41, 42. We assume a triangle lattice where at each site on the lattice, one of the three metal cations (Ni, Mn, Co) is present as seen in Figure 1. The model used here, as with other cluster expansion models, contains energetic terms for the species that occupies a lattice site, and N-body interactions over various length scales as well as two body spin terms over various length scales given by:
Where the indices i, j, k are sums over the lattice sites, is a sum over two body interactions, and a sum over three body interaction. Additionally, x, y, and z are sums over the three possible species (Ni,Mn,Co) and the Ji terms represent the effective energetic strength of the particular cluster interaction involving the particular elements. Similar terms can be created in this way for larger n-body interactions for any arbitrary number. For the spin interaction terms, the is the spin of the transition metal, and K is the interaction strength of the Ising like spin interaction in which the spins are assumed to be collinear.
Within the full possible model space, which includes all heterogeneous 2, 3 and 4-body terms up to 6 Å, and all 2-body spin terms within the transition metal layer up to 6 Å, we then iterate over all possible collections of interactions and train that model on the data. It should be noted that for the DFT calculation, the Co atom converged to the a very small spin. The inclusion of Co spin interaction versus ignoring Co spin interactions was explored. In order to do this as well as select which of the interactions considered gave the best reduced order model, four model selection techniques were implemented. The goal of this model selection was to determine the best model that balances predictive power with model complexity to prevent over-fitting. Figure 2 shows the results of these tests as a function of number of terms in the model.
The first method used was leave one out cross validation where the model was trained on N-1 data points and the error was computed for the remaining data point. This was done N times so that each point was left out once and the root mean square of all of the errors was computed. Additionally the Akaike information criterion (AIC) 43 defined as
the corrected Akaike information (AICc) criterion44 defined as
and the Bayesian information criterion (BIC) 45 defined as
were also used. In each of the formulas, is the number of parameters in the model, is the maximized likelihood function, and is the number of training points. We assume a Gaussian likelihood function for distribution of residual errors, , and therefore the maximum likelihood estimators for the mean, , and variance, , are the mean absolute error and the sample standard deviation given by
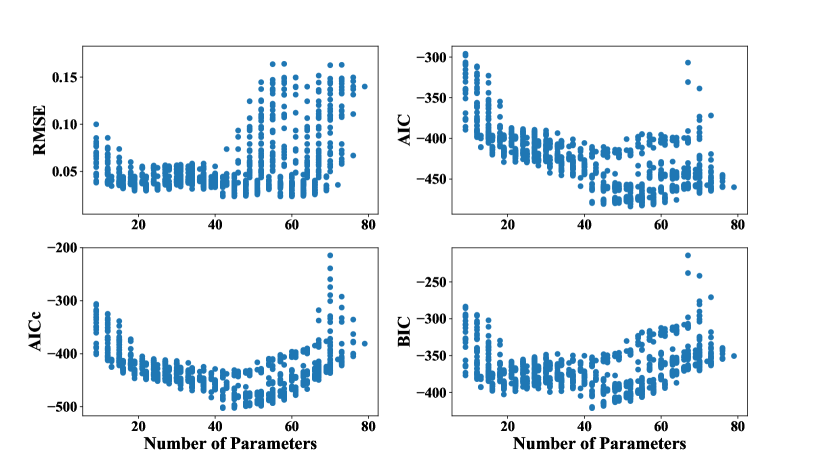
For each of these model selection techniques, the model with the lowest value of the metric is predicted to be the most ideal model. In our case, the same 42 parameter model which includes occupation, nearest neighbor spin not including Co spin, 4-body in plane, and 2-body out of plane next nearest neighbor interactions, was selected by leave one out cross validation, AICc, and BIC. The AIC selected a model that was slightly more complex than the 42 parameter model used which is a known bias of the AIC for smaller number of training points. 44 The final model gave a root mean squared error from leave one out cross validation of 5.86 meV/atom.
Metropolis Monte Carlo simulations were then performed using all supercells ranging from 5x5 to 10x10 to sample a large collection of possible compositions and ordering to ultimately find the lowest energy states. Each of these supercells also contained 3 layers in the z direction to reflect the A-B-C layer stacking structure of these layered oxide materials. In order to aid in converging the lowest energy ground state, a simulated annealing scheme starting at 1500K and stepping down to 0K at 150K steps was performed. At each temperature in this scheme, the simulation was allowed to equilibrate a total number of steps equal to 100 times the number of lattice sites in the simulation box. Once the annealing is done, the simulation is then equilibrated at room temperature and then sampled for another total number of steps equal to 100 times the number of lattice sites in the simulation box. The average energy is then reported for that composition and for the purposes of understanding the ordered solid solution phases, the configurational entropy is ignored. This is justified as once the simulation was equilibrated at room temperature, there were little to no accepted transition metal swaps during any of the thermodynamic samplings and thus we treat the ordered phases as fully ordered with respect to the placement of transition metals. There was however significant spin configurational entropy as the simulations were performed above the magnetic phase transition temperature of NMC 46. When the entropy was computed via thermodynamic integration of the heat capacity, it was within 10% of the theoretical full spin entropy. The inclusion of full spin configurational entropy however, did not change the predictions for the ordered phases and therefore entropy was not explicitly computed for the ordered phases. The possibility of a disordered arrangement of transition metals was also considered. To simulate the disordered phase, a simulation was performed where all swaps were accepted and the energy of that configuration was sampled. This was done for 5000 steps and the average energy was reported. For the disordered phase, the full configurational entropy was included in the Gibbs energy and the results are compared to the ordered phase in Figure 3. The blue region shows the range of compositions predicted to be a disordered solid solution at that temperature. It is seen, however, that most compositions at room temperature favor an ordered arrangement of transition metals, with the region of disorder growing as temperatures reach that of synthesis.
3 Results
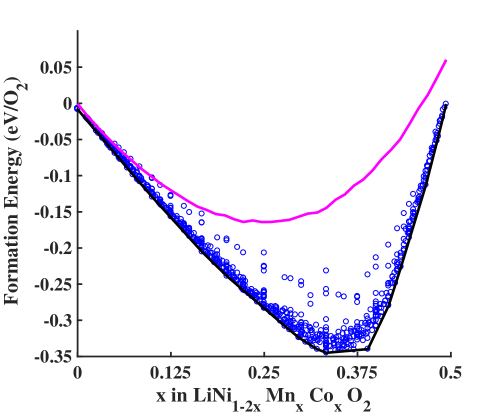
To further understand the energetic differences between the ordered and disordered phases Figure 4 looks at a one dimensional slice along the compositional range LiNi1-2xMnxCoO2. Within this range the ordered and disordered hulls were predicted for comparison. At approximately x=0.2 and above the energy difference between order and disorder is well above the errors associated with the calculations and therefore we predict with high confidence the materials with lower amounts of Ni to be ordered. In the high-Ni region, however, the energy difference is much smaller and could arguably be within error.
As most of the phases a room temperature were predicted to be ordered, we then perform a hull analysis in an attempt to find the lowest-lying ordered compositional states and determine what compositional states will appear as pure states within a battery at room temperature. To do this, the points were fed into a 3D convex hull algorithm and all points on the hull with formation energy less than or equal to 0 eV were plotted as points on a ternary phase diagram. Any composition that does not appear as a vertex of the convex hull is thus predicted to exist as a phase separated mixture of neighboring compositions that do appear as a vertex. Additionally, we simulate the stability of these phases at room temperature, the expected operational temperature, rather than elevated synthesis temperatures as states that are stable at high temperature but metastable at room temperature will likely end up in the stable state as the cathode is cycled accompanied by volume change and capacity loss. The effect of higher temperature with regard to ordered and disorder is explore in Figure 3 for a collection of elevated temperatures typical of synthesis. The effect of higher temperature increases the entropic term and therefore effectively weaken the relative strength of the short range ordering. This leads to a larger region of compositions that exist as a disordered solid solutions.
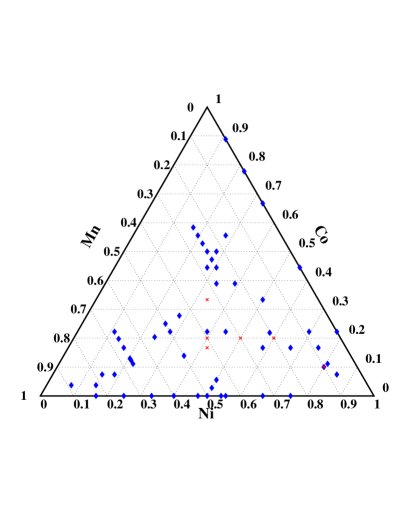
As can be seen in Figure 5, the predicted points in blue does not perfectly match the red points of experimentally used NMC phases only agreeing with a subset. Due to the sensitivity of the result on the choice of exchange correlation functional, among other sources of error, a careful treatment of uncertainty is required in order to understand if there is a reasonable prediction of new or slightly varying compositional compared to experiment.
Although density functional theory is largely accepted as a computationally viable way to calculate the energy of a system from first principles, the topic of uncertainty quantification remains an issue. Attempts have been made to understand the uncertainty by testing predictions over large data sets and trying to understand the errors in statistical or regression models 47, 48, 49. Other attempts have tried to incorporate the uncertainty into the generation of a new exchange correlation functionals 50, 51, 52, 33, 53, 54. The exchange-correlation functional used within this work, BEEF-vdW, allows for the estimation of error that has been empirically fit to experiment. As discussed above, along with a main exchange-correlation functional that is used to self consistently converge the electron density and compute the energy, BEEF-vdW carries with it an adjustable number of functionals with slight perturbations from the main functional. The spread of these functionals has been pre-tuned to recreate a non-self consistent spread of energies that matches the error of the main functionals energetic prediction with respect to experimental training data. Previous work has utilized this spread of functionals to quantify the uncertainty at the level of GGA in the prediction of magnetic states29, bulk properties30, surface Pourbaix diagrams55, 56, scaling relations in oxygen reduction57, 32, formation enthalpies of reactions 37, and the prediction efficiency of DFT derived descriptors.31.
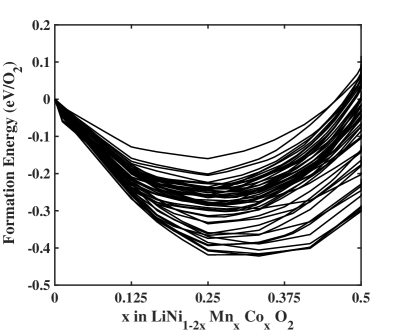
To further understand the challenge of propagating error through a hull analysis we again look at a single line within the ternary phase space. Figure 6 shows a collection of the fitted convex hulls over the compositional range of LiNi1-2xMnxCoxO2. From this Figure, it is clear that the choice of functional largely affects the final predicted hull. The collection of hulls show a variety of not only energy predictions for the formation energies, but a variety of shapes. Therefore, different functionals will predict different phases to be stable and the DFT energy predictions are uncertain enough that the results of the phase diagram will change depending on your choice of functional.
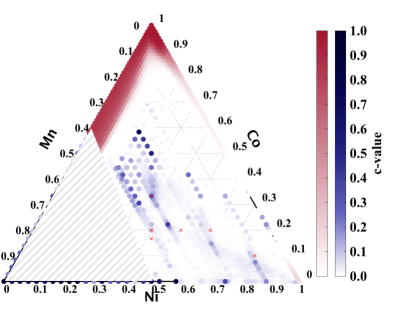
Additionally, as seen in Figure 4, we have the largest uncertainty of whether the transition metals will be ordered or disordered at the high-Ni content region of interest. We therefore repeat our whole procedure of fitting the reduced order model, performing Monte Carlo at 298K to simulate thousands of compositions for the ordered and disordered phase, and feeding the results to a convex hull analysis for a set of 2000 ensembles generated from BEEF-vdW. We then count the number of times each specific composition appears on the convex hull as an ordered phase or as a disordered phase over all of the 2000 convex hulls ultimately generated. We then plot this normalized predominance in Figure 7. This results in a collection of predicted phases near the experimentally used phases around which there is a smearing of uncertainty. We also see that with respect to exchange correlation functional, there is no uncertainty that the majority of the phases are ordered.
4 Analysis
The model used within this work assumes a fixed layered structure and hence, we limit our discussion to phases below a certain threshold Mn content. Beyond this level, the material will exhibit a layered-to-spinel structural transformation that is seen in the LiMnO2 end member. Given recent work on the structural phase diagram of the Li-Ni-Mn-Co oxide pseudo-quaternary system, we set this cutoff to be around 40 Mn content at zero Ni content and approximately 50 at zero Co content 58. We also restrict our analysis to predicted phases that have a low Co content in hops of better satisfying the materials requirement surrounding the scarcity of Co. We show in Table 1 the 20 phases with the highest c-value that contain all three cations species and satisfy the criteria of less than 40 Co and less than 40 Mn for structural stability during cycling. Notice that the c-value for the NMC 111 phase, one of the most predominate phases in literature, is 0.304. We use this as a calibration for what level of confidence within our model has a plausible chance of occurring in reality, especially in regions where you see a smearing of probabilities around a specific composition as seen with 111. We notice this spread of compositions in areas near 811, between 442 and 532, and near 622. Additionally, the absence of the NMC111 phase in the prediction from only a single exchange correlation functional in Figure 5, is one example of the importance of propagation of uncertainty in this work. Overall, we predict 29 phases that satisfy the design criteria with c-value above 0.1 which we consider to be of reasonable probability. There are 68 more phases satisfying our constraints with a c-value from 0.05 to 0.1. The full set of predicted phases, including compositions outside of our restricted design space, can be seen in Table S1 in the Supplementary Materials.
As mentioned before, the 811 phase is a promising candidate for a high Ni-content cathode yet we do not recover this with high prediction confidence (c=0.011). We do however predict the phase 22 3 2 near this composition with c=0.198 as well as a smearing of phases immediately surrounding this phase with slightly smaller prediction confidence. Other experimentally claimed phases such as 622, 532 are also not seen in those exact proportions with significant confidence. In the case of 622, the phase predicted in those specific proportions with c=0.0255, while the nearest phase to this point NMC 17 6 4, appeared in the final result with a c-value of 0.1605. Finally of note is the predicted phase of interest lies between 532 and 442, with exact proportions of 432. We also see a few phases with promise in the region of ultra low Co content. We predict a disordered solid solution for the range of for as well as an ordered phase around x=0.2. We also predict some no Co phases of the form for x=0.11,0.25,0.42 as well as recover the x=0.5 phase59.
| Ni | Mn | Co | c-value |
|
Base | ||
|---|---|---|---|---|---|---|---|
| 0.583 | 0.417 | 0.000 | 0.947 | 7 5 0 | 12 | ||
| 0.500 | 0.500 | 0.000 | 0.7315 | 1 1 0 | 2 | ||
| 0.444 | 0.333 | 0.222 | 0.3985 | 4 3 2 | 9 | ||
| 0.306 | 0.389 | 0.306 | 0.3655 | 11 14 11 | 36 | ||
| 0.750 | 0.250 | 0.000 | 0.3515 | 3 1 0 | 4 | ||
| 0.333 | 0.333 | 0.333 | 0.304 | 1 1 1 | 3 | ||
| 0.278 | 0.389 | 0.333 | 0.2745 | 5 7 6 | 18 | ||
| 0.250 | 0.389 | 0.361 | 0.2595 | 9 14 13 | 36 | ||
| 0.889 | 0.111 | 0.000 | 0.199 | 8 1 0 | 9 | ||
| 0.815 | 0.111 | 0.074 | 0.198 | 22 3 2 | 27 | ||
| 0.200 | 0.400 | 0.400 | 0.1845 | 1 2 2 | 5 | ||
| 0.778 | 0.000 | 0.222 | 0.1805 | 7 0 2 | 9 | ||
| 0.630 | 0.222 | 0.128 | 0.1605 | 17 6 4 | 27 | ||
| 0.222 | 0.389 | 0.389 | 0.1585 | 4 7 4 | 18 | ||
| 0.500 | 0.167 | 0.333 | 0.158 | 3 1 2 | 6 | ||
| 0.457 | 0.333 | 0.210 | 0.154 | 37 27 17 | 81 | ||
| 0.750 | 0.0 | 0.25 | 0.153 | 3 0 1 | 4 | ||
| 0.370 | 0.333 | 0.296 | 0.1505 | 10 9 8 | 27 | ||
| 0.346 | 0.333 | 0.321 | 0.15 | 28 27 26 | 81 | ||
| 0.583 | 0.083 | 0.333 | 0.142 | 7 1 4 | 12 |
The prediction of the exact compositions of NMC phases will allow more accurate predictions of the properties and degradation of these cathode materials. Further work using the specifically predicted phases here may allow better understanding of the tradeoffs of low Co cathodes and the limitations of the design space. While we do not present a full analysis of these phases, the work here provides a starting point to explore and understand the performance of these new phases and the possibility to achieve high performance ultra low-Co cathodes.
One of the easiest predictions that can be made once the Gibbs Free energy is known is the average voltage of the predicted NMC cathode with respect to Li/Li+ given by the Nernst Equation.
The change in Gibbs energy is given by
If we assume that the delithiated phase has the same Gibbs energy as the delithiated end members as is discussed in the Supplementary Materials, we can calculate the average voltage of LiNixMnyCozO2 as
A plot of the predicted average voltage over the entire phase can be seen in Figure 8 and a table of the predicted voltage of common NMC phases is presented in Table 2. The prediction is compared to the predictions from AutoLion-1D 60, a well benchmarked with respect to experiment model which allows for the simulation of an extremely slow discharge to better match the perfectly ideal average voltage predicted by this work. The results of this reproduces the benchmarked data to within 0.1 V for all NMC phases tested.
| Phase | AL1D (V) | Model (V) |
|---|---|---|
| 111 | 3.83 | 3.88 |
| 532 | 3.82 | 3.89 |
| 811 | 3.83 | 3.86 |
| 622 | 3.80 | 3.92 |
| 001 | 3.98 | 4.10 |
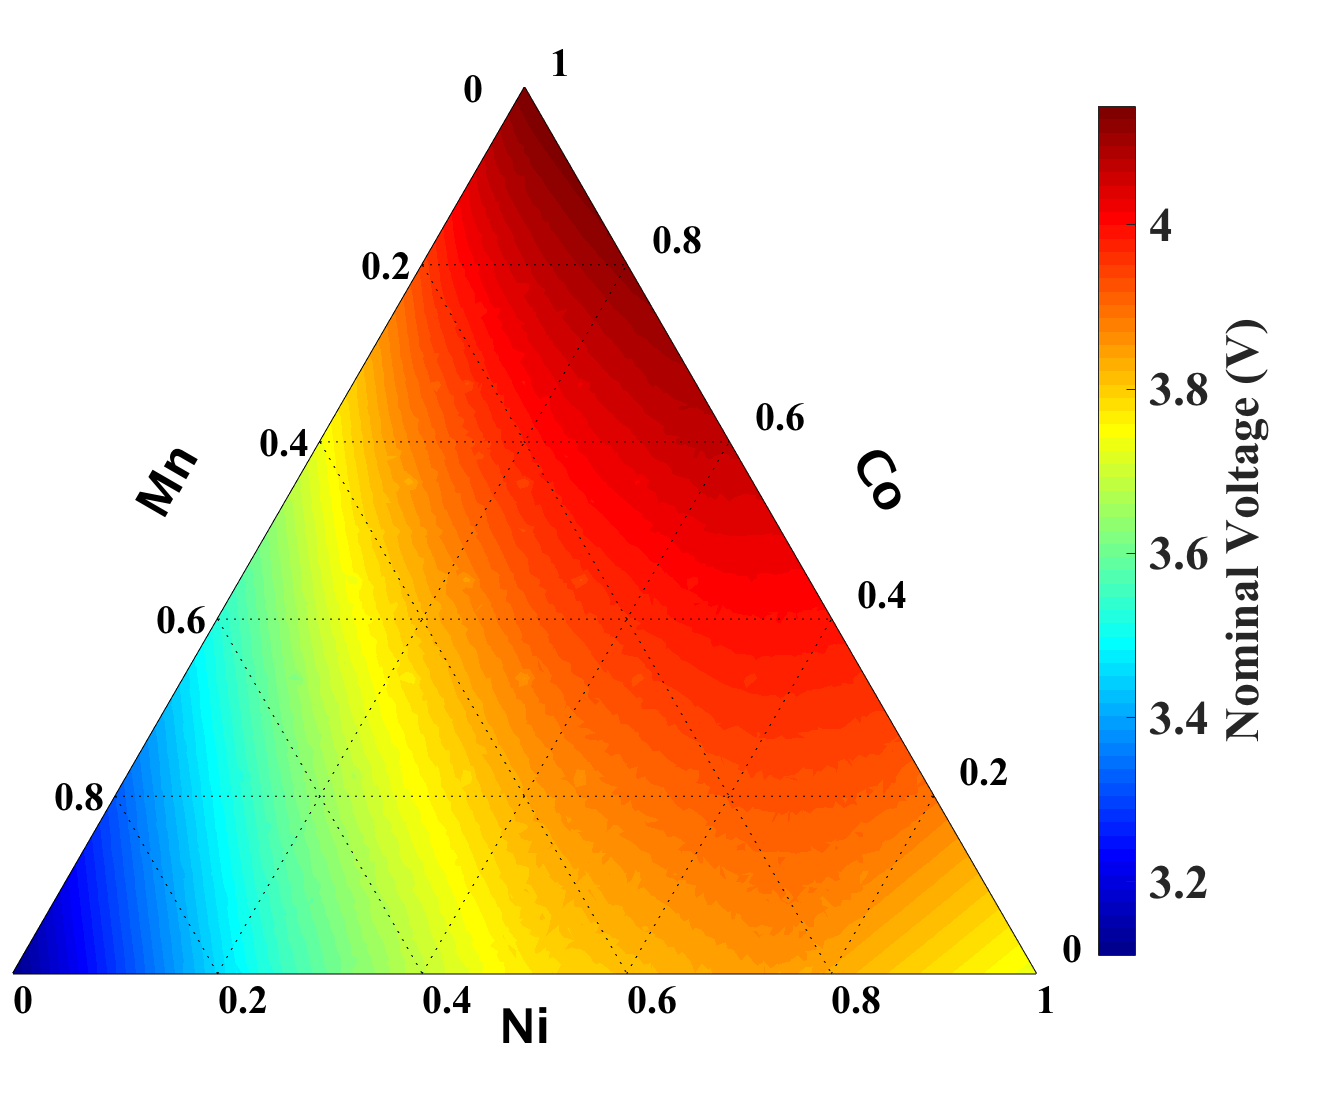
With this prediction of voltage, we see there is little variation in the predicted nominal voltage of the cathode material as a function of transition metal content. Thus there in the context of average voltage, there is no tradeoff for low or no Co cathode materials.
It is well known that layered cathode materials with high Ni content present with measurable quantities of exchange between Ni and Li 61, 62. Within our analysis here, we have assumed the Li to remain in the alkali layer and the Ni to remain in the transition metal layer. To investigate this assumption, we have computed the formation energy, , of a single defect of this kind and rough estimate of expected percent of cation mixing, at a given temperature to be
We see in Table 3 the predicted energies of these defects are rather large and predict extremely small quantities of these defects at both room temperature and even synthesis temperature as compared to some experimentally measured occurrences of this defect. We therefore assume that while this kind of defect is present in experimentally made cathodes, the largest driving force for the creation of the defects is unlikely to be thermodynamic but rather process related and the choice to ignore this effect within the main work is justified.
| Phase | (eV) | (%) | (%) | (%) 111Ref 10 |
|---|---|---|---|---|
| 111 | 0.58 | 0.69 | 1.56 | |
| 112 | 0.96 | 0.70 | ||
| 550 | 0.84 | 0.029 | 6.7 | |
| 100 | 0.50 | 0.78 |
5 Conclusion
Given the recent circumstances around the availability and cost of Co, the high-Ni layered Li(Ni,Mn,Co,)O2 phase space has received a renewed interest. Additionally, until now, no computational work involving the entire ternary phase space of NMC has investigated the thermodynamic favorability of the ordered versus disordered arrangement of transition metals within the lattice. We have presented a comprehensive exploration of this NMC phase space with the use of a reduced order model trained on DFT input and have predicted a large region of ordering despite the widespread treatment of this material as a disordered solid solution experimentally. The addition of uncertainty quantification related to the largest and least controllable source of error, the exchange correlation functional choice, leads to a more interpretability and reliable reduced order model and final prediction of compositional phases. We find that although there is large uncertainty in the specific ordered phases, there is less uncertainty with respect to exchange correlation functional for the prediction of ordering vs disorder. Additionally, for the ordered phases we see several collections of possible phases around what we believe to be the most likely phase within that region. With each of these regions near an experimentally widespread phase. From the understanding gained from uncertainty quantification of the reduced order model parameters and it’s propagation to the final convex hull analysis, we were able to have a more comprehensive list of predicted phases and assign a confidence to these predictions. A collection of promising phases exist in the high Ni content region that satisfy both the constraint of low Mn content to avoid a structural transition to spinel during operation, as well the constraint of low Co content derived from economic concerns.
This study lays out a starting point for future work in comprehensively studying these new phases both theoretically and experimentally to understand the tradeoffs of low-Co. Although we have demonstrated here a prediction of no significant decrease in operational potential, other effects such as capacity fade, open circuit voltage, thermal stability, and Li-Ni swapping are yet to be understood for these newly predicted phases. Additionally, the extension of this work to include other doping elements such as Al, and Mg may provide a larger design space to tune the properties of low-Co cathode materials and provide even more low-Co alternatives.
G. H. and V. V. acknowledge support from the Scott Institute for Energy Innovation at Carnegie Mellon and the National Science Foundation with award number CBET-1604898. G. H. would like to also thank Shashank Sripad for assistance with AL1D calculations.
References
- Mizushima et al. 1980 Mizushima, K.; Jones, P. C.; Wiseman, P. J.; Goodenough, J. B. LixCoO 2 (0<x<l): A New Cathode Material for Batteries of High Energy Density. Mat. Res. Bull 1980, 15, 783–789
- Liu et al. 1999 Liu, Z.; Yu, A.; Lee, J. Y. Synthesis and characterization of LiNi Co Mn O as the cathode materials of secondary lithium batteries. J. Power Sources 1999, 8182, 416–419
- Ohzuku and Makimura 2001 Ohzuku, T.; Makimura, Y. Layered lithium insertion material of LiCo1/3Ni1/3Mn1/3O2 for lithium-ion batteries. Chem. Mater. 2001, 30, 642–643
- Wang et al. 2003 Wang, G.; Bewlay, S.; Yao, J.; Chen, Y.; Guo, Z.; Liu, H.; Dou, S. Multiple-ion-doped lithium nickel oxides as cathode materials for lithium-ion batteries. J. Power Sources 2003, 119-121, 189 – 194
- Wu et al. 2015 Wu, Z.; Ji, S.; Zheng, J.; Hu, Z.; Xiao, S.; Wei, Y.; Zhuo, Z.; Lin, Y.; Yang, W.; Xu, K.; Amine, K.; Pan, F. Prelithiation Activates Li Ni0.5Mn0.3Co0.2 for High Capacity and Excellent Cycling Stability. Nano Lett. 2015, 5590–5596
- Li et al. 2017 Li, J.; Li, H.; Stone, W.; Weber, R.; Hy, S.; Dahn, J. R. Synthesis of Single Crystal LiNi0.5Mn0.3Co0.2O2 for Lithium Ion Batteries. J. Electrochem. Soc. 2017, 164, A3529–A3537
- Choi and Manthiram 2006 Choi, J.; Manthiram, A. Crystal chemistry and electrochemical characterization of layered LiNi0.5-yCo0.5-yMn2yO2 and LiCo0.5-yMn0.5-yNi2yO2 (0 2y1) cathodes. J. Power Sources 2006, 162, 667 – 672
- Kim et al. 2006 Kim, M.-H.; Shin, H.-S.; Shin, D.; Sun, Y.-K. Synthesis and electrochemical properties of Li[Ni0.8Co0.1Mn0.1]O2 and Li[Ni0.8Co0.2]O2 via co-precipitation. J. Power Sources 2006, 159, 1328 – 1333
- Blomgren 2017 Blomgren, G. E. The Development and Future of Lithium Ion Batteries. J. Electrochem. Soc. 2017, 164, A5019–A5025
- Julien et al. 2016 Julien, C.; Mauger, A.; Zaghib, K.; Groult, H. Optimization of Layered Cathode Materials for Lithium-Ion Batteries. Materials 2016, 9, 595
- Manthiram et al. 2016 Manthiram, A.; Knight, J. C.; Myung, S. T.; Oh, S. M.; Sun, Y. K. Nickel-Rich and Lithium-Rich Layered Oxide Cathodes: Progress and Perspectives. Adv. Energy Mater. 2016, 6, 1501010
- Bak et al. 2014 Bak, S.-M.; Hu, E.; Zhou, Y.; Yu, X.; Senanayake, S. D.; Cho, S.-J.; Kim, K.-B.; Chung, K. Y.; Yang, X.-Q.; Nam, K.-W. Structural Changes and Thermal Stability of Charged LiNixMnyCozO2 Cathode Materials Studied by Combined In Situ Time-Resolved XRD and Mass Spectroscopy. ACS Appl. Mater. Interfaces 2014, 6, 22594–22601
- Zeng et al. 2007 Zeng, D.; Cabana, J.; Bréger, J.; Yoon, W.-S.; Grey, C. P. Cation Ordering in -Layered Cathode Materials: A Nuclear Magnetic Resonance (NMR), Pair Distribution Function, X-ray Absorption Spectroscopy, and Electrochemical Study. Chem. Mater. 2007, 19, 6277–6289
- Cahill et al. 2005 Cahill, L. S.; Yin, S.-C.; Samoson, A.; Heinmaa, I.; Nazar, L. F.; Goward, G. R. 6Li NMR Studies of Cation Disorder and Transition Metal Ordering in Li[Ni1/3Mn1/3Co1/3]O2 Using Ultrafast Magic Angle Spinning. Chem. of Mater. 2005, 17, 6560–6566
- Yabuuchi et al. 2005 Yabuuchi, N.; Koyama, Y.; Nakayama, N.; Ohzuku, T. Solid-State Chemistry and Electrochemistry of LiCo1/3Ni1/3Mn1/3O2 for Advanced Lithium-Ion Batteries. J. Electrochem. Soc. 2005, 152, A1434
- Koyama et al. 2003 Koyama, Y.; Tanaka, I.; Adachi, H.; Makimura, Y.; Ohzuku, T. Crystal and electronic structures of superstructural Li1-x[Co1/3Ni1/3Mn1/3]O2 (0 x 1). J. Power Sources 2003, 119-121, 644–648
- Yoon et al. 2004 Yoon, W.-S.; Iannopollo, S.; Grey, C. P.; Carlier, D.; Gorman, J.; Reed, J.; Ceder, G. Local structure and cation ordering in O3 lithium nickel manganese oxides with stoichiometry Li [NixMn(2-x)/3Li(1-2x)/3] O2 NMR studies and first principles calculations. Electrochem. Solid-State Lett. 2004, 7, A167–A171
- Liang et al. 2017 Liang, C.; Longo, R. C.; Kong, F.; Zhang, C.; Nie, Y.; Zheng, Y.; Kim, J. S.; Jeon, S.; Choi, S. A.; Cho, K. Obstacles toward unity efficiency of LiNi1-2xCoxMnxO2 (x = 0 - 1/3) (NCM) cathode materials: Insights from ab initio calculations. J. Power Sources 2017, 340, 217–228
- Xu et al. 2017 Xu, S.; Luo, G.; Jacobs, R.; Fang, S.; Mahanthappa, M. K.; Hamers, R. J.; Morgan, D. Ab Initio Modeling of Electrolyte Molecule Ethylene Carbonate Decomposition Reaction on Li(Ni,Mn,Co)O2 Cathode Surface. ACS Appl. Mater. Interfaces 2017, 9, 20545–20553
- Olivetti et al. 2017 Olivetti, E. A.; Ceder, G.; Gaustad, G. G.; Fu, X. Lithium-Ion Battery Supply Chain Considerations: Analysis of Potential Bottlenecks in Critical Metals. Joule 2017, 1, 229–243
- Faguy 2018 Faguy, P. Next-Generation Lithium-Ion Batteries: Electrode Architecture and Cell Materials Research Projects; Report BAT337, 2018
- van de Walle and Ceder 2002 van de Walle, A.; Ceder, G. Automating first-principles phase diagram calculations. J. Phase Equilib. 2002, 23, 348
- Ruban and Abrikosov 2008 Ruban, A. V.; Abrikosov, I. A. Configurational thermodynamics of alloys from first principles: effective cluster interactions. Rep. Prog. Phys. 2008, 71, 046501
- Van der Ven and Ceder 2004 Van der Ven, A.; Ceder, G. Ordering in Lix(Ni0.5Mn)O2 and its relation to charge capacity and electrochemical behavior in rechargeable lithium batteries. Electrochem. Commun 2004, 6, 1045–1050
- Wolverton and Zunger 1998 Wolverton, C.; Zunger, A. First-principles prediction of vacancy order-disorder and intercalation battery voltages in LixCoO2. Phys. Rev. Lett. 1998, 81, 606
- Van der Ven et al. 1998 Van der Ven, A.; Aydinol, M.; Ceder, G.; Kresse, G.; Hafner, J. First-principles investigation of phase stability in LixCoO2. Phys. Rev. B 1998, 58, 2975
- Peverati and Truhlar 2014 Peverati, R.; Truhlar, D. G. Quest for a universal density functional: the accuracy of density functionals across a broad spectrum of databases in chemistry and physics. Philos. Trans. R. Soc. London, Ser. A 2014, 372, 20120476
- Mardirossian and Head-Gordon 2017 Mardirossian, N.; Head-Gordon, M. Thirty years of density functional theory in computational chemistry: an overview and extensive assessment of 200 density functionals. Mol. Phys. 2017, 115, 2315–2372
- Houchins and Viswanathan 2017 Houchins, G.; Viswanathan, V. Quantifying confidence in density functional theory predictions of magnetic ground states. Phys. Rev. B 2017, 96, 134426
- Ahmad and Viswanathan 2016 Ahmad, Z.; Viswanathan, V. Quantification of uncertainty in first-principles predicted mechanical properties of solids: Application to solid ion conductors. Phys. Rev. B 2016, 94, 064105
- Krishnamurthy et al. 2018 Krishnamurthy, D.; Sumaria, V.; Viswanathan, V. Maximal Predictability Approach for Identifying the Right Descriptors for Electrocatalytic Reactions. J. Phys. Chem. Lett. 2018, 9, 588–595
- Deshpande et al. 2016 Deshpande, S.; Kitchin, J. R.; Viswanathan, V. Quantifying Uncertainty in Activity Volcano Relationships for Oxygen Reduction Reaction. ACS Catal. 2016, 6, 5251–5259
- Wellendorff et al. 2012 Wellendorff, J.; Lundgaard, K. T.; Møgelhøj, A.; Petzold, V.; Landis, D. D.; Nørskov, J. K.; Bligaard, T.; Jacobsen, K. W. Density functionals for surface science: Exchange-correlation model development with Bayesian error estimation. Phys. Rev. B 2012, 85, 235149
- Martínez et al. 2009 Martínez, J. I.; Hansen, H. A.; Rossmeisl, J.; Nørskov, J. K. Formation energies of rutile metal dioxides using density functional theory. Phys. Rev. B 2009, 79, 045120
- Christensen et al. 2015 Christensen, R.; Hummelshøj, J. S.; Hansen, H. A.; Vegge, T. Reducing Systematic Errors in Oxide Species with Density Functional Theory Calculations. J. Phys. Chem. C 2015, 119, 17596–17601
- Christensen et al. 2016 Christensen, R.; Hansen, H. A.; Dickens, C. F.; Nørskov, J. K.; Vegge, T. Functional Independent Scaling Relation for ORR/OER Catalysts. J. Phys. Chem. C 2016, 120, 24910–24916
- Christensen et al. 2015 Christensen, R.; Hansen, H. A.; Vegge, T. Identifying systematic DFT errors in catalytic reactions. Catal. Sci. Technol. 2015, 5, 4946–4949
- Ohzuku et al. 1993 Ohzuku, T.; Ueda, A.; Nagayama, M. Electrochemistry and Structural Chemistry of LiNiO2 (R3̅m) for 4 Volt Secondary Lithium Cells. J. Electrochem. Soc. 1993, 140, 1862–1870
- Armstrong and Bruce 1996 Armstrong, A. R.; Bruce, P. G. Synthesis of layered LiMnO2 as an electrode for rechargeable lithium batteries. Nature 1996, 381, 499
- Zhou et al. 2006 Zhou, F.; Maxisch, T.; Ceder, G. Configurational Electronic Entropy and the Phase Diagram of Mixed-Valence Oxides: The Case of . Phys. Rev. Lett. 2006, 97, 155704
- Malik et al. 2009 Malik, R.; Zhou, F.; Ceder, G. Phase diagram and electrochemical properties of mixed olivines from first-principles calculations. Phys. Rev. B 2009, 79, 214201
- Lee et al. 2017 Lee, E.; Iddir, H.; Benedek, R. Rapidly convergent cluster expansion and application to lithium ion battery materials. Phys. Rev. B 2017, 95, 085134
- Akaike 1974 Akaike, H. A new look at the statistical model identification. IEEE Transactions on Automatic Control 1974, 19, 716–723
- Hurvich and Tsai 1989 Hurvich, C. M.; Tsai, C.-L. Regression and Time Series Model Selection in Small Samples. Biometrika 1989, 76, 297–307
- Schwarz 1978 Schwarz, G. Estimating the dimension of a model. Ann. Stat 1978, 6, 461–464
- Chernova et al. 2007 Chernova, N. A.; Ma, M.; Xiao, J.; Whittingham, M. S.; Breger, J.; Grey, C. P. Layered Cathodes for Lithium Ion Batteries: Understanding Local Structure via Magnetic Properties. Chem. Mater. 2007, 19, 4682–4693
- Pernot and Savin 2018 Pernot, P.; Savin, A. Probabilistic performance estimators for computational chemistry methods: The empirical cumulative distribution function of absolute errors. J. Chem. Phys. 2018, 148, 241707
- De Waele et al. 2016 De Waele, S.; Lejaeghere, K.; Sluydts, M.; Cottenier, S. Error estimates for density-functional theory predictions of surface energy and work function. Phys. Rev. B 2016, 94, 235418
- Lejaeghere et al. 2016 Lejaeghere, K.; Vanduyfhuys, L.; Verstraelen, T.; Speybroeck, V. V.; Cottenier, S. Is the error on first-principles volume predictions absolute or relative? Comput. Mater. Sci. 2016, 117, 390 – 396
- Aldegunde et al. 2016 Aldegunde, M.; Kermode, J. R.; Zabaras, N. Development of an exchange–correlation functional with uncertainty quantification capabilities for density functional theory. J. Comput. Phys. 2016, 311, 173 – 195
- Petzold et al. 2012 Petzold, V.; Bligaard, T.; Jacobsen, K. W. Construction of New Electronic Density Functionals with Error Estimation Through Fitting. Top. Catal. 2012, 55, 402–417
- Proppe et al. 2016 Proppe, J.; Husch, T.; Simm, G. N.; Reiher, M. Uncertainty quantification for quantum chemical models of complex reaction networks. Faraday Discuss. 2016, 195, 497–520
- Wellendorff et al. 2014 Wellendorff, J.; Lundgaard, K. T.; Jacobsen, K. W.; Bligaard, T. mBEEF: An accurate semi-local Bayesian error estimation density functional. J. Chem. Phys. 2014, 140, 144107
- Simm and Reiher 2016 Simm, G. N.; Reiher, M. Systematic Error Estimation for Chemical Reaction Energies. J. Chem. Theory Comput. 2016, 12, 2762–2773
- Vinogradova et al. 2018 Vinogradova, O.; Krishnamurthy, D.; Pande, V.; Viswanathan, V. Quantifying Confidence in DFT-Predicted Surface Pourbaix Diagrams of Transition-Metal Electrode–Electrolyte Interfaces. Langmuir 2018, 34, 12259–12269
- Sumaria et al. 2018 Sumaria, V.; Krishnamurthy, D.; Viswanathan, V. Quantifying Confidence in DFT Predicted Surface Pourbaix Diagrams and Associated Reaction Pathways for Chlorine Evolution. ACS Catal. 2018, 8, 9034–9042
- Yan et al. 2017 Yan, B.; Krishnamurthy, D.; Hendon, C. H.; Deshpande, S.; Surendranath, Y.; Viswanathan, V. Surface Restructuring of Nickel Sulfide Generates Optimally Coordinated Active Sites for Oxygen Reduction Catalysis. Joule 2017, 1, 600 – 612
- Brown et al. 2015 Brown, C. R.; McCalla, E.; Watson, C.; Dahn, J. R. Combinatorial study of the Li-Ni-Mn-Co oxide pseudoquaternary system for use in Li-ion battery materials research. ACS Comb. Sci. 2015, 17, 381–391
- Arachi et al. 2005 Arachi, Y.; Kobayashi, H.; Emura, S.; Nakata, Y.; Tanaka, M.; Asai, T.; Sakaebe, H.; Tatsumi, K.; Kageyama, H. Li de-intercalation mechanism in LiNi0.5Mn0.5O2 cathode material for Li-ion batteries. Solid State Ionics 2005, 176, 895 – 903
- Kalupson et al. 2013 Kalupson, J.; Luo, G.; Shaffer, C. E. AutoLion™: A Thermally Coupled Simulation Tool for Automotive Li-Ion Batteries. SAE 2013 World Congress Exhibition. 2013
- Zhang et al. 2010 Zhang, X.; Jiang, W.; Mauger, A.; Qilu,; Gendron, F.; Julien, C. Minimization of the cation mixing in Li1+x(NMC)1-xO2 as cathode material. J. Power Sources 2010, 195, 1292 – 1301
- Chen et al. 2016 Chen, Z.; Wang, J.; Chao, D.; Baikie, T.; Bai, L.; Chen, S.; Zhao, Y.; Sum, T. C.; Lin, J.; Shen, Z. Hierarchical Porous LiNi1/3Co1/3Mn1/3O2 Nano-/Micro Spherical Cathode Material: Minimized Cation Mixing and Improved Li+ Mobility for Enhanced Electrochemical Performance. Sci. Rep. 2016, 6, 25771
See pages 1- of SI_NMC.pdf