Low-redshift Lyman continuum leaking galaxies with high [O iii]/[O ii] ratios
Abstract
We present observations with the Cosmic Origins Spectrograph onboard the Hubble Space Telescope of five star-forming galaxies at redshifts in the range 0.2993 – 0.4317 and with high emission-line flux ratios O32 = [O iii]5007/[O ii]3727 8 – 27 aiming to detect the Lyman continuum (LyC) emission. We detect LyC emission in all galaxies with the escape fractions (LyC) in a range of 2 – 72 per cent. A narrow Ly emission line with two peaks in four galaxies and with three peaks in one object is seen in medium-resolution COS spectra with a velocity separation between the peaks varying from 153 km s-1 to 345 km s-1. We find a general increase of the LyC escape fraction with increasing O32 and decreasing stellar mass , but with a large scatter of (LyC). A tight anti-correlation is found between (LyC) and making a good parameter for the indirect determination of the LyC escape fraction. We argue that one possible source driving the escape of ionizing radiation is stellar winds and radiation from hot massive stars.
keywords:
(cosmology:) dark ages, reionization, first stars — galaxies: abundances — galaxies: dwarf — galaxies: fundamental parameters — galaxies: ISM — galaxies: starburst1 Introduction
Much efforts have been made in recent years to identify the sources of the reionization of the Universe at redshifts = 5 – 10. Two competitive possible sources of ionization, active galactic nuclei (AGN) (Madau & Haardt, 2015) and low-mass star-forming galaxies (SFGs) (Ouchi et al., 2009; Wise & Chen, 2009; Mitra, Ferrara & Choudhury, 2013; Yajima, Choi & Nagamine, 2011; Bouwens et al., 2015), were proposed. While there are pro and con arguments on the role of AGN in the reionization of the Universe (e.g. Madau & Haardt, 2015; Hassan et al., 2018; Mitra, Choudhury & Ferrara, 2018; Parsa, Dunlop & McLure, 2018), their contribution remains uncertain. On the other hand, SFGs can be considered as an important source of ionization only if the escape fraction of their ionizing radiation on average is not less than 10–20 per cent (e.g. Ouchi et al., 2009; Robertson et al., 2013; Dressler et al., 2015; Robertson et al., 2015; Khaire et al., 2016).
Currently, only few reliable Lyman continuum (LyC) leakers with high escape fraction are known at high redshifts, Ion2 at (Vanzella et al., 2015; de Barros et al., 2016), Q1549-C25 at (Shapley et al., 2016), A2218-Flanking at (Bian et al., 2017), Ion3 at (Vanzella et al., 2018). The difficulty in the identification of high- LyC leakers is caused by their faintness, contamination by lower-redshift interlopers and attenuation by partially neutral intergalactic medium (IGM) (e.g., Vanzella et al., 2010, 2012; Inoue et al., 2014; Grazian et al., 2016). To overcome this difficulty it was proposed to study local compact low-mass SFGs as proxies of high- galaxies (e.g. Izotov et al., 2016a, b). Their stellar masses, metallicities and star-formation rates are similar to those of high- Lyman-alpha emitting (LAE) galaxies (Izotov et al., 2015, 2016c). A fair fraction of compact SFGs is characterised by high line ratios O32 = [O iii]5007/[O ii]3727 5 (Stasińska et al., 2015) indicating that they may contain density-bounded H ii regions and be potential LyC leakers as suggested e.g. by Jaskot & Oey (2013) and Nakajima & Ouchi (2014).
Izotov et al. (2016a, b, 2018) selected six compact SFGs at redshifts 0.3 with high O32 5 for observations with the Hubble Space Telescope (HST)/Cosmic Origins Spectrograph (COS). They showed that all six galaxies are LyC leakers with (LyC) ranging between 6 and 46 per cent. These values are much higher than (LyC) of 0 – 4.5 per cent derived e.g. by Borthakur et al. (2014) and Chisholm et al. (2017) in SFGs with lower O32 or with lower equivalent widths of the H emission line (Hernandez et al., 2018).
| Name | R.A.(2000.0) | Dec.(2000.0) | a | b | O32 | |
|---|---|---|---|---|---|---|
| J09012119 | 09:01:45.61 | 21:19:27.78 | 0.2993 | 1562 | 925 | 8.0 |
| J10111947 | 10:11:38.28 | 19:47:20.94 | 0.3322 | 1763 | 994 | 27.1 |
| J12434646 | 12:43:00.63 | 46:46:50.40 | 0.4317 | 2401 | 1172 | 13.5 |
| J12484259 | 12:48:10.48 | 42:59:53.60 | 0.3629 | 1956 | 1053 | 11.8 |
| J12564509 | 12:56:44.15 | 45:09:17.01 | 0.3530 | 1893 | 1034 | 16.3 |
aLuminosity distance in Mpc (NED, Wright, 2006).
bAngular size distance in Mpc (NED, Wright, 2006).
| Name | SDSS | GALEX | WISE | ||||||||||
|---|---|---|---|---|---|---|---|---|---|---|---|---|---|
| FUV | NUV | ||||||||||||
| (err) | (err) | (err) | (err) | (err) | (err) | (err) | (err) | (err) | (err) | (err) | |||
| J09012119 | 22.01 | 21.54 | 20.31 | 21.94 | 20.33 | 22.06 | 22.17 | … | … | … | … | ||
| (0.16) | (0.05) | (0.03) | (0.15) | (0.12) | (0.12) | (0.14) | (…) | (…) | (…) | (…) | |||
| J10111947 | 21.71 | 21.26 | 19.82 | 21.64 | 20.52 | 22.08 | 21.31 | … | … | … | … | ||
| (0.13) | (0.05) | (0.02) | (0.11) | (0.12) | (0.50) | (0.27) | (…) | (…) | (…) | (…) | |||
| J12434646 | 21.46 | 21.48 | 21.63 | 20.33 | 21.14 | 21.31 | 21.61 | … | … | … | … | ||
| (0.11) | (0.04) | (0.07) | (0.03) | (0.22) | (0.26) | (0.24) | (…) | (…) | (…) | (…) | |||
| J12484259 | 21.55 | 21.22 | 20.94 | 21.23 | 20.65 | 21.42 | 21.16 | … | … | … | … | ||
| (0.13) | (0.05) | (0.05) | (0.09) | (0.20) | (0.38) | (0.28) | (…) | (…) | (…) | (…) | |||
| J12564509 | 22.35 | 22.01 | 21.43 | 22.18 | 21.51 | 21.66 | 21.85 | 16.29 | 15.80 | 12.94 | … | ||
| (0.18) | (0.06) | (0.05) | (0.15) | (0.26) | (0.30) | (0.27) | (0.06) | (0.11) | (0.54) | (…) | |||
In this paper we present new HST/COS observations of the LyC in 5 compact SFGs with the highest O32 8 – 27 ever observed in order to detect ionizing radiation, and examine its behaviour over a wide range of O32. The properties of selected SFGs derived from observations in the optical range are presented in Section 2. The HST observations and data reduction are described in Section 3. The surface brightness profiles in the UV range are discussed in Section 4. In Section 5 we compare the HST/COS spectra with the extrapolation of the modelled SEDs to the UV range. Ly emission is considered in Section 6. The escaping Lyman continuum emission is discussed in Section 7 together with the corresponding escape fractions. In Section 8 our results are compared with the LyC escape fractions for other galaxies obtained in some recent studies. We summarize our findings in Section 9.
2 Properties of selected galaxies derived from observations in the optical range
2.1 Emission-line diagnostic diagrams
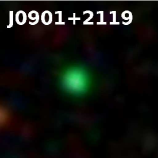
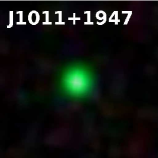
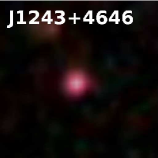
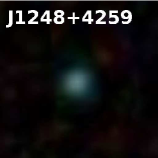
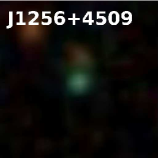
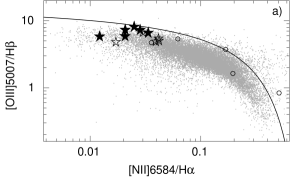
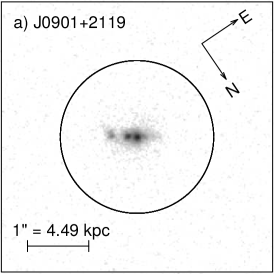
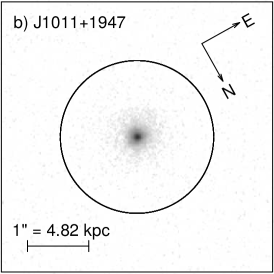
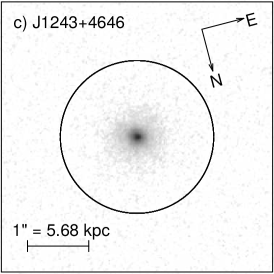
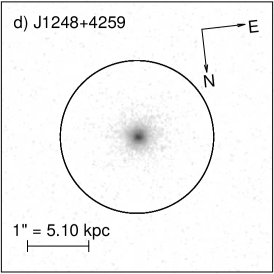
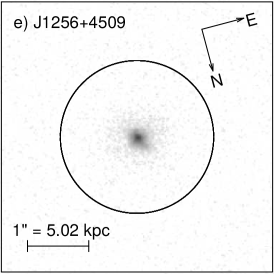
Our LyC leaker candidates were selected from the SDSS Data Release 12 (DR12) (Alam et al., 2015) by adopting the selection criteria described in Izotov et al. (2016a, b, 2018). All of them have a compact structure on SDSS images (Fig. 1) and high equivalent widths EW(H) 200 Å of the H emission line in the SDSS spectra, indicating very recent star formation. These galaxies are located in the upper part of the SFG branch in the Baldwin-Phillips-Terlevich (BPT) diagram (filled stars in Fig. 2a) implying the presence of high-excitation H ii regions. Izotov et al. (2016a, b) discussed only galaxies with O32 5 – 7. In this paper and in Izotov et al. (2018) we report observations of galaxies with the considerably larger range of O32 8 – 27 (Table 1), aiming to study the applicability of the O32 criterion to select galaxies with high escape fractions of ionizing radiation. It is seen in Fig. 2b that the selected galaxies have the highest O32 ratios among all local LyC leaking galaxies observed so far.
The SDSS, GALEX and WISE apparent magnitudes of the selected galaxies are shown in Table 2, indicating that these SFGs are among the faintest low-redshift LyC leakers that have been observed with HST.
| Galaxy | |||||||||||
| Line | J09012119 | J10111947 | J12434646 | J12484259 | J12564509 | ||||||
| a | EWb | a | EWb | a | EWb | a | EWb | a | EWb | ||
| Mg ii | 2796 | … | … | … | … | … | … | 10.82.4 | 12 | 17.24.2 | 8 |
| Mg ii | 2803 | … | … | … | … | … | … | 6.52.3 | 7 | 8.63.8 | 4 |
| O ii | 3727 | 81.54.0 | 196 | 29.72.3 | 64 | 53.74.5 | 81 | 49.43.1 | 137 | 44.34.4 | 92 |
| H12 | 3750 | … | … | … | … | … | … | 3.31.9 | 9 | 4.02.9 | 6 |
| H11 | 3771 | … | … | … | … | 5.62.8 | 13 | 5.11.9 | 13 | 6.52.9 | 9 |
| H10 | 3798 | … | … | … | … | 7.93.3 | 17 | 8.01.9 | 21 | 4.72.8 | 12 |
| H9 | 3836 | … | … | 6.22.9 | 28 | 8.93.4 | 19 | 9.41.9 | 28 | 7.13.3 | 14 |
| Ne iii | 3869 | 46.42.9 | 97 | 49.73.0 | 103 | 49.14.3 | 98 | 46.32.9 | 151 | 55.14.7 | 120 |
| H8+He i | 3889 | 13.53.2 | 33 | 14.62.8 | 34 | 20.53.8 | 38 | 20.42.2 | 87 | 19.53.4 | 41 |
| H7+Ne iii | 3969 | 21.63.4 | 52 | 31.82.9 | 96 | 39.14.1 | 80 | 33.92.6 | 124 | 33.74.0 | 69 |
| H | 4101 | 24.23.6 | 56 | 26.33.6 | 47 | 26.43.4 | 106 | 28.12.4 | 112 | 26.73.8 | 41 |
| H | 4340 | 48.04.4 | 97 | 44.53.6 | 98 | 47.24.2 | 134 | 49.62.9 | 228 | 48.24.5 | 93 |
| O iii | 4363 | 7.61.3 | 19 | 14.61.7 | 29 | 15.52.8 | 45 | 17.71.9 | 96 | 16.42.9 | 39 |
| He i | 4471 | 3.91.0 | 14 | 2.80.9 | 8 | 3.12.1 | 9 | 4.21.3 | 18 | 4.22.3 | 8 |
| H | 4861 | 100.04.9 | 255 | 100.04.8 | 237 | 100.05.7 | 221 | 100.04.0 | 426 | 100.05.9 | 253 |
| O iii | 4959 | 221.26.9 | 741 | 261.97.9 | 731 | 240.98.9 | 738 | 194.06.1 | 851 | 249.69.8 | 654 |
| O iii | 5007 | 654.626. | 1481 | 807.219. | 2304 | 725.920. | 2057 | 583.614. | 2138 | 723.321. | 1872 |
| He i | 5876 | 9.61.2 | 35 | 11.71.3 | 103 | … | … | 10.81.3 | 81 | 11.42.1 | 52 |
| O i | 6300 | 3.20.9 | 10 | 2.20.6 | 28 | … | … | 2.20.7 | 49 | … | |
| S iii | 6312 | … | … | 4.30.8 | 29 | … | … | … | … | … | … |
| H | 6563 | 288.89.0 | 831 | 283.78.9 | 1052 | 280.910. | 740 | 279.88.2 | 2561 | 280.511. | 955 |
| N ii | 6583 | 9.71.3 | 22 | 7.11.1 | 22 | 5.81.8 | 10 | 5.70.9 | 58 | 7.91.2 | 34 |
| He i | 6678 | … | … | … | … | … | … | 2.60.4 | 30 | … | … |
| S ii | 6717 | 5.50.9 | 57 | … | … | … | … | 2.60.7 | 32 | 3.81.3 | 26 |
| S ii | 6731 | 5.40.9 | 40 | … | … | … | … | 3.10.7 | 40 | 5.61.5 | 38 |
| He i | 7065 | … | … | … | … | … | … | 5.10.8 | 58 | … | … |
| Ar iii | 7136 | … | … | … | … | … | … | 3.70.7 | 72 | … | … |
| (H)intc | 0.1850.036 | 0.1350.037 | 0.0900.044 | 0.1850.035 | 0.0950.047 | ||||||
| (H)MWd | 0.038 | 0.037 | 0.017 | 0.032 | 0.027 | ||||||
| EW(H)b | 25516 | 23730 | 22110 | 42612 | 25317 | ||||||
| (H)e | 29.11.4 | 27.01.3 | 14.10.8 | 35.21.4 | 11.40.7 | ||||||
a=100()/(H) where () and (H) are flux densities of emission lines, corrected for both the Milky Way and internal
extinction.
bRest-frame equivalent width in Å.
cInternal galaxy extinction coefficient.
dMilky Way extinction coefficient.
ein 10-16 erg s-1 cm-2.
| Galaxy | J09012119 | J10111947 | J12434646 | J12484259 | J12564509 |
|---|---|---|---|---|---|
| (O iii), K | 12190780 | 14610750 | 156901350 | 188201160 | 160601410 |
| (O ii), K | 12000720 | 13770660 | 143701160 | 15460890 | 145501190 |
| (S iii), K | 12170650 | 13280620 | 143601120 | 17580970 | 147201170 |
| (S ii), cm-3 | 530600 | 100a | 100a | 11801180 | 26902690 |
| O+/H+105 | 1.670.18 | 0.350.03 | 0.560.07 | 0.460.03 | 0.570.06 |
| O2+/H+105 | 12.720.68 | 9.420.25 | 7.130.21 | 3.790.08 | 6.780.08 |
| O/H105 | 14.390.70 | 9.780.26 | 7.680.23 | 4.370.11 | 7.350.11 |
| 12+log O/H | 8.160.02 | 7.990.01 | 7.890.01 | 7.640.01 | 7.870.01 |
| N+/H+106 | 1.150.16 | 0.620.10 | 0.470.10 | 0.400.07 | 0.640.15 |
| ICF(N)b | 7.55 | 22.48 | 12.02 | 8.69 | 11.25 |
| N/H106 | 8.691.37 | 13.952.85 | 5.602.06 | 3.500.64 | 7.161.89 |
| log N/O | 1.220.07 | 0.850.09 | 1.140.16 | 1.070.12 | 1.010.12 |
| Ne2+/H+105 | 2.410.29 | 1.440.12 | 1.150.13 | 0.680.05 | 1.210.14 |
| ICF(Ne)b | 1.03 | 0.97 | 1.01 | 1.06 | 1.01 |
| Ne/H105 | 2.470.29 | 1.390.11 | 1.170.14 | 0.710.05 | 1.230.14 |
| log Ne/O | 0.750.12 | 0.850.04 | 0.820.05 | 0.790.03 | 0.780.05 |
| Mg+/H+106 | … | … | … | 0.100.02 | 0.200.05 |
| ICF(Mg)b | … | … | … | 13.73 | 21.03 |
| Mg/H106 | … | … | … | 1.390.29 | 4.171.04 |
| log Mg/O | … | … | … | 1.500.09 | 1.250.11 |
| Ar2+/H+107 | … | … | … | 1.170.24 | … |
| ICF(Ar)b | … | … | … | 1.34 | … |
| Ar/H107 | … | … | … | 1.580.95 | … |
| log Ar/O | … | … | … | 2.440.26 | … |
aAssumed value. bIonization correction factor.
2.2 Interstellar extinction and element abundances
To derive interstellar extinction and ionized gas metallicity we use the SDSS spectra of the selected galaxies. Our approach is described in detail in Izotov et al. (2016a, b, 2018). In short, we use the prescriptions by Izotov, Thuan & Lipovetsky (1994) to derive galaxy internal interstellar extinction from the observed decrements of hydrogen emission lines. Then the extinction-corrected emission lines are used to derive ionic and total element abundances following the methods described in Izotov et al. (2006) and Guseva et al. (2013).
The emission-line flux densities in the observed SDSS spectra, uncorrected for redshift, were first corrected for the Milky Way extinction with from the NASA Extragalactic Database (NED)111NASA/IPAC Extragalactic Database (NED) is operated by the Jet Propulsion Laboratory, California Institute of Technology, under contract with the National Aeronautics and Space Administration., adopting Cardelli, Clayton & Mathis (1989)’ reddening law and . Then, the flux densities of emission lines at the rest-frame wavelengths were corrected for the internal extinction of galaxies with and = 3.1, where = (H)int/1.47 (Aller, 1984).
The emission-line flux densities corrected for both the Milky Way and internal extinction, the rest-frame equivalent widths, the Milky Way ((H)MW) and internal ((H)int) extinction coefficients, and extinction-corrected H flux densities are shown in Table 3. The flux densities from Table 3 and the direct method are used to derive physical conditions (the electron temperature and electron number density) and the element abundances in the H ii regions. These quantities are shown in Table 4. The oxygen abundances are comparable to those in known low-redshift LyC leakers (Izotov et al., 2016a, b, 2018). The ratios of the neon, magnesium and argon abundances to oxygen abundance are similar to those in dwarf emission-line galaxies (e.g. Izotov et al., 2006; Guseva et al., 2013). On the other hand, the nitrogen-to-oxygen abundance ratios are somewhat elevated, similar to those in other LyC leakers at 0.3.
2.3 Luminosities and stellar masses
The emission-line luminosities and stellar masses of our galaxies were obtained adopting a luminosity distance (NED, Wright, 2006) with the cosmological parameters =67.1 km s-1Mpc-1, =0.682, =0.318 (Ade et al., 2014).
The H luminosity (H) and corresponding star-formation rates SFR were obtained from the extinction-corrected H flux densities using the relation by Kennicutt (1998) for SFR. The star-formation rate should be increased by a factor 1/[1-(LyC)], to take into account the escaping ionizing radiation which is discussed later (see Sect. 7). The SFRs corrected for escaping LyC radiation are shown in Table 5, and they are in the range of values for other LyC leakers. Their specific star formation rates sSFR = SFR/ are also similar to sSFRs for other LyC leakers (Izotov et al., 2016a, b, 2018) and are among the highest known for dwarf SFGs at any redshift (Izotov et al., 2016c).
We use SDSS spectra of our LyC leakers to fit the spectral energy distribution (SED) and to derive their stellar masses. The fitting method, using a two-component model, is described in Izotov et al. (2018). To take into account the contribution of the young stellar population we adopt a single instantaneous burst. For the older stellar population, we assume that it was formed continuously with a constant SFR. Since the H equivalent widths of our SFGs are very high, nebular continuum emission must be taken into account; it is determined from the observed H recombination line flux density and knowing the ISM temperature and density. A minimization technique was used to find the best model for the continuum. An additional requirement is that the modelled H and H equivalent widths should reproduce the observed values. Several parameters (the starburst age, the age of the older stellar population, the young-to-old stellar population mass ratio) were varied with a Monte-Carlo method to determine the best fit.
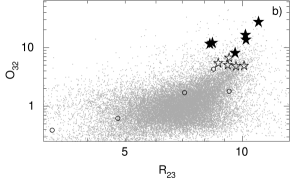
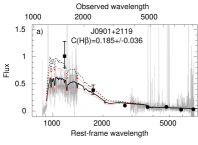
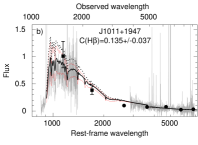
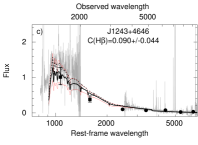
To illustrate the quality of our SED fitting we show in Fig. 3 the modelled stellar, nebular and total SEDs superposed to the rest-frame extinction-corrected SDSS spectra. For all galaxies we find very good agreement. We note the considerable contribution ( 20 – 50 per cent) of nebular emission to the total (stellar+nebular) continuum because of the very high equivalent widths of hydrogen emission lines indicating that the emission in the optical range is mostly produced by very young starbursts.
The total stellar masses (young plus old population) and starburst ages (of the young population) of our LyC leakers derived from SED fitting are presented in Table 5. They are similar to those derived for other LyC leakers (Izotov et al., 2016a, b, 2018). The mass of the young stellar population (not shown in Table 5) is typically a small fraction ( per cent) of the total stellar mass in all our sources.
| Name | a | b | log c | SB age | log (H)d | SFRe | log sSFRe | f | g | h | i |
|---|---|---|---|---|---|---|---|---|---|---|---|
| (mag) | (mag) | (log M⊙) | (Myr) | (log erg s-1) | (M⊙ yr-1) | (log yr-1) | (kpc) | (kpc) | (M⊙ yr-1kpc-2) | ||
| J09012119 | 20.02 | 19.53 | 9.8 | 2.4 | 41.93 | 20 | 8.5 | 1.51 | 0.18 | 2.7 | 192 |
| J10111947 | 20.24 | 20.07 | 9.0 | 3.4 | 42.00 | 25 | 7.6 | 1.48 | 0.15 | 4.1 | 397 |
| J12434646 | 20.49 | 20.46 | 7.8 | 2.7 | 41.99 | 80 | 5.9 | 1.75 | 0.19 | 8.4 | 719 |
| J12484259 | 20.60 | 20.32 | 8.2 | 2.5 | 42.21 | 37 | 6.6 | 1.64 | 0.22 | 4.3 | 242 |
| J12564509 | 19.95 | 19.45 | 8.8 | 2.4 | 41.69 | 18 | 7.6 | 1.72 | 0.17 | 2.0 | 202 |
aAbsolute FUV magnitude derived from the intrinsic rest-frame SED.
bAbsolute SDSS magnitude corrected for the Milky Way extinction.
c is the total stellar mass (young older population).
d(H) is the H luminosity corrected for the Milky Way and internal extinction.
eCorrected for the Milky Way and internal extinction, and escaping LyC radiation.
fExponential disc scale length.
gGalaxy radius where NUV intensity equal to half of maximal intensity.
hStar-formation rate surface density assuming galaxy radius equal to .
iStar-formation rate surface density assuming galaxy radius equal to .
| Exposure time (s) | ||||
| Name | Date | (Central wavelength (Å)) | ||
| MIRRORA | G140L | G160M | ||
| J09012119 | 2017-12-26 | 21408 | 5636 | 5636 |
| (1105) | (1623) | |||
| J10111947 | 2017-12-22 | 21408 | 5753 | 5637 |
| (1105) | (1577) | |||
| J12434646 | 2017-12-19 | 21473 | 9081 | 5897 |
| (1105) | (1611) | |||
| J12484259 | 2017-12-02 | 21451 | 5809 | 5809 |
| (1105) | (1600) | |||
| J12564509 | 2017-12-16 | 21473 | 9082 | 5896 |
| (1105) | (1600) | |||
3 HST/COS observations and data reduction
HST/COS spectroscopy of the five LyC leaker candidates was obtained in program GO 14635 (PI: Y. I. Izotov) in December 2017. The program also included J11542443, the data of which was already published (Izotov et al., 2018). The observational details are presented in Table 6. As in our previous programs (Izotov et al., 2016a, b), the galaxies were acquired by COS near ultraviolet (NUV) imaging. Since our targets are compact but faint, as based on shallow GALEX imaging, one entire orbit per object was spent for deep NUV imaging and reliable acquisition. The NUV-brightest region of each target was centered in the arcsec diameter spectroscopic aperture (Fig. 4). Although the galaxies show some structure with an extended low-surface-brightness (LSB) component and, in the case of J09012119, several star-forming knots, their sizes are smaller than the central unvignetted arcsec diameter region of the spectroscopic aperture (Fisher et al., 2018). Hence, the galaxy quantities derived from the COS spectra do not require corrections for vignetting.
The spectra were obtained at COS Lifetime Position 4 with the low-resolution grating G140L and medium-resolution grating G160M, applying all four focal-plane offset positions. One orbit of G140L observations of J10111947 failed due to a guide star re-acquisition error, shortening the total exposure to 5753 s. However, the shorter exposure was sufficient to achieve our science goals. The 1105 Å setup was used for the G140L grating (COS Lifetime Position 4: wavelength range 1110–2150 Å, resolving power at 1150 Å) to include the redshifted LyC emission for all targets. We obtained resolved spectra of the galaxies’ Ly emission lines with the G160M grating ( at 1600 Å), varying the G160M central wavelength with galaxy redshift to cover the emission line and the nearby continuum on one detector segment.
The individual exposures were reduced with the CALCOS pipeline v3.2.1, followed by accurate background subtraction and co-addition with custom software (Worseck et al., 2016). We used the same methods and extraction aperture sizes as in Izotov et al. (2018) to achieve a homogeneous reduction of the galaxy sample observed in our program. We checked the accuracy of our custom correction for scattered light in COS G140L data by comparing the LyC flux densities obtained in the total exposure and in orbital night, respectively (see below). Particularly in the LyC range of the targets the estimated relative background error of 4–10 per cent does not significantly affect our results.


4 Surface brightness distribution in the NUV range
To determine the surface brightess (SB) profiles of our galaxies we use the COS NUV acquisition images. The method uses the routine ellipse in iraf222iraf is distributed by the National Optical Astronomy Observatories, which are operated by the Association of Universities for Research in Astronomy, Inc., under cooperative agreement with the National Science Foundation./stsdas333stsdas is a product of the Space Telescope Science Institute, which is operated by AURA for NASA. and is described in detail e.g. in Izotov et al. (2018). The SB profiles (Fig. 5) are common to all LyC leakers studied thus far (this paper, Izotov et al., 2016a, b, 2018) with a sharp increase in the central part because of the presence of the bright star-forming region(s) and a linear decrease (in magnitudes) in the outer part, reminiscent of a disc structure.
The scale lengths of our galaxies defined in Eq. 1 of Izotov et al. (2016b) are in the range 1.5 – 1.8 kpc (Fig. 5), somewhat higher than = 0.6 – 1.4 kpc in other LyC leakers (Izotov et al., 2016a, b, 2018). The corresponding surface densities of star-formation rate in the studied galaxies = SFR/() are somewhat lower than in other LyC leakers, mainly because of their higher . Because of the compactness of the bright star-forming region, the half-light radii of our galaxies in the NUV are considerably smaller than (see Table 5). Adopting as a measure of the size of these galaxies, the corresponding s are typically two orders of magnitude larger, and comparable to those found for SFGs at high redshifts (Curtis-Lake et al., 2016; Paulino-Afonso et al., 2018; Bouwens et al., 2017). We note for completeness that the star-formation rate surface densities in the LyC leaking galaxy J11542443, observed in the course of the same HST GO 14635 program, are 5.1 M⊙ yr-1 kpc-2 and 150 M⊙ yr-1 kpc-2 for = 1.09 kpc and = 0.2 kpc, respectively (Izotov et al., 2018), similar to the respective values for the SFGs shown in Table 5.
5 Comparison of the HST/COS spectra with the modelled SEDs in the UV range
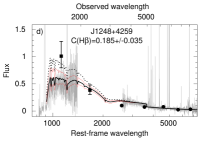
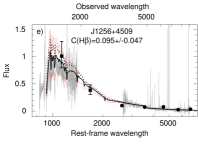
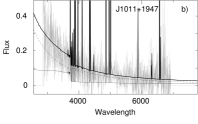
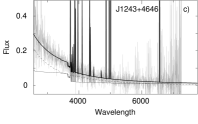
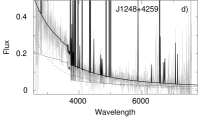
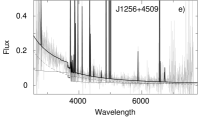
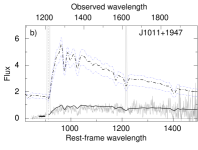
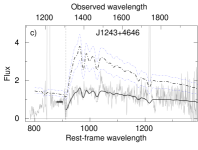
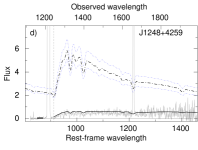
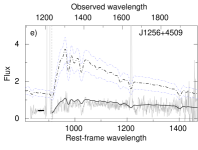
To derive the fraction of the escaping ionizing radiation, one of the two methods which we use (Izotov et al., 2018) is based on the comparison between the observed flux density in the Lyman continuum range and the intrinsic flux density produced by stellar populations in the galaxy. The latter can be obtained from SED fitting of the SDSS spectra. To verify the quality of our SED fitting, we extrapolate the reddened SEDs to the UV range and compare them with the observed COS spectra in Fig. 6. For comparison, we also show by filled symbols the GALEX FUV and NUV flux densities and the flux densities in the SDSS filters. We find that the spectroscopic and photometric data in the optical range are consistent, indicating that almost all the emission of our galaxies is inside the spectroscopic aperture. Therefore, aperture corrections are not needed. It can be noted that the GALEX FUV photometric flux densities deviate somewhat from the spectroscopic COS flux densities with the two most deviant cases being J09012119 and J12484259. The main reason for these deviations is the non-negligible contribution of the redshifted Ly emission line to the GALEX FUV band. Indeed, a Ly emission line with an equivalent width in the range 90 – 250Å (see Table 7) may contribute 20 – 50 per cent to the emission in the GALEX FUV band with an effective width of 255Å (Rodrigo, Solano & Bayo, 2013). However, even for J09012119 and J12484259 which show the highest Ly equivalent widths, the FUV photometric and spectroscopic data are consistent within 2 errors.
We show in Fig. 6 the modelled intrinsic SEDs reddened by adopting the extinction coefficients (H)MW and (H)int (Table 3) and the reddening law by Cardelli et al. (1989) with = 3.1 and = 2.4 (thick solid lines) and 3.1 (dotted lines). For = 2.4, we show by red thin solid lines the variations of the reddened SEDs produced by 1 variations of (H)int.
It is seen in Fig. 6 that the models reproduce the SDSS spectra quite well and do not depend on the adopted and variations within 1 uncertainties of (H)int. However, in the UV range there is a stronger dependence of the reddened SEDs on both and (H)int variations. The modelled SEDs reddened with = 2.4 reproduce best the COS G140L spectra, in agreement with the conclusions reached by Izotov et al. (2016a, b, 2018) for the other LyC leakers. This implies that the reddening law in the UV range is steeper in our SFGs than in the Milky Way. An exception is J12434646, for which the reddening law with = 3.1 works better, in apparent contradiction with other SFGs. However, an unusual Ly profile with three peaks (Sect. 6) and a very high (LyC) (Sect. 7) imply that the interstellar medium in J12434646 is clumpy with dust-free holes allowing for some UV continuum radiation to escape through these holes. This could mimick a flatter attenuation law (see eq. 2 in Gazagnes et al., 2018) as compared to that with = 2.4.
| Name | (Ly)MWa | b | log c | EWd | e |
|---|---|---|---|---|---|
| J09012119 | 0.210 | 106.22.3 | 42.49 | 1793.9 | 345.012.5 |
| J10111947 | 0.202 | 123.42.6 | 42.66 | 1213.1 | 276.4 5.4 |
| J12434646 | 0.092 | 180.32.8 | 43.09 | 981.9 | 143.4 4.0 |
| 163.8 5.7 | |||||
| J12484259 | 0.174 | 150.02.7 | 42.83 | 2565.2 | 283.815.9 |
| J12564509 | 0.147 | 88.42.1 | 42.58 | 863.2 | 239.410.5 |
aMilky Way extinction at the observed wavelength of the Ly emission line in mags
adopting Cardelli et al. (1989) reddening law with =3.1.
bFlux density in 10-16 erg s-1 cm-2 measured in the COS spectrum and corrected for the Milky Way extinction.
c is Ly luminosity in erg s-1 corrected for the Milky Way extinction.
dRest-frame equivalent width in Å.
eLy peak separation in km s-1.


6 Ly emission
One of the goals of our project is to search empirically for a possible correlation between the amount of escaping LyC radiation and the shape of the Ly line profile. Verhamme et al. (2017) have proposed that the presence of a double-peaked Ly profile, with a small peak separation, would be a good indicator of LyC leakage. According to the models of Verhamme et al. (2015), the peak separation decreases with decreasing column density of the neutral gas. This in turn would result in a higher escape fraction of the LyC radiation.
A strong Ly 1216 Å emission-line is detected in the medium-resolution spectra of all our galaxies (Fig. 7). In general, the profiles show two peaks, labelled by two short vertical lines. This shape is similar to that observed in known LyC leakers (Verhamme et al., 2017) and in some other galaxies (Jaskot & Oey, 2014; Henry et al., 2015; Yang et al., 2017). The Ly profile of J12434646 is more complex and consists of three peaks. Interestingly, it is quite similar to that of the = 3.999 LyC leaker Ion3 recently discovered by Vanzella et al. (2018) and of the lensed galaxy Sunburst Arc at = 2.4 (Rivera-Thorsen et al., 2017). Some parameters of Ly emission are presented in Table 7. For J12434646, two separations are given. It is seen that the separation between peaks varies in a range between 150 km s-1 and 350 km s-1 with the lowest values for J12434646 and J12564509. These are also among the lowest values found for low-redshift LyC leakers. The Ly profiles of these two galaxies indicate that they are efficient LyC leakers, similar to the galaxy J11542443 (Izotov et al., 2018). This is examined quantitatively in Sect. 7.3.
| Name | a | (LyC)MWb | c,d | (total)c,e | (shadow)c,f | (total)c,g | h | i |
|---|---|---|---|---|---|---|---|---|
| (Å) | (mag) | (per cent) | (per cent) | |||||
| J09012119 | 890-910 | 0.280 | 2.470.22 | 0.0550.013 | 0.0390.018 | 0.0670.016 | 2.70.7 | 2.10.3 |
| J10111947 | 878-898 | 0.268 | 1.650.20 | 0.1460.015 | 0.1130.023 | 0.1870.019 | 11.41.8 | 6.20.7 |
| J12434646 | 880-900 | 0.118 | 1.290.17 | 0.8740.020 | 0.9140.096 | 0.9360.021 | 72.69.7 | 72.37.2 |
| J12484259 | 850-870 | 0.235 | 2.300.15 | 0.0400.012 | 0.0330.015 | 0.0500.015 | 2.20.7 | 1.40.4 |
| J12564509 | 860-880 | 0.197 | 1.380.20 | 0.4380.019 | 0.3260.068 | 0.5250.022 | 38.05.7 | 46.05.6 |
aRest-frame wavelength range in Å used for the determination of the LyC flux density.
bMilky Way extinction at the mean observed wavelengths of the range used for the determination of the LyC flux density.
The Cardelli et al. (1989) reddening law with = 3.1 is adopted.
cin 10-16 erg s-1cm-2Å-1.
dLyC flux density derived from the modelled SED.
eObserved LyC flux density derived from the spectrum with total exposure.
fObserved LyC flux density derived from the spectrum with shadow exposure.
gObserved LyC flux density in the spectrum with total exposure which is corrected for the Milky Way extinction.
h(total)/, where is derived from SED (first method).
i(total)/, where is derived from H flux density (second method).
7 Escaping Lyman continuum radiation
7.1 Observed and intrinsic Lyman continuum flux densities
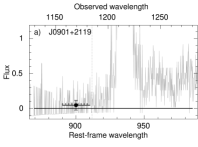
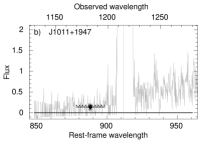
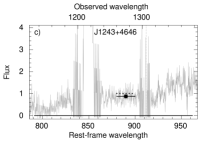
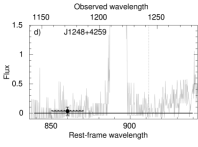
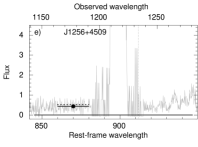
Blow-ups of the LyC spectral region are illustrated in Fig. 8 showing clearly that Lyman continuum emission is significantly detected in the spectra of all galaxies. The average flux densities are shown by filled circles with 3 statistical error bars. The short thick solid lines indicate wavelength ranges used for averaging. The observed LyC emission flux densities (total) should be corrected for the Milky Way extinction to derive the escaping flux densities (total). The extinction-corrected average LyC flux densities (total) are shown by the dotted horizontal lines in Fig. 8. The corresponding measurements are summarized in Table 8.
We also show in Table 8 the observed LyC flux densities (shadow) derived from the exposures during periods with considerably lower night sky emission. In general, (shadow) is somewhat lower than (total), implying some contribution of the geocoronal scattered light to the flux densities in observations with the total exposures. In any case both measurements are consistent within the 2 errors for all galaxies.


To derive the escape fraction of ionizing radiation in our sources we use two methods to determine the intrinsic emission in the Lyman continuum, following Izotov et al. (2016a, b, 2018). We here briefly illustrate the steps of the first method, which uses the SED fits combining the SDSS optical spectra and the COS UV spectra described above to predict the LyC radiation.
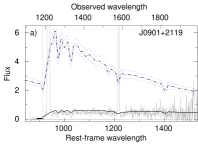
The observed G140L total-exposure spectra (grey lines) and predicted intrinsic SEDs (thick dash-dotted lines) are shown in Fig. 9, together with the reddened intrinsic SEDs (thick solid lines). The predicted SEDs are obtained from fitting optical SDSS spectra which are corrected for the Milky Way extinction at observed wavelengths, adopting (MW) from the NED and for the internal extinction at rest-frame wavelengths, the preferred UV attenuation law (i.e. discussed above), and the extinction coefficients (H)int derived from the hydrogen Balmer decrement.
The thin dash-dotted lines show the intrinsic SEDs derived by adopting extinction coefficients (H)int [(H)int] where [(H)int] are 1 errors of (H)int. It is seen that the intrinsic LyC flux density depends on the adopted extinction coefficient, being higher for higher (H)int. This is due to the fact that a higher extinction-corrected H flux density corresponds to a higher number of ionizing photons.


7.2 LyC escape fraction
To derive (LyC) Izotov et al. (2016a, b) and Izotov et al. (2018) used the ratio of the escaping flux densities to the intrinsic flux densities of the Lyman continuum:
| (1) |
where is the mean wavelength of the range used for averaging of the LyC flux density (see Table 8). They proposed two methods to derive the intrinsic flux densities . The first method is based on the SED fitting as described above. The relation between the luminosities of hydrogen recombination lines and the number of ionizing photons emitted per unit time, (Lyc), is used in the second method. The details of both methods are described by Izotov et al. (2018).
Using Eq. 1, we derive the escape fractions (LyC) by both methods accounting for the uncertainties of the observed monochromatic LyC flux densities and those of the extinction coefficients (H)int. For most of our sources the two methods give escape fractions which agree within the uncertainties. The derived (LyC) (Table 8) vary over a wide range and are very high for J12434646 and J12564509 with escape fractions of per cent and 38 per cent, respectively. These values, together with (LyC) = 46 per cent for J11542443 (Izotov et al., 2018), are among the highest known for low- and high-redshift galaxies. They are far above the average LyC escape fractions for SFGs of 10 – 20 per cent needed to fully reionize the Universe at redshifts 5.
7.3 Indicators of high (LyC)
The direct detection of LyC emission in low-redshift star-forming galaxies is a difficult task. At the moment, only HST can be used for that purpose. Although our targets are relatively bright in the UV ( close to of the high- luminosity function) and the COS G140L observations are fairly short (1 – 2 orbits), relatively few galaxies at 0.3 can be observed directly in the LyC in this manner. Therefore, reasonable indirect indicators of LyC leakage are needed to build a larger sample for statistical studies. We consider below some possible indicators.
Guseva et al. (2004), Jaskot & Oey (2013) and Nakajima & Ouchi (2014) proposed that a high O32 ratio can be an indication of density-bounded H ii regions and thus of high (LyC). At low redshifts the [O ii]3727 and [O iii]5007 emission lines are seen in the optical range. Their flux densities are available for large samples of SFGs. Now with our new LyC leakers we have in hand a sample of sixteen galaxies with a wide range of O32 0.5 – 27 (Leitet et al., 2013; Borthakur et al., 2014; Leitherer et al., 2016; Izotov et al., 2016a, b, 2018, this paper). The relation between (LyC) and O32 is presented in Fig. 10a. Although there is a trend of increasing (LyC) with increasing of O32, the spread of (LyC) at high O32 is large. Furthermore, the LyC escape fraction in the galaxy J10111947 with the highest O32 is relatively low. This is in line with the conclusions of Izotov et al. (2017) that a high O32 is a necessary but not sufficient condition for escaping ionizing radiation. The O32 ratio also depends on other parameters, such as ionization parameter, hardness of ionizing radiation and metallicity of the H ii region. The spread of galaxies in the (LyC) – O32 diagram can also be caused by their different orientations relative to the observer and by inhomogeneous LyC leakage. For example, it was demonstrated by Thuan & Izotov (1997) that the low-metallicity galaxy SBS 0335052E with a high O32 15 shows very strong Ly absorption in its UV spectrum, indicating an extremely high neutral hydrogen column density (H i) 71021 cm-2 along the line of sight, preventing leakage of LyC radiation. However, recently Herenz et al. (2017) discovered holes in the H i envelope of this galaxy probably oriented nearly perpendicularly to the line of sight, which could allow for LyC leakage in some directions.
It has also been suggested that (LyC) tends to be higher in low-mass galaxies (Wise et al., 2014; Trebitsch et al., 2017). Stellar masses are available for a large number of star-forming galaxies because observations with ground-based telescopes are sufficient for their determination. In particular, SDSS spectra can be used for that. We show in Fig. 10b the relation between (LyC) and stellar mass . It is seen that there is a tendency of increasing (LyC) with decreasing , although a large scatter is present. New observations of LyC leakers with lower log / 8.0 are needed to verify the suggested increase of (LyC) with decreasing .
The profile of the Ly emission line can also be used as an indirect indicator of the LyC leakage. This indicator is most useful because it can be applied to nearby low-mass galaxies for which direct observations of the LyC are not possible because of their low redshift. Verhamme et al. (2017) and Izotov et al. (2018) found a tight dependence of (LyC) on the separation between the peaks of the Ly emission line in LyC leakers. Adding the new LyC leakers discussed in this paper extends the relation to higher (LyC) and lower and strengthens it considerably (Fig. 10c). The regression line (solid line) to this relation is
| (2) |
where is in km s-1. We note that the relation Eq. 2 is empirical and is incorrect at very small Ly peak separations resulting in (LyC) 1 at 140 km s-1.
Both the LyC and Ly escaping radiation are determined by the column density of the neutral gas in LyC leaking galaxies (e.g. Verhamme et al., 2015, 2017) implying a tight relation between and (LyC), as it is in Fig. 10c. This relation described by Eq. 2 should constitute a strong constraint for constructing radiative transfer and kinematical models which simultaneously reproduce (LyC) and the Ly profile.
Another potential indicator is shown in Fig. 11, where we present segments of COS G140L spectra of the LyC leakers we have studied previously and in this paper, in the wavelength range 1000 – 1300Å which includes the stellar lines O vi 1035 and N v 1240 with P-Cygni profiles, indicative of stellar winds from hot massive stars (this paper, Izotov et al., 2016a, b, 2018). The spectra are shown in order of increasing (LyC). The stellar lines are very weak in spectra of galaxies with lowest (LyC) 5 per cent (Figs. 11a-c). In spectra of all other LyC leakers with higher (LyC) these lines are clearly seen, implying that, in principle, stellar lines with P-Cygni profiles from hot massive stars could also be considered as indicators of LyC leakage.
Finally, a coherent analysis of UV absorption lines (including H lines of the Lyman series and metallic lines such as Si ii ) and the UV attenuation also provide a consistent and accurate measure of the Lyman continuum escape fraction, as shown in detail by Gazagnes et al. (2018) and Chisholm et al. (2018).
Overall we conclude that the most reliable and simple empirical indicator of LyC leakage is the separation between the peaks of the Ly profile. There are, however, several problems with the use of this indicator. First, the Ly line must be resolved for the study of its profile. Additionally, for low-redshift galaxies, UV observations are needed. Finally, at redshifts corresponding to the epoch of recombination, Ly is effectively absorbed by the intergalactic neutral medium.
8 Discussion
We now briefly compare our sources with those studied in other recent papers. Hernandez et al. (2018) have observed seven star-forming galaxies with the COS spectrograph targeting also the Lyman continuum. No LyC emission is detected, translating to an absolute LyC escape fraction of per cent from the stacked (combined) spectrum, excluding thus strong LyC leakage. The galaxies were selected from the COSMOS survey as star-forming galaxies, applying a few additional selection criteria. Both the rest-frame UV (Ly) and optical emission lines of their sources are relatively weak compared to our galaxies, as measured by their equivalent widths which are quite low, EW(H) Å, compared to our median value of Å. Correspondingly, the specific star formation rate sSFR of these galaxies is fairly modest (sSFR to yr-1). Comparing these properties with those of our sources, the LyC non-detection in the galaxies of Hernandez et al. (2018) may not be surprising. Indeed, the strong LyC leakers detected so far are all characterized by their compactness, very strong emission lines and very high sSFR. These properties are also typical of those of normal star-forming galaxies, making our compact leakers good analogs of the sources of cosmic reionization, as shown by Schaerer et al. (cf. 2016), whereas the galaxies observed by Hernandez et al. (2018) are more typical of low- non-compact star-forming galaxies.
A recent study by Naidu et al. (2018) has examined Lyman continuum escape in galaxies with strong [O iii] emission lines, finding a low escape fraction of per cent and questioning the usefulness of high O32 ratios for finding strong LyC emitters. Using an overdensity at , these authors have selected 73 star-forming galaxies to search for LyC emission probed by a deep VIMOS -band image. Again, the LyC remains undetected both for the individual sources and in stacks, from which they derive a upper limit of (LyC) per cent on the relative LyC escape fraction of the total sample. They also examine “strong [O iii]” emitters, finding (LyC) per cent for this subsample of 54 sources with rest-frame EW([O iii]) Å and an estimated O. From this, Naidu et al. (2018) conclude that their result raises questions about the reliability of extreme EW([O iii]) and O32 as effective tracers of LyC escape.
A quick comparison with the properties of the galaxies studied in our work (Izotov et al., 2016a, 2018, and the present work) shows that our sources have significantly stronger emission lines (EW([O iii]) Å compared to 400 Å rest-frame) and higher O32 line ratios (extinction-corrected O compared to before extinction correction). At O we do not find any source with absolute LyC escape fractions above per cent, which is compatible with their non-detections. In short, the result of Naidu et al. (2018) does not contradict our findings and hence does not exclude that galaxies with very strong emission lines and a high ratio O32 are Lyman continuum emitters, as we found at , although there is no tight correlation between O32 and LyC escape in our sample.
Another recent study examined the LyC escape fraction of emission line-selected galaxies, finding 1 upper limits on the absolute escape fraction of per cent (Rutkowski et al., 2017), where the latter value is applicable to a subsample of 13 sources with O. As mentioned by these authors, their observations are not deep enough to detect escape fractions of per cent as measured for the majority of our sources (8 out of 11). On the other hand, the three galaxies with the highest LyC escape fractions in our sample have all fairly low stellar masses M⊙, clearly outside the mass range of the galaxies observed by Rutkowski et al. (2017), which have masses M⊙, with a median mass of M⊙. Hence their results are also compatible with our findings. For comparison, the stellar masses of the low- galaxies observed by Hernandez et al. (2018) span a fairly large range with the bulk of the sources between M⊙, as found from the catalog of Laigle et al. (2016). These results combined with our findings indicate that Lyman continuum leakage is probably more common and higher in galaxies of low mass.
From the available observations, we conclude that compact and intensely star-forming galaxies with sufficiently strong optical emission lines and a high O32 line ratio are excellent Lyman continuum leaker candidates. Furthermore, the galaxies we have studied are outliers of the galaxy population at low redshift, but their properties are fairly typical of galaxies in the early Universe (cf. Schaerer et al., 2016). It is therefore straightforward to suggest that the average Lyman continuum escape fraction of a galaxy at a given stellar mass should increase with increasing redshift, as ultimately needed to explain cosmic reionization. In addition, LyC escape could also be more frequent and/or the average escape fraction higher in low mass galaxies (107 M⊙), as suggested by numerical simulations (e.g. Wise et al., 2014; Trebitsch et al., 2017).
9 Conclusions
We present new Hubble Space Telescope (HST) Cosmic Origins Spectrograph (COS) observations of five compact star-forming galaxies (SFG) with high O32 = [O iii]5007/[O ii]3727 flux density ratios in the range 8 – 27, and in the redshift range = 0.2993 – 0.4317. We use these data to study the Ly emission and the escaping Lyman continuum (LyC) radiation of these SFGs. This study is an extension of the work reported earlier in Izotov et al. (2016a, b, 2018). Our main results are summarized as follows:
1. LyC leakage, i.e. emission of Lyman continuum radiation, is detected in all five galaxies. The highest escape fractions, (LyC) = 72 10 per cent and 38 6 per cent, are found in J12434646 and J12564509, respectively. These values are among the highest known for LyC leakers at any redshift.
2. A Ly emission line with two peaks is observed in the spectra of four galaxies, and a Ly emission line with three peaks is detected in the spectrum of J12434646, the object with the highest (LyC). A strong anti-correlation between (LyC) and the peak velocity separation of the Ly profile is found, as suggested earlier by Izotov et al. (2018).
3. We find that a high O32 ratio is a necessary but not sufficient condition for a large amount of Lyman continuum radiation escaping from SFGs. Instead, the most reliable selection criterion for LyC leakers is the peak separation of the Ly profile which is strongly anti-correlated to the LyC escape fraction (LyC), as qualitatively predicted by the radiation transfer simulations of Verhamme et al. (2015).
4. A bright compact star-forming region (with the exception of J0901+2119 which shows 2 fainter knots of star formation in addition to the main star-forming region) is seen in the COS near ultraviolet (NUV) acquisition images. The surface brightness at the outskirts can be approximated by an exponential disc, with a scale length of 1.48 – 1.75 kpc, indicating that all our LyC leakers may be dwarf disc systems.
5. Our galaxies are characterized by stellar masses 107.8 – 109.8 M⊙ and high star-formation rates in the range SFR 18 – 80 M⊙ yr-1. Their specific star formation rates are among the highest found in low-redshift LyC leakers. The metallicities of our galaxies are low, ranging from 12 + logO/H = 7.64 to 8.16.
We have discovered a class of galaxies in the local Universe which are leaking ionizing radiation, some with very high escape fractions ( 40 per cent). They share many properties of high-redshift galaxies, indicating that stars in high-redshift galaxies may have reionized the Universe. The dominance of very young ( Myr) stars in their intense star-forming events suggests that stellar winds and radiation from massive stars may be an important source driving the escape of ionizing radiation. These local galaxies are ideal laboratories for pursuing the investigation of the mechanisms responsible for the escape of ionizing radiation from galaxies.
Acknowledgements
Based on observations made with the NASA/ESA Hubble Space Telescope, obtained from the data archive at the Space Telescope Science Institute. STScI is operated by the Association of Universities for Research in Astronomy, Inc. under NASA contract NAS 5-26555. Support for this work was provided by NASA through grant number HST-GO-14635.002-A from the Space Telescope Science Institute, which is operated by AURA, Inc., under NASA contract NAS 5-26555. G.W. has been supported by the Deutsches Zentrum für Luft- und Raumfahrt (DLR) through grant number 50OR1720. I.O. acknowledges grants GACR 14-20666P and 17-06217Y of the Czech National Foundation. Funding for SDSS-III has been provided by the Alfred P. Sloan Foundation, the Participating Institutions, the National Science Foundation, and the U.S. Department of Energy Office of Science. The SDSS-III web site is http://www.sdss3.org/. SDSS-III is managed by the Astrophysical Research Consortium for the Participating Institutions of the SDSS-III Collaboration. GALEX is a NASA mission managed by the Jet Propulsion Laboratory. This research has made use of the NASA/IPAC Extragalactic Database (NED) which is operated by the Jet Propulsion Laboratory, California Institute of Technology, under contract with the National Aeronautics and Space Administration.
References
- Ade et al. (2014) Ade P. A. R. et al., 2014, A&A, 571, A16
- Alam et al. (2015) Alam S. et al., 2015, ApJS, 219, 12
- Aller (1984) Aller L. H., 1984, Physics of Thermal Gaseous Nebulae. Dordrecht: Reidel
- Baldwin et al. (1981) Baldwin J. A., Phillips M. M., Terlevich R., 1981, PASP, 93, 5
- Bian et al. (2017) Bian F., Fan X., McGreer I., Cai Z., Jiang L., 2017, ApJ, 837, 12
- Borthakur et al. (2014) Borthakur S., Heckman T. M., Leitherer C., Overzier R. A., 2014, Science, 346, 216
- Bouwens et al. (2015) Bouwens R. J., Illingworth G. D., Oesch P. A., Caruana J., Holwerda B., Smit R., Wilkins S., 2015, ApJ, 811, 140
- Bouwens et al. (2017) Bouwens R. J., Illingworth G. D., Oesch P. A., Atek H, Lam D, Stefanon M., 2017, ApJ, 843, 41
- Cardelli et al. (1989) Cardelli J. A., Clayton G. C., Mathis J. S., 1989, ApJ, 345, 245
- Chisholm et al. (2017) Chisholm J., Orlitová I., Schaerer D., Verhamme A., Worseck G., Izotov Y. I., Thuan T. X., Guseva N. G., 2017, A&A, 605, A67
- Chisholm et al. (2018) Chisholm J. et al., 2018, A&A, in press; preprint arXiv:1803.03655
- Curtis-Lake et al. (2016) Curtis-Lake E. et al., 2016, MNRAS, 457, 440
- de Barros et al. (2016) de Barros S. et al., 2016, A&A, 585, A51
- Dressler et al. (2015) Dressler A., Henry A., Martin C. L., Sawicki M., McCarthy P., Villaneuva E., 2015, ApJ, 806, 19
- Fisher et al. (2018) Fischer W. J. et al., 2018, Cosmic Origins Spectrograph Instrument Handbook, Version 10.0. Baltimore: STScI
- Gazagnes et al. (2018) Gazagnes S., Chisholm J., Schaerer D., Verhamme A., Rigby J. R., Bayliss M., 2018, A&A, in press; preprint arXiv:1802.06378
- Grazian et al. (2016) Grazian A. et al., 2016, A&A, 585, A48
- Green et al. (2012) Green J. C. et al., 2012, ApJ, 744, 60
- Grimes et al. (2009) Grimes J. P. et al., 2009, ApJ, 181, 272
- Guseva et al. (2004) Guseva N. G., Papaderos P., Izotov Y. I., Noeske K. G., Fricke K. J., 2004, A&A, 421, 519
- Guseva et al. (2013) Guseva N. G., Izotov Y. I., Fricke K. J., Henkel C., 2013, A&A, 555, A90
- Hassan et al. (2018) Hassan S., Davé R., Mitra S., Finlator K., Ciardi B., Santos M. G., 2018, MNRAS, 473, 227
- Henry et al. (2015) Henry A., Scarlata C., Martin C. S., Erb D., 2015, ApJ, 809, 19
- Herenz et al. (2017) Herenz E. C., Hayes M., Papaderos P., Cannon J. M., Bik A. Melinder J., Östlin G., 2017, A&A, 604, 99
- Hernandez et al. (2018) Hernandez S., Leitherer C., Boquien M., Buat V., Burgarella D., Calzetti D., Noll S., 2018, MNRAS, in press; preprint arXiv:1804.09721
- Inoue et al. (2014) Inoue A. K., Shimizu I., Iwata I., Tanaka M., 2014, MNRAS, 442, 1805
- Izotov et al. (1994) Izotov Y. I., Thuan T. X., Lipovetsky V. A., 1994, ApJ, 435, 647
- Izotov et al. (2006) Izotov Y. I., Stasińska G., Meynet G., Guseva N. G., Thuan T. X., 2006, A&A, 448, 955
- Izotov et al. (2015) Izotov Y. I., Guseva N. G., Fricke K. J., Henkel C., 2015, MNRAS, 451, 2251
- Izotov et al. (2016a) Izotov Y. I., Orlitová I., Schaerer D., Thuan T. X., Verhamme A., Guseva N. G., Worseck G., 2016a, Nature, 529, 178
- Izotov et al. (2016b) Izotov Y. I., Schaerer D., Thuan, T. X., Worseck G., Guseva N. G., Orlitová I., Verhamme A., 2016b, MNRAS, 461, 3683
- Izotov et al. (2016c) Izotov Y. I., Guseva N. G., Fricke K. J., Henkel C., 2016c, MNRAS, 462, 4427
- Izotov et al. (2017) Izotov Y. I., Thuan T. X., Guseva N. G., 2017, MNRAS, 471, 548
- Izotov et al. (2018) Izotov Y. I., Schaerer D., Worseck G., Guseva N. G., Thuan, T. X., Verhamme A., Orlitová I., Fricke K. J, 2018, MNRAS, 474, 4514
- Jaskot & Oey (2013) Jaskot A. E., Oey M. S., 2013, ApJ, 766, 91
- Jaskot & Oey (2014) Jaskot A. E., Oey M. S., 2014, ApJ, 791, L19
- Kauffmann et al. (2003) Kauffmann G. et al., 2003, MNRAS, 341, 33
- Kennicutt (1998) Kennicutt R. C., Jr., 1998, ARA&A, 36, 189
- Khaire et al. (2016) Khaire V., Srianand R., Choudhury T. R., Gaikwad P., 2016, MNRAS, 457, 4051
- Laigle et al. (2016) Laigle C. et al, 2016, ApJS, 224, 24
- Leitet et al. (2013) Leitet E., Bergvall N., Hayes M., Linné S., Zackrisson E., 2013, A&A, 553, A106
- Leitherer et al. (2016) Leitherer C., Hernandez S., Lee J. C., Oey M. S., 2016, ApJ, 823, L64
- Madau & Haardt (2015) Madau P., Haardt F., 2015, ApJ, 813, L8
- Mitra et al. (2013) Mitra S., Ferrara A., Choudhury T. R., 2013, MNRAS, 428, L1
- Mitra et al. (2018) Mitra S., Choudhury T. R., Ferrara A., 2018, MNRAS, 473, 1416
- Naidu et al. (2018) Naidu R. P., Forrest B., Oesch P. A., Tran K.-V. H., Holden B. P., 2018, MNRAS, in press; preprint arXiv:1804.06845
- Nakajima & Ouchi (2014) Nakajima K., Ouchi M., 2014, MNRAS, 442, 900
- Ouchi et al. (2009) Ouchi M. et al., 2009, ApJ, 706, 1136
- Parsa et al. (2018) Parsa S., Dunlop J.S., McLure R. J., 2018, MNRAS, 474, 2904
- Paulino-Afonso et al. (2018) Paulino-Afonso A. et al., 2018, MNRAS, 476, 5479
- Rivera-Thorsen et al. (2017) Rivera-Thorsen T. E. et al., 2017, A&A, 608, L4
- Robertson et al. (2013) Robertson B. E. et al., 2013, ApJ, 768, 71
- Robertson et al. (2015) Robertson B. E., Ellis R. S., Furlanetto S. R., Dunlop J. S., 2015, ApJ, 802, L19
- Rodrigo et al. (2013) Rodrigo C., Solano E., Bayo A., 2013, The SVO Filter Profile Service, http://ivoa.net/documents/Notes/SVOFPS/index.html
- Rutkowski et al. (2017) Rutkowski M. G. et al., 2017, ApJ, 841, L27
- Schaerer et al. (2016) Schaerer D., Izotov Y. I., Verhamme A., Orlitová I., Thuan T. X., Worseck G., Guseva, N. G., 2016, A&A, 591, L8
- Shapley et al. (2016) Shapley A. E., Steidel C. C., Strom A. L., Bogosavljević M., Reddy N. A., Siana B. Mostardi R. E., Rudie G. C., 2016, ApJ, 826, L24
- Stasińska et al. (2015) Stasińska G., Izotov Y., Morisset C., Guseva N., 2015, A&A, 576, A83
- Thuan & Izotov (1997) Thuan T. X., Izotov Y. I., 1997, ApJ, 477, 661
- Trebitsch et al. (2017) Trebitsch M., Blaizot J., Rosdahl J., Devriendt J., Slyz A., 2017, MNRAS, 470, 224
- Vanzella et al. (2010) Vanzella E. et al., 2010, ApJ, 725, 1011
- Vanzella et al. (2012) Vanzella E. et al., 2012, ApJ, 751, 70
- Vanzella et al. (2015) Vanzella E. et al., 2015, A&A, 576, A116
- Vanzella et al. (2018) Vanzella E. et al., 2018, MNRAS, 476, L15
- Verhamme et al. (2015) Verhamme A., Orlitová I., Schaerer D., Hayes M., 2015, A&A, 578, A7
- Verhamme et al. (2017) Verhamme A., Orlitová I., Schaerer D., Izotov Y., Worseck G., Thuan T. X., Guseva N., 2017, A&A, 597, A13
- Wise & Chen (2009) Wise J. H., Cen R., 2009, ApJ, 693, 984
- Wise et al. (2014) Wise J. H., Demchenko V. G., Halicek M. T., Norman M. L., Turk M. J., Abel T., Smith B. D., 2014, MNRAS, 442, 2560
- Worseck et al. (2016) Worseck G., Prochaska J. X., Hennawi J. F., McQuinn M., 2016, ApJ, 825, 144
- Wright (2006) Wright E. L., 2006, PASP, 118, 1711
- Yajima et al. (2011) Yajima H., Choi J.-H., Nagamine K., 2011, MNRAS, 412, 411
- Yang et al. (2017) Yang H. et al., 2017, ApJ, 844, 171