Spiral arm crossings inferred from ridges in Gaia stellar velocity distributions
Abstract
The solar neighborhood contains disc stars that have recently crossed spiral arms in the Galaxy. We propose that boundaries in local velocity distributions separate stars that have recently crossed and been more strongly perturbed by a particular arm from those that haven’t. Ridges in the stellar velocity distributions constructed from the second Gaia data release trace orbits that could have touched nearby spiral arms at apocentre or pericentre. The multiple ridges and arcs seen in local velocity distributions are consistent with the presence of multiple spiral features and different pattern speeds and imply that the outer Galaxy is flocculent rather than grand design.
keywords: galaxies: kinematics and dynamics
1 Introduction
Stars in Milky Way disc can be described in terms of their distributions in space and velocity or phase space. Perturbations on the disc can cause structures such as gaps and arcs within this space. Non-axisymmetric perturbations from spiral arms (Quillen & Minchev, 2005) or the Galactic bar can induce a gap in a local velocity distribution associated with an orbital resonance (Kalnajs, 1991; Dehnen, 1999b; Fux, 2001; Minchev et al., 2007, 2010; Monari et al., 2014; Antoja et al., 2014, 2015; Monari et al., 2017a, b; Perez-Villegas et al., 2017; Quillen et al., 2018; Hunt & Bovy, 2018). Dissection of an N-body simulation suggests that gaps in velocity distribution might be seen all over the Galaxy and are associated with transitions between different spiral patterns (Quillen et al., 2011). Hunt et al. (2017) proposed that high angular momentum stars are affected by the Perseus spiral arm which lies 2 kpc outside the Sun’s galactocentric radius (e.g., Xu et al. 2016). Perturbations on the outer disc, such as by the Sagittarius dwarf galaxy, can cause correlated radial epicyclic oscillations giving arcs in phase space (Minchev et al., 2009), clumps in velocity distributions (Quillen et al., 2009), and vertical motions that can be correlated with planar ones (Gomez et al., 2013; dela Vega et al., 2015; Quillen et al., 2018; Monari et al., 2018; Antoja et al., 2018; Laporte et al., 2018).
The second data release (DR2) (Gaia Collaboration; Brown et al., 2018) of the Gaia satellite (Gaia Collaboration; Prusti et al., 2016) provides full 6-dimensional space coordinates for approximately 7 million stars in the Galaxy: 2D positions (RA, Dec on the sky), parallaxes, proper motions (Lindegren et al., 2018), and radial line-of-sight velocities for magnitude (Gaia Collaboration; Katz et al., 2018). With the increase in numbers of stars and precision of measurement, Gaia DR2 lets us examine stellar velocity distributions, and how they vary with position in the Galaxy, in unprecedented detail. We attempt to better characterize the dynamical processes causing structure in the stellar velocity distributions.
1.1 Interpreting arcs and shells in velocity distributions
To discuss velocity distributions, we use Galactocentric polar coordinates giving velocity components . Nearby star motions are often described with a Cartesian coordinate system with velocity components . At the position of the Sun, , and , with the rotational velocity associated with the local standard of rest (LSR).
Arcs and shells are visible in the Gaia DR2 Galactic disc’s velocity distribution, and ridges are present in space-velocity diagrams (Gaia Collaboration; Katz et al., 2018; Antoja et al., 2018; Kawata et al., 2018). These features could be caused by spiral arms (Kawata et al., 2018) or phase wrapping of epicyclic motions associated with past disturbances of the Milky Way disc (Antoja et al., 2018). The substructure seen in phase space implies that the disc is not dynamically relaxed (Minchev et al., 2009; Gomez et al., 2012; Monari et al., 2018; Gaia Collaboration; Katz et al., 2018; Antoja et al., 2018). Using the sensitivity of the Coma Berenices moving group to viewed Galactic hemisphere (Quillen et al., 2018), Monari et al. (2018) estimated that the disc experienced a vertical perturbation 1.5 Gyr ago. Antoja et al. (2018) interpreted a spiral seen in vs plots of stars in the solar neighborhood as phase wrapping of a vertical perturbation that occurred between 300 and 900 Myr ago. The phase wrapping model by Minchev et al. (2009) explained arcs in the velocity distribution by weighting the phase space distribution with a function that depends on the period of epicyclic oscillations. The velocity distribution in the solar neighborhood’s has streaks separated by 10 to 20 km s-1 giving a timescale since perturbation of 2 to 4 Gyr (following Figure 1 by Minchev et al. 2009). The three timescales are not consistent and imply that additional processes, such as bar or spiral arms, affect motions in the plane.
The arcs predicted with the phase wrapping model by Minchev et al. (2009) depend only on the frequency of radial epicyclic oscillations. As the period of radial oscillations is primarily dependent on the orbital energy (Dehnen, 1999a) (), the predicted arcs resemble large circles centred about and so are symmetrical about the line. However the arcs seen in the solar neighborhood velocity distribution are tilted with respect to this line (see Figure 22 by Gaia Collaboration; Katz et al. 2018). Bar and spiral resonant models predict a tilt in the orientation of arcs in the velocity distribution (Quillen & Minchev, 2005; Minchev et al., 2010; Monari et al., 2017a, b) but only near a resonance. The tilts of so many arcs seen in the Gaia DR2 solar neighborhood velocity distribution suggest that they cannot be explained by orbital resonances alone.
Spiral arms in the Galaxy are tightly wound and separated by about 2 kpc with the Perseus arm currently about 2 kpc outside the galactocentric radius of the Sun, the Sagittarius arm about 2 kpc inside the radius of the Sun, the Local Arm about 500 pc outside the Sun’s radius (sometimes called the Orion Spur) and the Local Spur (seen at Galactic longitude ) a few hundred pc within it; following maser sources plotted in Figure 2 by Xu et al. (2016) (but also see Russeil 2003; Reid et al. 2009; Xu et al. 2013; Hou & Han 2014; Vallée 2017). In an N-body simulation of a disc exhibiting spiral structure (and without external perturbations), multiple arcs that are tilted with respect to the line are sometimes and in some places seen in local velocity distributions (Quillen et al., 2011). This motivates searching for a spiral arm related explanation for arcs or ridges in the solar neighborhood’s velocity distribution.
A star near the Sun on an eccentric orbit moves away from the solar neighborhood and can cross one of these nearby spiral arms. We consider the possibility that some of the structure seen in the local velocity distribution could be due to stars crossing nearby spiral arms. An analogy is the perihelion boundary marking possible close approaches with Neptune that is present in the distribution of semi-major axes and eccentricities of non-resonant Edgeworth-Kuiper belt objects.111http://www.scholarpedia.org/article/Kuiper_belt_dynamics A spiral arm might give a boundary in phase space, where on one side of the boundary stars never cross the arm and are only weakly perturbed by it, and on the other side, their velocities are more strongly perturbed by the arm. Bumps and wiggles in the terminal velocity curve of the Milky Way observed interior to the solar circle correspond to known spiral arm features (McGaugh, 2016). The bumps have sizes of 10–20 km s-1 (McGaugh, 2016). A star crossing a spiral arm would experience a jump in velocity about this size, implying that that spiral arms must influence the stellar velocity distribution. N-body simulations show that perturbations at apocentre are strongest from spiral structures with pattern speed approximately corotating with galactic rotation (e.g., Kawata et al. 2014).
In this manuscript we explore a possible connection between Galactic spiral structure and arcs or boundaries in the solar neighborhood’s velocity distribution. In section 2 we estimate the time and location of a star’s last pericentre or apocentre, relating recent orbital extrema to velocity vectors. For logarithmic spirals, we estimate the current location of a spiral arm that would have been touched at apocentre and pericentre. In section 2.3 we associate ridges in the solar neighborhood’s velocity distribution to possible spiral arms, and test how the locations of features in the velocity distribution depends on neighborhood position near the Sun. A summary and discussion follows in section 3.
2 Crossing spiral arms
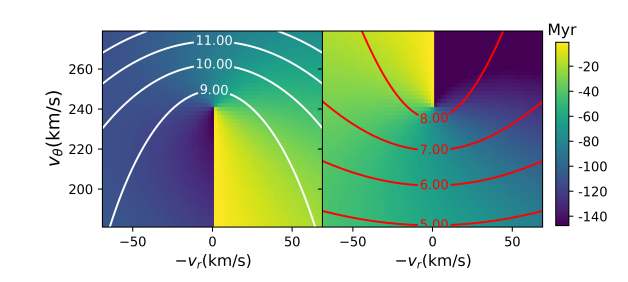
To estimate the extent of radial or epicyclic motions for stars in the solar neighborhood, we integrate orbits backwards, starting at the position of the Sun, for different current values of radial and tangential velocity components. For consistency with the Gaia Collaboration; Katz et al. (2018), we adopt local standard of rest rotational velocity km s-1, and the Sun’s galactocentric radius pc, following Reid et al. (2014) (and see the review by Bland-Hawthorn & Gerhard 2016). Orbits are restricted to the Galactic plane and integrated using a flat rotation curve with rotation velocity equal to that of the local standard of rest. The time since the last apocentre and pericentre are shown in color in Figure 1 in the left and right panels, respectively. Contours show the galactocentric radii of apocentres and pericentres and they are labelled in kpc. Figure 1 shows that stars at km s-1 could have touched the Perseus arm at apocentre. The red line labelled 7 kpc on the right panel shows stars that could graze the Sagittarius arm at pericentre. Spiral arms are not fixed. To estimate which stars could have crossed them we need to take into account their motion through the Galaxy.
In polar coordinates, we describe a logarithmic spiral arm density peak moving through the Galaxy disc with pattern speed using a function
| (1) |
The arm peak has radius at at time . We take to be the current time. The arm pitch angle is the angle between the spiral and the tangent to a centered circle of radius at point on the arm. We put the Sun at and radius . The Galaxy rotates clockwise with . A trailing arm has and . We do integrations with negative , however, we neglect their signs in our figures and table.
For each tangential velocity and radial velocity at the current time, we integrate backwards until the orbit reaches either pericentre or apocentre. Orbits are restricted to the Galactic plane. We record the time, azimuthal angle and galatocentric radius of this pericentre or apocentre. For apocentre these give and consistent with the chosen velocity vector. For winding parameter and pattern speed describing a spiral pattern, we invert equation 1 using time, , azimuthal angle, and radius, , to solve for consistent with the spiral density peak being at the apocentre location at . The radius is the radius of the spiral arm peak at the Sun’s azimuthal angle at the current time. Thus we find the offset of a spiral arm at the current time that would have been touched previously at apocentre for a star with the chosen velocity vector. We repeat the procedure, computing recent orbital pericentres and radii for spiral arms that could have been touched at a recent pericentre.
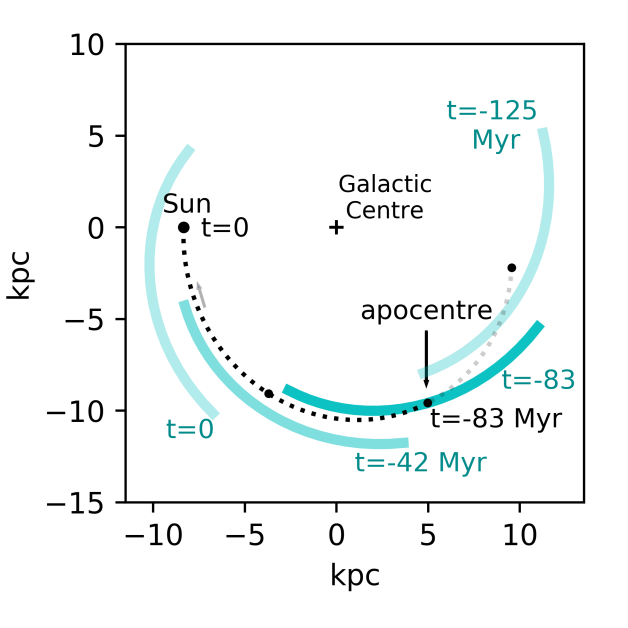
Figure 2 shows an illustration of our backwards integration estimate. A star currently in the solar neighborhood with velocity components km s-1 and km s-1 is shown as a black dot at the location of the Sun and the star’s past orbit is shown with a dotted black line. We integrate its orbit backwards finding that it reached apocentre approximately 83 Myr ago at the location of the black dot on the lower right. A spiral arm like the Perseus arm currently lies outside the radius of the Sun, however 83 Myr ago, this arm could have grazed the star’s orbit when it reached apocentre. The current and three past locations of the spiral arm are shown as thick cyan lines on the same Figure. The star only grazes the spiral arm and does not cross it. A star with a lower initial remains inside this spiral arm during the same time period.
In section 2.2 we compare curves of constant as a function of together with stellar velocity distributions. The curves in Figure 3 and 4 are curves, and the colormaps show local velocity distributions constructed from Gaia DR2 data. For the curves in Figure 3 we begin the backwards orbit integrations at the location of the Sun (galactocentric radius , azimuthal angle and ). For the curves in Figure 4 we begin the backwards orbit integrations at 4 additional positions; at kpc, , and at , . For these last two positions, the distance from the Sun along the direction of rotation is 0.4 kpc.
2.1 Gaia DR2 velocity distributions
The curves in Figures 3 and 4 are shown with Gaia DR2 velocity distributions of stars (as color images). We use stars with Gaia DR2 available radial velocities. The 3-dimensional velocity components are computed using inferred distances, Gaia DR2 positions, proper motions and line of sight radial velocities and with adopted solar peculiar velocity. For consistency with the Gaia Collaboration; Katz et al. (2018), and to compute from proper motions, distances and radial velocity, we adopt the solar peculiar motion (with respect to the local standard of rest) by Schönrich et al. (2010); km s-1.
The best way to compute distances from parallaxes giving unbiassed results is discussed in the current literature (see the review in Luri et al. 2018 or Bailer-Jones et al. 2018). We compute the stellar distances using a Bayesian scheme which takes the Gaia DR2 parallax and approximate magnitudes as input (McMillan et al., 2018b). The estimates adopt a stellar density prior (taken from Burnett & Binney 2010) and a prior on the absolute magnitude, derived from the PARSEC isochrones (Marigo et al., 2017), under reasonable assumptions of the distribution of age, mass and metallicity of stars (also see McMillan et al. 2018a). We have also computed stellar distances and extinctions with the StarHorse code (Santiago et al., 2016; Queiroz et al., 2018), using the parallaxes and magnitudes from Gaia DR2, together with 2MASS, AllWISE, and APASS photometry, as input. This code calculates the marginal distance posterior probably density function over a grid of PARSEC 1.2S stellar models (Bressan et al., 2012; Chen et al., 2014; Tang et al., 2014), under reasonable priors for the density, stellar initial mass function, and star formation rate of the main stellar components of the Milky Way (following Bland-Hawthorn & Gerhard 2016; see Queiroz et al. 2018 for details), and assuming the extinction curve by (Schlafly et al., 2016). For the nearby stars used in Figures 3 and 4, the differences in the velocity distributions using distances from StarHorse compared to those from McMillan’s code are insignificant (the differences are barely noticeable as slight pixel variations).
The velocity distributions in our figures are computed by making a histogram, counting the numbers of stars in bins that are 2 km s-1 square. The color-bar on the righthand side of the plots shows numbers of stars per velocity bin, but normalized so that the histograms integrate to 1. The stellar velocity distribution shown in Figures 3 is comprised of stars with galactocentric radius kpc and (maximum distance along the direction of rotation from the Sun is 0.2 kpc). Star distances from the Galactic plane are restricted to kpc. Because we consider only motions in the Galactic plane, we only count stars with km s-1. The velocity distributions shown in Figures 4 are comprised of stars from neighborhoods that have the same radial and angular widths as those in Figures 3. The centres of the neighborhoods of stars counted in the histograms are the same as the initial conditions for the orbit integrations and are labelled on the top of each figure panel.
2.2 Spiral crossing curves on Gaia DR2 velocity distributions
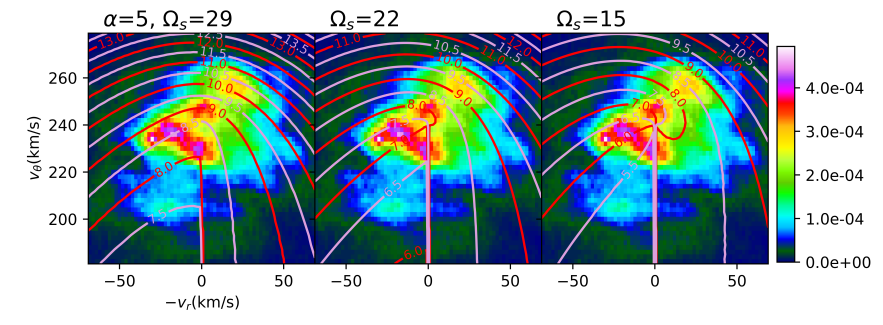
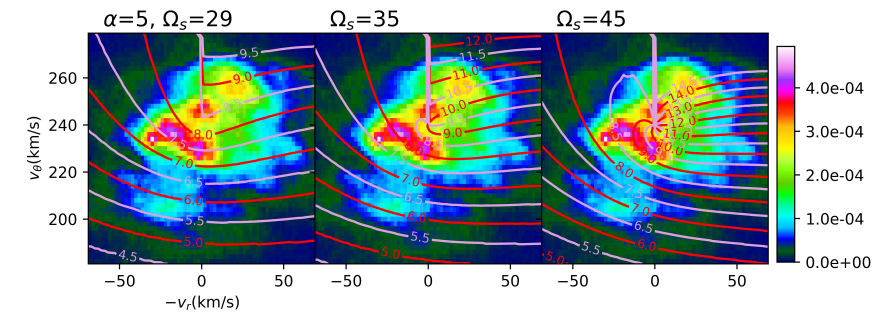
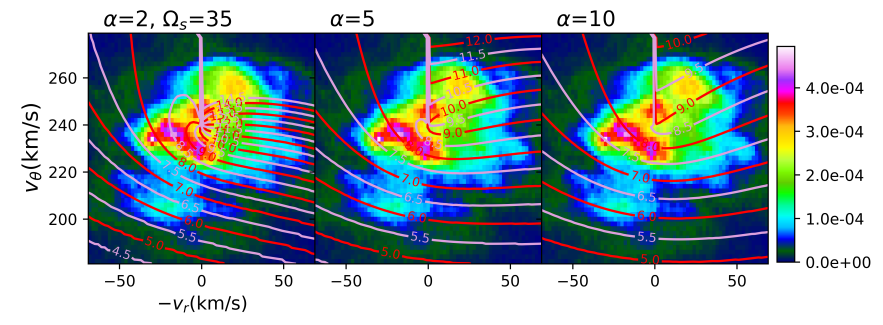
Figure 3 contours shows spiral radii (at ) for possible spiral arms touched at previous apocentres (top two rows) and those that would be touched at pericentres (bottom two rows). Contours are labelled in kpc. The top and third row panels show the effect of varying the spiral pattern speed, and the second and bottom panels show the effect of varying the spiral pitch angle. Pattern speeds are given in units of km s-1 kpc-1 and listed on top of the panels. Large or small compared to imply that pericentre or apocentre took place about 100 Myr ago (see Figure 1), not that the spiral arm is confined to large or small radii (equation 1 allows the spiral arm to reach all radii). Due to differential rotation in the Galaxy, a spiral arm with pattern speed that differs from the angular rotation rate of the Sun ( km s-1 kpc-1) can more quickly moves away from the Sun than one with .
In Figures 3 a single spiral arm would be expected to cause a change in the velocity distribution along one of the curves (of constant ) as stars on one side of the curve don’t cross the arm and those on the other side do. Because the location of a spiral arm depends on angle and radius, the curves on the plots are not symmetric about the line. We find that these curves can exhibit the slopes of arcs and streaks in the solar neighborhood’s stellar velocity distribution.
Figure 3 shows that spiral arm crossing curves depend on arm pattern speed and winding angle. We see that variations in pattern speed or winding angle cause larger differences in radius for orbits that have higher eccentricity. This is expected because is the present radius of the spiral arm at and higher eccentricity orbits reach apocentre or pericentre distant from the Sun. Measurements for the pitch angles of spiral arms in the Galaxy are (Russeil, 2003; Xu et al., 2016; Vallée, 2017). Estimated pitch angles tend to vary or be uncertain by a few degrees for a particular arm, though there is larger scatter for models that link arms or assume a particular number of arms is present (e.g., Vallée 2017). In contrast, pattern speed estimates vary widely (Naoz & Shaviv, 2007). Uncertainties in pattern speed more strongly affect our ability to estimate the current radius of a spiral arm (from a feature in the velocity distribution) than uncertainties in winding angle. Hereafter we adopt a winding parameter corresponding to pitch angle . This is approximately consistent with recent pitch angle estimates for spiral arms near the Sun (Xu et al., 2016).
So far we have discussed orbits computed in a logarithmic potential giving a flat rotation curve. A rotation curve with rotational velocity has slope dependent on an exponent (see Dehnen 1999a). With a flat rotation curve is recovered. With (approximately consistent with measurements of Oort’s constants; Bovy 2017) the most extreme apocentres and pericentres are about 0.5 kpc larger than shown on the upper part of Figure 1 left panel and the lower part of Figure 1 right panel. For , the curves on the in Figure 3 are similar but have radii about +0.5 kpc larger in the high eccentricity regions (near the outer boundaries) of the plots.
2.3 Multiple Arms
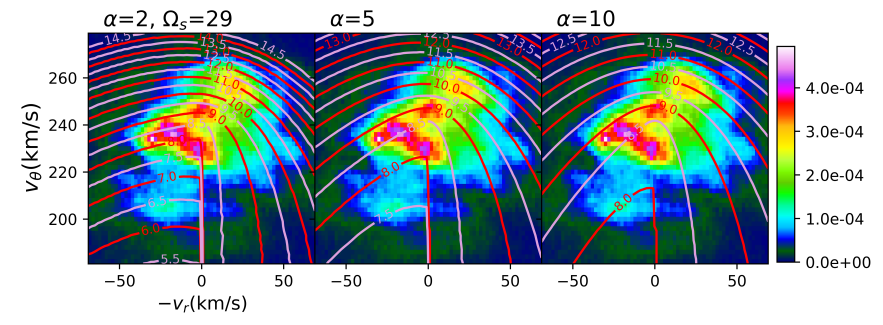
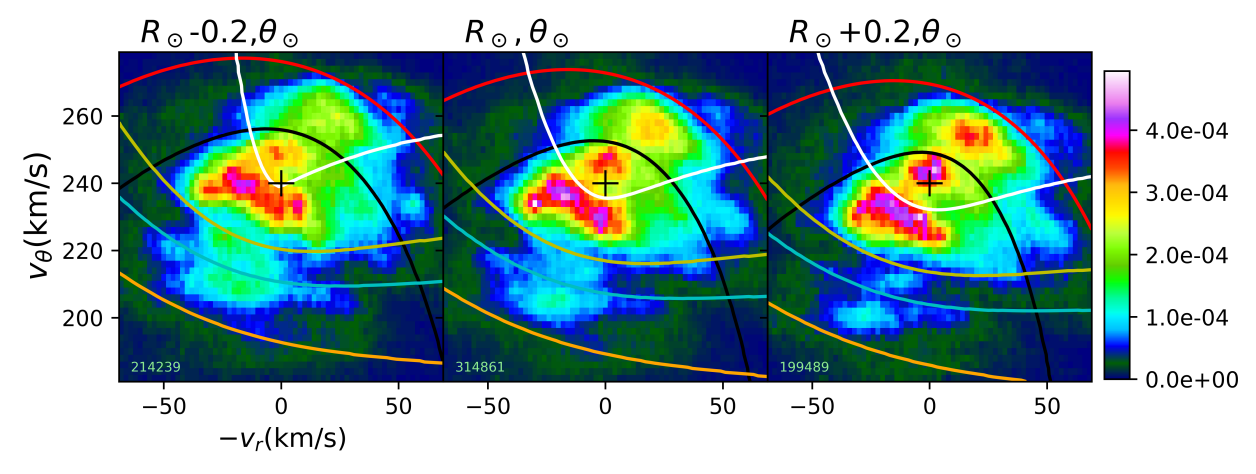
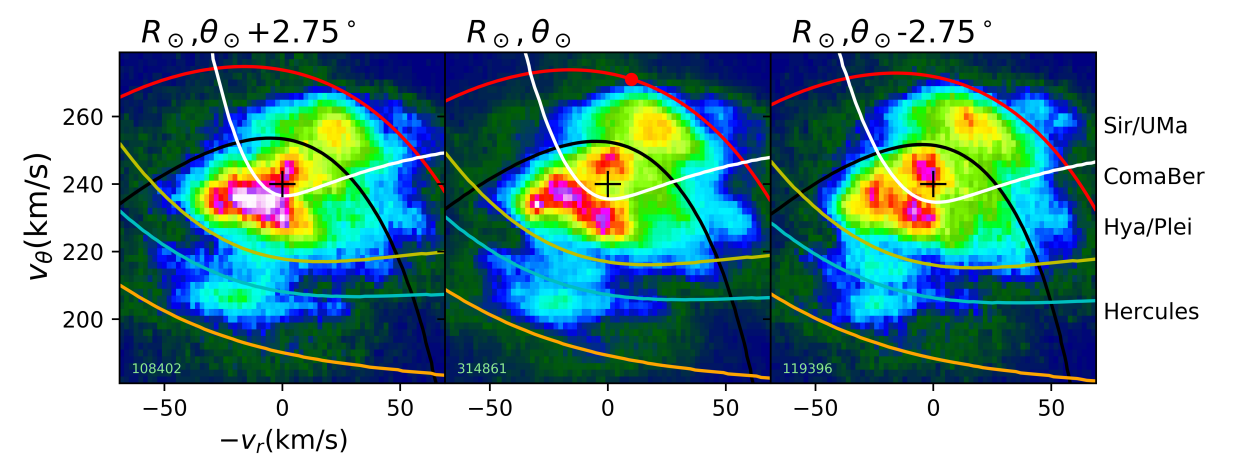
By adjusting the pattern speeds we have identified values of spiral arm positions that could account for features seen in the Gaia velocity distributions. Six spiral patterns, specified by their pattern speed and current radius at (and with winding parameter ) are listed in Table 1. These six patterns are shown as colored contours in Figure 4. In Figure 4 velocity distributions and spiral orbit crossings are computed at 5 different regions in the galaxies with central positions at and near the Sun. The coordinates of the regions are written on the top of each panel. Orbit integrations used to compute the curves are begun at the central coordinate values for each region. The names of common moving groups (or streams) are shown on the right hand side of the bottom row of panels with the height of the label matching the value of their associated peak in the velocity distribution. We have labelled the Hercules, Sirius/UMa, Coma Berenices and Hyades/Pleiades streams, adopting the names used by Dehnen (1998) (we note that their assumed local standard of rest differs from that used here).
Figure 4 displays stellar velocity distributions at different positions in the Galaxy near the Sun. The Gaia DR2 distributions confirm that the velocities of peaks in the stellar velocity distribution depend on position in the Galaxy (Monari et al., 2018), and as shown by previous studies (Antoja et al., 2014, 2015; Monari et al., 2017b; Quillen et al., 2018). In Figure 4 we see that peaks in the velocity distribution shift downward by a few km s-1 with increasing neighborhood galactocentric radius. Even though the distance between the neighborhoods is larger in the azimuthal direction than the radial one (0.4 kpc rather than 0.2 kpc), variations between the velocity distributions are less pronounced in the azimuthal direction (bottom row as compared to the top row of Figure 4). The tendency of a gap in the local velocity distribution to shift with radius of the neighborhood was also seen in the simulations by Quillen et al. (2011).
A strong dependence of the morphology of velocity distribution on galactocentric radius is expected for most dynamical processes. With spiral structure the gap shifts because stars at different angular momentum values can reach different spiral arms. For phase wrapping, this is expected because the epicyclic oscillation period is strongly dependent on radius. For resonant processes the strong radial dependence is expected because orbital frequencies are dependent on radius. In the case of the gap separating the Hercules stream from more nearly circular orbits, this was observed with observational data (Antoja et al., 2014; Monari et al., 2017b; Quillen et al., 2018), and predicted with models of the bar’s resonant effects on the local velocity distribution (Dehnen, 2000; Monari et al., 2017a).
In Figure 4 the red curves correspond to a spiral arm with current radius kpc at . This arm is consistent with the Perseus spiral arm, about 2 kpc outside the Sun’s galactocentric radius. In the velocity distributions, we infer that this arm is responsible for the outer boundary of the Sirius/UMa moving group, where stars can just reach the arm peak when they near apocentre. Figure 2 shows the orbit of a star that grazes this arm at at previous apocentre. The boundary depends on position in the Galaxy, decreasing in at larger galactocentric radius. The red line matches the boundary seen in the local velocity distributions for all 5 neighborhoods shown in Figure 4. We estimate a pattern speed of 20 km s-1 kpc-1 for this arm with an uncertainty of about 3 km s-1 kpc-1. This places the pattern speed below but near corotation at the galactocentric radius of the arm (at kpc, the angular rotation rate km s-1 kpc-1).
The black contours in Figure 4 correspond to a spiral arm that is nearer the Sun and has pattern speed similar to angular rotation rate of the local standard of rest (that is about 29 km s-1 kpc-1). This arm is consistent with the Local Spiral arm if it is a separate arm (Xu et al., 2013, 2016) rather than a spur (Hou & Han, 2014). In the velocity distributions, this arm causes a division between the Coma Berenices and the Sirius/UMa moving groups. Stars below the black contour curve never reach the arm, whereas those above it have crossed the arm and recently reached apocentre outside it.
The white curves correspond to a spiral arm that is currently at the location of the Sun. This is consistent with a continuation of the Local Spur (see Figure 2 by Xu et al. 2016). The arm causes a division between the Coma Berenices moving group and the Hyades/Pleiades moving groups, with stars in the Hyades/Pleiades moving groups crossing the Local Spur as they neared pericentre. The Local Spur is probably weak at the location of the Sun but could have been stronger 60 Myr ago when these pericentres took place (times can be estimated using Figure 1).
The yellow and cyan curves correspond to arms with larger pattern speeds, consistent with spiral arms closer to the Galactic centre. The current radii of these arms are both near that expected for the Sagittarius arm. There is confusion due to the presence of an orbital resonance with the Galactic bar (e.g., see discussion by Quillen et al. 2018 and citations listed in our introduction). Our simple orbit integrations do not take into account perturbations by the bar. The lower orange curves, bounding the lower part of the Hercules stream ( km s-1), correspond to a fast spiral pattern in the inner Galaxy with no obvious known counterpart. We have considered the possibility that a spiral arm might be touched at the second previous pericentre (rather than just the last one). For km s-1 kpc-1 and this hypothesis gives curves near the cyan and orange ones that are less tilted (closer to symmetrical about the line) than the cyan and orange curves and so might better match the orientation of the lower part of the Hercules stream. However, this hypothesis requires predicting orbits more than 200 Myr in the past. Until we have a good model for the recent behavior of spiral arms and have pinned down the bar pattern speed, we probably can’t predict the locations and times of pericentres well enough to relate it to spiral structure that might have been present that long ago.
Figure 4 suggests that nearby spiral arms have recently influenced the local velocity distribution. The Lin-Shu hypothesis (Lin & Shu, 1964) postulates that spiral arms are long lived patterns. However, N-body simulations can show spiral arm features which are short-lived but recurrent (transient) and with pattern speeds that match the rotation of the stars, (approximately co-rotating; e.g., Sellwood & Carlberg 1984; Grand et al. 2012; Roca-Fabrega et al. 2013; Kawata et al. 2014). Or multiple patterns might exist simultaneously with interference between them giving transient-like behavior (e.g., Quillen et al. 2011; Comparetta & Quillen 2012; Minchev et al. 2012). The match between velocity distribution boundaries with recent spiral structures would not be expected if spiral arms are long lived, as the distribution function would be relaxed and more like that computed by Monari et al. (2016). A nearly corotating spiral structure causes stronger perturbations on stars reaching it near apocentre than one that has a slower pattern speed (Kawata et al., 2014; Hunt et al., 2017). Our estimated pattern speeds (in Table 1) tend to be faster in the inner Galaxy than the outer Galaxy so are consistent with nearly corotating transient structures. Simulations have illustrated that transient spiral structures can migrate stars (e.g., Grand et al. 2012; Comparetta & Quillen 2012). Large additional numbers of higher eccentricity tracer particles would be required in a simulation to determine if there are associated arcs in local velocity distributions.
| Speed | radius | peri/apo | color | arm |
|---|---|---|---|---|
| 20 | 10.0 | apo | red | Perseus |
| 27 | 9.2 | apo | black | Local Arm |
| 29 | 8.0 | peri | white | Local Spur |
| 33 | 7.0 | peri | yellow | Sag, BR |
| 35 | 6.5 | peri | cyan | Sagittarius |
| 45 | 6.1 | peri | orange | ? |
Notes. Each colored curve (from top to bottom) shown in Figure 4 corresponds to a spiral arm listed here in corresponding order. The colors of the curves in the figures are listed in column 4. Each spiral arm is described with equation 1 and depends on a pattern speed, in km s-1 kpc-1, a winding parameter, , corresponding to a pitch angle of , and the present radius of the arm peak in kpc at . We also specify whether the curve in Figure 4 is for pericentre or apocentre crossing. The rightmost column lists associated known arms in the Galaxy near the Sun, referring to the map in Figure 2 by Xu et al. (2016). BR stands for a resonance with the Galactic bar. Sag stands for the Sagittarius arm. The boundaries are estimated using orbits computed in a potential with a flat rotation curve.
3 Summary and Discussion
Disc stars near the Sun have crossed spiral arms. We propose that divisions or boundaries in local velocity distributions separate stars that have recently crossed or been strongly perturbed by a particular arm from those that haven’t. This scenario is similar to that explored by Hunt et al. (2017) for high angular momentum disc stars in the solar neighborhood with apocentres approaching the Perseus spiral arm. By estimating the time, angle and radius of recent pericentres and apocentres and using a logarithmic spiral model, we estimate pattern speeds and radii of spiral patterns that could have formed boundaries in stellar velocity distributions constructed from nearby stars. The model matches tilts of some arcs present in the local velocity distributions constructed from Gaia DR2 data and how these arcs vary with position in the Galaxy. The model accounts for the outer edge of the Sirius/UMa moving group with recent apocentres nearing the Perseus spiral arm. The division between the Coma Berenices and Sirius/UMa moving groups traces apocentres near the Local Spiral arm, and the division between Coma Berenices and Hyades/Pleiades moving groups with pericentres near the Local Spur, with Local arm and spur locations as mapped by Xu et al. (2016). This model requires multiple spiral patterns present nearby in the Galaxy, supporting a more flocculent rather than a grand design morphology for the outer Galaxy (e.g., Quillen 2002; Xu et al. 2016).
Our model arm crossings do not accurately predict the morphology of streaks in the Hercules stream and their dependence on position in the Galaxy. The scenario is less successful for faster patterns present in the inner Galaxy, possibly because we have not taken into account perturbations from the Galactic bar. We failed to find curves that bound the clump in the velocity distribution at and km s-1 known as the Wolf 630 moving group. Solar neighborhood stars (such as in the Hercules or Wolf 630 moving groups) could have been perturbed by spiral arms that are now distant from the Sun, making it harder to match structures in the velocity distribution at higher orbital eccentricity with known spiral structures.
We have proposed a relation between boundaries in local velocity distributions and loci of pericentres or apocentres that have recently approached spiral arms. Without doubt spiral arms perturbations influence local velocity distributions, but how they do so is likely more complex than defined by a simple pericentre or apocentre locus. The velocity perturbation on a star caused by grazing an arm is likely to be similar to the size of bumps and wiggles ( 10–20 km s-1 McGaugh 2016), measured in the Milky Way rotation curve caused by spiral arms. The velocity perturbation would also be sensitive to the strength, width and pattern speed of the arm and the length of time that the star is near the spiral’s density peak. Orbit integrations that take into account the perturbation of the arm are needed to quantitatively estimate the depth of a feature in the velocity distribution caused by close passages to a spiral arm. Simulations containing many particles are needed to match the numbers of stars in the Gaia database and resolve structure in phase space at higher eccentricity while simultaneously allowing self-consistent self gravitating spiral structures to develop in the colder disc population. Time dependent and non-equilibrium models with spiral arms could be improved for the stellar phase space distribution functions. Structure and gradients in the velocity distribution imply that there are variations with position in the number density of stars. With improvements in 3D extinction maps and better statistical models, we may improve maps of spiral structure in the Galaxy. These developments would be needed to confirm or explore the connection between boundaries in local velocity distributions and spiral arms.
Spiral structure alone cannot account for the vertical motions studied by Antoja et al. (2018) or vertical gradients in the velocity distribution, as illustrated by the Coma Berenices moving group (Quillen et al., 2018; Monari et al., 2018). High angular momentum and high eccentricity stars and those with large vertical amplitudes should be less strongly affected by spiral arms and might more prominently show phase wrapping associated with perturbations in the outer Galaxy, and affecting both planar and vertical velocity distributions. Warp or spiral-like features can be induced by external perturbations (dela Vega et al., 2015; Chequers & Widrow, 2017) and these might have more strongly perturbed stars with particular vertical and horizontal epicycles, causing substructure in velocity distributions as a function of as well as and . In our model, boundaries in velocity distributions are not solely dependent on particular orbital periods, differing from a resonant model where a particular period sets a gap in phase space (e.g., see Quillen et al. 2018). The influence of spiral structure on local velocity distributions may blur gaps caused by orbital resonances in the action distributions (see those computed by Trick et al. 2018).
A.C. Quillen is grateful to the Leibniz Institut für Astrophysik Potsdam (AIP) for their warm welcome, support and hospitality July 2017 and April-May 2018. A.C. Quillen thanks Mt. Stromlo Observatory for their warm welcome and hospitality Nov 2017– Feb 2018. A. C. Quillen is grateful for generous support from the Simons Foundation and her work is in part supported by NASA grant 80NSSC17K0771. I. Minchev acknowledges support by the Deutsche Forschungsgemeinschaft under the grant MI 2009/1-1.
We thank Anna Queiroz and Basilio Santiago for help with StarHorse. We thank Gal Matijevic for invaluable and continued support. We thank the E-Science and Supercomputing Group at Leibniz Institute for Astrophysics Potsdam (AIP) for their support with running the S͡tarHorse code on AIP cluster resources.
This work has made use of data from the European Space Agency (ESA) mission Gaia (https://www.cosmos.esa.int/gaia), processed by the Gaia Data Processing and Analysis Consortium (DPAC, https://www.cosmos.esa.int/web/gaia/dpac/consortium). Funding for the DPAC has been provided by national institutions, in particular the institutions participating in the Gaia Multilateral Agreement.
References
- Gaia Collaboration; Prusti et al. (2016) Gaia Collaboration; Prusti, T. et al. 2016, A&A, 595, A1
- Gaia Collaboration; Brown et al. (2018) Gaia Collaboration; Brown, A. G. A., Vallenari, A., Prusti, T., de Bruijne, J. H. J., Babusiaux, C., Bailer-Jones, C. A. L. 2018, arXiv:1804.09365, A&A, in press
- Gaia Collaboration; Katz et al. (2018) Gaia Collaboration; Katz, D. et al. 2018, arXiv:1804.09380, A&A, in press
- Antoja et al. (2014) Antoja, T. et al., 2014, A&A, 563, A60
- Antoja et al. (2015) Antoja, T. et al. 2015, ApJ, 800, L32
- Antoja et al. (2018) Antoja, T. et al. 2018, Nature, in press, arXiv:1804.10196
- Bailer-Jones et al. (2018) Bailer-Jones, C.A.L. , Rybizki, J., Fouesneau, M., Mantelet, G., Andrae, R. 2018, arXiv:1804.10121
- Bland-Hawthorn & Gerhard (2016) Bland-Hawthorn, J. & Gerhard, O. 2016, ARA&A, 54, 529
- Bovy (2017) Bovy, J. 2017, MNRAS, 468, L63
- Bressan et al. (2012) Bressan, A., Marigo, P., Girardi, L., Salasnich, B., Dal Cero, C., Rubele, S., Nanni, A. 2012, MNRAS, 427, 127
- Burnett & Binney (2010) Burnett, B., Binney, J., 2010, MNRAS, 407, 339
- Chequers & Widrow (2017) Chequers, M. H., Widrow, L. M. 2017, MNRAS, 472, 2751
- Chen et al. (2014) Chen, Y., Girardi, L., Bressan, A., Marigo, P., Barbieri, M., Kong, X. 2014, MNRAS, 444, 2525
- Comparetta & Quillen (2012) Comparetta, J. & Quillen, A. C. 2012, preprint arXiv:1207.5753
- Dehnen (1998) Dehnen, W. 1998, AJ, 115, 2384
- Dehnen (1999a) Dehnen, W. 1999a, AJ, 118, 1190
- Dehnen (1999b) Dehnen, W. 1999b, ApJ, 524, L35
- Dehnen (2000) Dehnen, W. 2000, AJ, 119, 800
- dela Vega et al. (2015) dela Vega, A., Quillen, A. C., Carlin, J. L., Chakrabarti, S., D’Onghia, E. 2015, MNRAS, 454, 933
- Gomez et al. (2012) Gomez, F. A., Minchev, I., O’Shea, B. W., Lee, Y. S., Beers, T. C., An, D., Bullock, J. S., Purcell, C. W., Villalobos, A. 2012 MNRAS, 423, 3727
- Gomez et al. (2013) Gomez, F. A., Minchev, I., O’Shea, B. W., Beers, T. C., Bullock, J. S., Purcell, C. W. 2013, MNRAS, 429, 159
- Grand et al. (2012) Grand, R. J. J., Bovy, J., Kawata, D., Hunt, J. A. S., Famaey, B., Siebert, A., Monari, G., Cropper, M. 2015, MNRAS, 453, 1867
- Fux (2001) Fux, R. 2001, A&A, 373, 511
- Hou & Han (2014) Hou, L. G. & Han G. L. 2014, A&A, 569, A125
- Hunt et al. (2017) Hunt, J. A. S., Kawata, D., Monari, G., Grand, R. J. J., Famaey, B., Siebert, A. 2017, MNRAS, 467, L21
- Hunt & Bovy (2018) Hunt, J. A. S., Bovy, J. 2018, MNRAS, 477, 3945
- Kalnajs (1991) Kalnajs, A. J. 1991, in Dynamics of Disc Galaxies, Proc. Conf., Varberg Castle, Sweden, ed. B. Sundelius, p. 323
- Kawata et al. (2014) Kawata, D., Hunt, J. A. S., Grand, R. J. J., Pasetto, S., Cropper, M. 2014, MNRAS, 443, 2757
- Kawata et al. (2018) Kawata, D., Baba, J., Ciuc, I., Cropper, M., Grand, R. J. J., Hunt, J. A. S., Seabroke, G. 2018, MNRAS, 109, temp, arXiv:1804.10175
- Laporte et al. (2018) Laporte, C. F. P., Johnston, K. V., Gomez, F. A., Garavito-Camargo, N., Besla, G. 2018, MNRAS, 1495, temp, arXiv:1710.02538
- Lin & Shu (1964) Lin, C. C., Shu, F. H., 1964, ApJ, 140, 646
- Lindegren et al. (2018) Lindegren L., et al. 2018, arXiv:1804.09366
- Luri et al. (2018) Luri, X., et al. 2018, arXiv:1804.09376 , A&A, in press
- Marigo et al. (2017) Marigo, P., et al. 2017, ApJ, 835, 77
- McGaugh (2016) McGaugh, S. S. 2016, ApJ, 816, 42
- McMillan et al. (2018a) McMillan, P.J., Kordopatis, G., Kunder, A. et al. 2018, MNRAS, 477, 5279
- McMillan et al. (2018b) McMillan, P. J. 2018, Research Notes of the American Astronomical Society, Volume 2, Issue 2, article id. 51
- Minchev et al. (2007) Minchev, I., Nordhaus, J., & Quillen, A. C. 2007, ApJ, 664, L31
- Minchev et al. (2009) Minchev, I., Quillen, A. C., Williams, M., Freeman, K. C., Nordhaus, J., Siebert, A., Bienayme, O. 2009, MNRAS, 396, L56
- Minchev et al. (2010) Minchev, I., Boily, C., Siebert, A., & Bienayme, O. 2010, MNRAS, 407, 2122
- Minchev et al. (2012) Minchev, I., Famaey, B., Quillen, A. C., Di Matteo, P., Combes, F., Vlajic, M., Erwin, P., Bland-Hawthorn, J. 2012, A&A, 548, A126
- Monari et al. (2014) Monari, G., Helmi, A., Antoja, T., & Steinmetz, M. 2014, A&A, 569, A69
- Monari et al. (2016) Monari, G., Famaey, B., Siebert, A. 2016, MNRAS, 457, 2569
- Monari et al. (2017a) Monari, G., Famaey, B., Fouvry, J.-B., Binney, J. 2017a, MNRAS, 471, 4314
- Monari et al. (2017b) Monari, G., Kawata, D., Hunt, J. A. S., Famaey, B. 2017b, MNRAS, 466, L113
- Monari et al. (2018) Monari, G., et al. 2018, Research Notes of the American Astronomical Society, Volume 2, Issue 2, article id. 32. DOI: 10.3847/2515-5172/aac38e
- Naoz & Shaviv (2007) Naoz, S., Shaviv, N. J. 2007, New Astronomy, 12, 410
- Perez-Villegas et al. (2017) Perez-Villegas, A., Portail, M., Wegg, C., Gerhard, O. 2017, ApJ, 840, L2
- Queiroz et al. (2018) Queiroz, A. B. A., et al. 2018, MNRAS, 476, 2556
- Quillen (2002) Quillen, A. C. 2002, AJ, 124, 924
- Quillen & Minchev (2005) Quillen, A. C., Minchev, I. 2005, AJ, 130, 576
- Quillen et al. (2009) Quillen, A. C., Minchev, I., Bland-Hawthorn, J., Haywood, M. 2009, MNRAS, 397, 1599
- Quillen et al. (2011) Quillen, A. C., Dougherty, J., Bagley, M. B., Minchev, I., Comparetta, J. 2011, MNRAS, 417, 762
- Quillen et al. (2018) Quillen, A. C. et al. 2018, MNRAS, 478, 228
- Reid et al. (2009) Reid, M. J. et al., 2009, ApJ, 700, 137
- Reid et al. (2014) Reid, M. J., Menten, K. M., Brunthaler, A., et al. 2014, ApJ, 783, 130
- Roca-Fabrega et al. (2013) Roca-Fabrega, S., Valenzuela, O., Figueras F., Romero-Gomez, M., Velaazquez, H., Antoja, T., Pichardo, B. 2013, MNRAS, 432, 2878
- Russeil (2003) Russeil, D., 2003, A&A, 397, 133
- Santiago et al. (2016) Santiago, B. X., et al. 2016, A&A, 585, 42
- Schönrich et al. (2010) Schönrich, R., Binney, J., Dehnen, W. 2010, MNRAS, 403, 1829
- Schlafly et al. (2016) Schlafly, E. F., et al. 2016, ApJ, 821, 78
- Sellwood & Carlberg (1984) Sellwood J. A., Carlberg, R. G. 1984, ApJ, 282, 61
- Sellwood & Carlberg (2014) Sellwood, J. A., Carlberg, R. G. 2014, ApJ, 785, 137
- Tang et al. (2014) Tang, J., Bressan, A., Rosenfield, P., Slemer, A., Marigo, P., Girardi, L., Bianchi, L. 2014, MNRAS, 445, 4287
- Trick et al. (2018) Trick, W. H., Coronado, J., Rix, H.-W. 2018, arXiv:1805.03653
- Vallée (2017) Vallée, J. P. 2017, New Astronomy Reviews, 79, 49
- Vazquez et al. (2008) Vazquez, R. A., May, J., Carraro, G., Bronfman, L., Moitinho, A., Baume, G. 2008, ApJ, 672, 930
- Xu et al. (2013) Xu, Y., Li, J.J., Reid, M. J., Menten, K. M., Zheng, X. W., Brunthaler, A., Moscadelli, L., Dame, T. M., Zhang, B. 2013, ApJ, 769,15
- Xu et al. (2016) Xu, Y., Reid, M., Dame, T., Menten, K., Sakai, N., Li, J., Brunthaler, A., Moscadelli, L., Zhang, B., Zheng, X. 2016, Sci. Adv., 2, e160087