INITIAL FEATURES OF AN X-CLASS FLARE OBSERVED WITH SUMER AND TRACE
Abstract
A class X1.5 flare started on the solar limb at 00:43 UT on 21 April 2002, which was associated with a CME observed at 01:27 UT by LASCO C2. The coordinated analyses of this flare include TRACE 195 Å images and SUMER spectra in lines of Fe XXI, Fe XII, and C II. We find that: 1) The flare began with a jet seen by TRACE, which was detected by SUMER in the C II line as a strong brightening with blue shifts up to 170 km s-1. At that time only weak emission was detected in Fe XII and Fe XXI. 2) Subsequently, a weak looplike brightening started south of the jet, moving outwards with an average speed of about 150 km s-1. The SUMER spectra responded this moving loop as separatingly brightenings, visible only in the Fe XXI line. The southwards moving component contains red- and blue-shifted emission features and has an apparent speed of 120 km s-1. The absence of signatures in Fe XII and C II lines indicates that the moving weak loop seen by TRACE corresponds to the emission from very hot plasma, in a blend line in the 195 Å bandpass due to Fe XXIV formed at T 10 MK. 3) The trigger mechanism of the flare and associated CME can be interpreted in the same way as that proposed by Wang et al. (2002) for an event with similar initial features.
keywords:
solar corona; flares; UV radiation, X-rays1 Introduction
Multiple wavelength imaging of flares reveals a complex array of features such as ejections of hot plasma in soft X-rays (Shibata et al., 1995; Ohyama & Shibata, 1998) and explosive coronal waves like Moreton waves and EIT waves (Moreton, 1960; Thompson et al., 1999), and recent reports of X-ray waves (Khan & Aurass, 2002; Narukage et al., 2002). The flares with these features are found generally correlated with the coronal mass ejections (CMEs) (Nitta & Akiyama, 1999; Klassen et al., 2000). Therefore, the information about these features are important for the understanding of the physics of flare and CME initiation (Shibata, 1999; Chen et al., 2002).
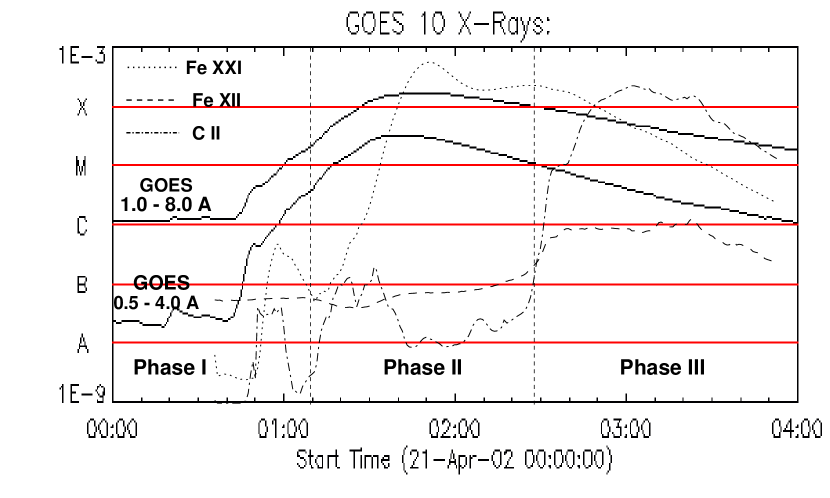
The Solar Ultraviolet Measurements of Emitted Radiation (SUMER) spectrometer aboard is a powerful instrument, which can provide accurate Doppler shift measurements of dynamic coronal structures and can diagnose their temperature over a very wide range of K. Spectral measurements by SUMER of flare-associated coronal features, being complementary to the imaging, may bring us new insight into the origin of flares and CMEs (Innes et al., 2001; Kliem et al., 2002). In this paper, we present preliminary results derived from simultaneous spectral and imaging observations of a class X1.5 flare that occurred just over the southwest limb of the Sun on 2002 April 21 in active region NOAA 9906. The GOES soft X-ray flux began at 00:43 UT and reached a maximum at 01:51 UT (Fig. 1). A large CME was firstly seen at 01:27 UT by the C2 telescope of the Large-Angle Spectroscopic Coronagraph (LASCO).
2 Observations
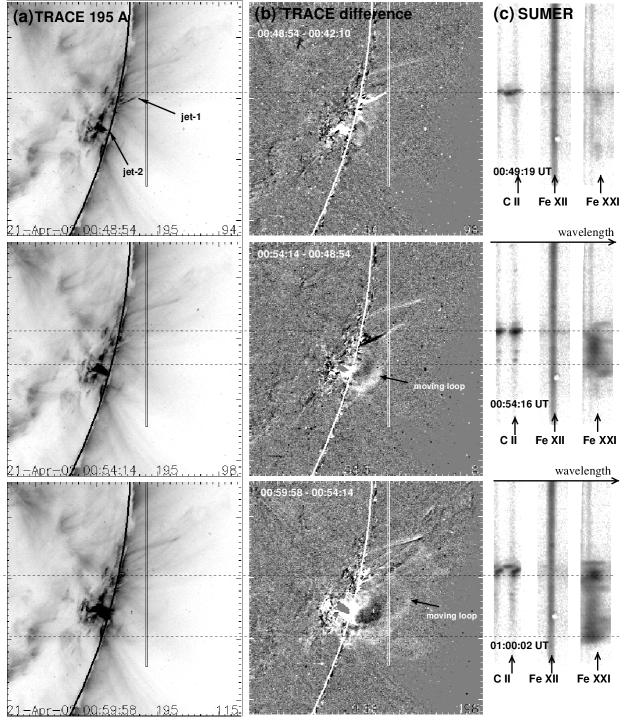
TRACE observed the event with a cadence of 20 s in the 195 Å channel that contains a typical coronal line (Fe XII) and a generally much weak flare line (Fe XXIV). SUMER recorded the spectra with a 50 s exposure time, and a slit at a fixed position off the limb (Fig. 2a). Three representative lines were recorded: a relatively cool transition region line, C II 1335.7 Å ( K), a coronal line, Fe XII 1349.4 Å ( K), and a hot flare line, Fe XXI 1354.1 Å ( K). For each line, the spectral window has a range of 2.1 Å, thus allowing a detection of Doppler shifts within km s-1. The SUMER observations started at 00:36 UT and ended at 03:52 UT, covering the whole flare period.
3 Results
The EUV images show that the flare started at 00:39:29 UT as a dark jet from the disk (see “jet-1” in Fig. 2a ). The animations of Figs. 2b and 2c are available online111http://solar.physics.montana.edu/wangtj/mov. As jet-1 developed, it extended towards the slit. At 00:44:22 UT, SUMER detected the first emission of this jet in the C II line with a blue shift of up to 170 km s-1. At this moment another jetlike brightening started (see “jet-2” in Fig. 2a ). At 00:47:14 UT, jet-1 was ejected as a brightening moving outwards at an apparent speed of 145 km s-1. SUMER detected this ejection at 00:48:29 UT in C II as a strong blue-shifted brightening with Doppler velocity 130 km s-1 , and a weak emission in the blue wing of the Fe XII line (Fig. 2c ).
The TRACE observations had a gap during 00:5000:54 UT. Afterwards a weak looplike emission front was seen moving westwards. This moving looplike feature reached the west boundary of the FOV at about 01:06 UT. Its speed increased from 100 km s-1 to more than 200 km s-1 during this period. From 01:06 UT to 01:12 UT, the loop seemed to ungo an explosively expansion, or opened, because the curved legs stretched rapidly. The SUMER spectra show that in the Fe XXI line a brightening appeared at 00:49:19 UT at the 35′′ south of the jet-1 and enhanced. At 00:50:58 UT, this component suddenly extended towards the red wing upto the window boundary, then the blue wing emission enhanced more strongly and moved separately along the slit. The earlier red wing component (Doppler shift 100 km s-1) started moving southwards earlier than the blue wing component, so it moved ahead of the blue wing component (Fig. 2c ), but the blue wing component caught up with the red one at 00:55:55 UT. The motion of multiple components suggest the presence of several expanding loops. The southwards moving component has an average speed of about 120 km s-1, and a maximum blue shift of 75 km s-1 at 00:58:24 UT. This south component stopped at 01:02:31 UT 126′′ south of jet-1, then decayed quickly. While the northward moving component stopped at 00:59:13 UT just at the jet-1 position, and kept strong emission till 01:06:39 UT, then decayed.
The EUV difference images show clearly that when the moving loop swept across the slit, the SUMER spectra responded in Fe XXI line as separately moving brightenings at the intersections of the loop with the slit (Fig. 2b and ). In addition, the SUMER spectra show that the emission of jet-1 in C II remained at almost the same position until 01:05 UT. This implies that the magnetic topology related to jet-1 did not change much during this initial phase. Noticeably, except for weak emission in the line wing at the jet-1 position, Fe XII showed no response to the sweeping of the EUV moving loop. This demonstrates that the emission of the moving loop seen in TRACE 195 Å came from the Fe XXIV line.
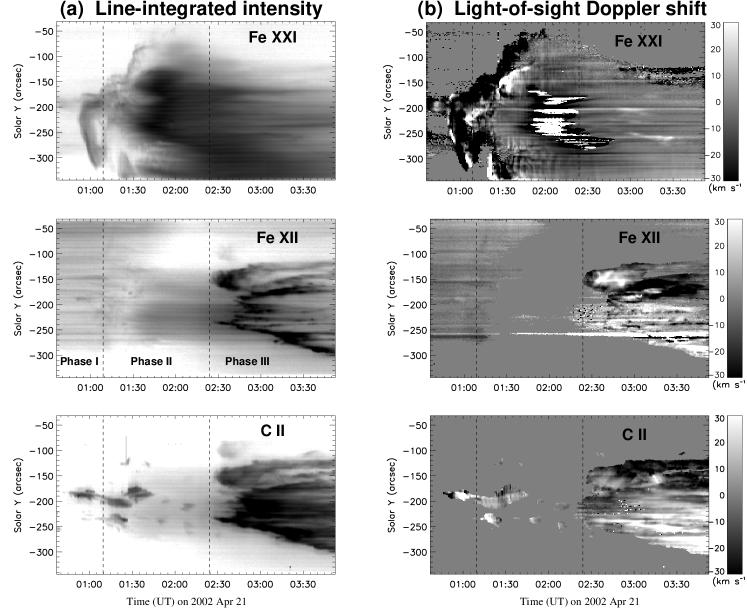
The intensity time series of the SUMER spectra show the remaining jet-1 emission in C II, separately moving brightenings in Fe XXI, and no signature in Fe XII during the initial phase of 00:4001:10 UT (Phase I in Fig. 3a). The Doppler shift time series show the preflare weak red-shifted emission in Fe XXI near the position of jet-1 (Fig. 3b ). The Doppler shift evolution of jet-1 shows that the shifts were first blue, then became red in C II (Fig. 3b ).
During the main phase of 01:1002:23 UT (Phase II in Fig. 3a), the Fe XXI spectra show the development of red- and blue-shifted emission between S. Then at 01:19 UT a red-shifted emission occurred at 340′′S which extended northwards and shifted to the blue wing. At 01:24 UT, a blue-shifted emission moved from 150′′S to 80′′S at a speed of 85 km s-1. From 01:30 UT, two strong brightenings developed just at the sides of the jet-1 position. The C II spectra show that two ejections occurred at 200′′S and 240′′S during 01:1001:22 UT. From 01:25 UT to 01:45 UT, a C II ejection happened near the earlier jet-1 position, just located at a gap between two strong brightenings in Fe XXI (Fig. 3a and ). During the phase II, except for the increase of emission in the continuum, the Fe XII spectra did not show any signature.
During the decaying phase (Phase III in Fig. 3a), the simultaneous occurrence of strong emissions in Fe XII and C II at 02:24 UT, which show a similar spatial evolution in brightness and Doppler shift, is the most prominent feature. The brightening slowly moved southwards along the slit at a speed of 10 km s-1. From the TRACE EUV images, we identify that the start of this brightening corresponded to rising postflare arcades, which reached the slit at that time. The Fe XXI spectral evolution shows no signatures in brightness and Doppler shift, in response to the arrival of the postflare arcades (Fig. 3). But we notice the two brightenings in Fe XII or C II located at and , which were divided by a strong emission located near the earlier jet-1. They are coincident with the two brightenings occurring at about 01:30 UT in Fe XXI.
Figure 1 shows that the soft X-ray flux increased at the time jet-1 was first seen in TRACE 195 Å. The first flux pulse in C II corresponding to the occurrence of jet-1, started little earlier than the flux pulse in Fe XXI, which corresponds to the ejection of a hot loop. During the main phase of the flare, the flux in soft X-ray and Fe XXI reached the maximum at the same time, while the flux in Fe XII and C II were at low levels. During the decay phase, the flux in soft X-ray and Fe XXI kept decreasing, while the rising EUV postflare loops caused the correlated flux pulses in Fe XII and C II at the SUMER slit.
4 Discussion and Conclusion
We have analyzed the evolution of TRACE EUV images and SUMER spectra of an X-class flare occurring at the limb. We find that the event began with an EUV jet dominated by 104 K plasma ejection. Following this jet, a weak looplike brightening was seen explosively expanding outwards while being accelerated. From the SUMER spectra, we determine the temperature of this moving emission feature to be above 107 K, consistent with the emission from Fe XXIV in TRACE 195 Å channel. Because the moving emission feature has a speed of only about 150 km s-1, we exclude the possibility of flare shocks. Instead, from the curvature change, we suggest that this moving feature corresponds to hot coronal loop ejection, or the looplike hot plasma ejection seen often by SXT, associated with impulsive flares (Shibata et al., 1995).
Wang et al. (2002) have studied a similar case of an X-class flare initiation associated with jets and expanding hot loops that occurred near disk center, and was associated with a halo CME. They found that X-ray jets happened at a special magnetic region called a “bald patch” (where the magnetic field is tangent to the photosphere) that is formed between a twisted emerging flux system and a transequatorial interconnecting loop system. They suggested that slow reconnection at the bald patch causes the jets and ejection of the twisted flux. The initial expanding hot loops correspond to the removal of the preheated overlaying flux due to reconnection at the bald patch. Their proposed scenario can also explain the disappearance of a soft X-ray transequatorial loop and large-scale extending EUV dimmings, and the CME. In our case, we notice the presence of EUV transequatorial connections between AR 9906 (the flare region) and AR 9907 (in the north hemisphere) seen in EIT 171 Å, and the initial EUV jet occurring at the northern edge of the active region. Therefore, we suggest that a similar magnetic topology and trigger mechanism as that proposed by Wang et al. (2002) can be used to interpret the flare-CME event studied in this paper.
We find that the brightenings in Fe XXI at phase II are coincided with those in Fe XII or C II at phase III. This implies that the rising postflare loops seen in TRACE 195 Å may originate from the cooling of hot loops produced via the standard flare model. And the simultaneous occurrence of the brightenings in Fe XII and C II suggests that the cooling time from 106 K to 104 K was very short, less than 50 s (SUMER observing cadence), or the temperature gradient in height was very large. This may explain why the strong emission in C II lasted longer than in Fe XII. Otherwise, if we think that they were real rising “cool” loops of the plasma in temperature K, we need to explain their origin.
References
- Chen et al. (2002) Chen, P. F., Wu, S. T., Shibata, K., & Fang, C. 2002, ApJ, 572, L99
- Khan & Aurass (2002) Khan, J. I., & Aurass, H. 2002, A&A, 383, 1018
- Klassen et al. (2000) Klassen, A., Aurass, H., Mann, G., & Thompson, B. J. 2000, A&AS, 141, 357
- Kliem et al. (2002) Kliem, B., Dammasch, I. E., Curdt, W., & Wilhelm, K. 2002, ApJ, 568, L61
- Innes et al. (2001) Innes, D. E., Curdt, W., Schwenn, R., Solanki, S. K., & Stenborg, G., 2001, ApJ, 549, L249
- Narukage et al. (2002) Narukage, N., Hudson, H. S., Morimoto, S., et al. 2002, ApJ, 572, L109
- Nitta & Akiyama (1999) Nitta, N. & Akiyama, S. 1999, ApJ, 525, L57
- Moreton (1960) Moreton, G. E. 1960, AJ, 65, 494
- Ohyama & Shibata (1998) Ohyama, M., & Shibata, K. 1998, ApJ, 499, 934
- Shibata et al. (1995) Shibata, K., 1995, ApJ, 451, L83
- Shibata (1999) Shibata, K., 1999, Astrophy.& Space Sci. 264, 129
- Thompson et al. (1999) Thompson, B. J., et al. 1999, ApJ, 517, L151
- Wang et al. (2002) Wang, T. J., Yan, Y., Wang, J. L., Kurokawa, H., Shibata, K. 2002, ApJ, 572, 580