First observations of the magnetic field inside the Pillars of Creation: Results from the BISTRO survey
Abstract
We present the first high-resolution, submillimeter-wavelength polarimetric observations of – and thus direct observations of the magnetic field morphology within – the dense gas of the Pillars of Creation in M16. These 850 m observations, taken as part of the BISTRO (B-Fields in Star-forming Region Observations) Survey using the POL-2 polarimeter on the SCUBA-2 camera on the James Clerk Maxwell Telescope (JCMT), show that the magnetic field runs along the length of the pillars, perpendicular to, and decoupled from, the field in the surrounding photoionized cloud. Using the Chandrasekhar-Fermi method we estimate a plane-of-sky magnetic field strength of G in the Pillars, consistent with their having been formed through compression of gas with initially weak magnetization. The observed magnetic field strength and morphology suggests that the magnetic field may be slowing the pillars’ evolution into cometary globules. We thus hypothesize that the evolution and lifetime of the Pillars may be strongly influenced by the strength of the coupling of their magnetic field to that of their parent photoionized cloud – i.e. that the Pillars’ longevity results from magnetic support.
1 Introduction
One of the most iconic images taken by the Hubble Space Telescope (HST) was of the ‘Pillars of Creation’ in M16 (Hester et al., 1996). These photoionized columns are typical of those found in high-mass star-forming regions throughout the interstellar medium. M16 is a relatively local ( kpc; Dufton et al. 2006), well-resolved, site of active ongoing star formation (Oliveira, 2008), typical of regions forming high-mass ( M⊙) stars (Zinnecker & Yorke, 2007). We present the first detailed measurements of the magnetic field (hereafter B-field) in the densest parts of the pillars, taken as part of the B-Fields in Star-Forming Region Observations (BISTRO) survey (Ward-Thompson et al., 2017) on the James Clerk Maxwell Telescope (JCMT) using the Submillimeter Common-User Bolometer Array 2 (SCUBA-2) camera and its polarimeter POL-2.
Young massive stars produce sufficient high-energy photons to ionize a volume of their parent molecular cloud, thereby driving a shock into the cloud (Strömgren, 1939; Zinnecker & Yorke, 2007). These photoionized regions indicate ongoing high-mass star formation. Complex structures can form in the dense gas at the shock interfaces (Spitzer, 1954) – particularly, dense, neutral columns are frequently seen protruding into photoionized regions, most famously in M16. The formation and evolution of these pillars remain disputed (White et al. 1999; Williams et al. 2001; Ryutov et al. 2005, hereafter Wh99; Wi01; R05 respectively), with the role of the B-field neither observationally nor theoretically well-constrained (Williams 2007; hereafter Wi07). Near-infrared extinction observations of M16 suggest a difference in B-field direction between the Pillars and the surrounding photoionized cloud (Sugitani et al., 2007), but cannot probe the dense gas of the Pillars themselves.
The heads of the Pillars are dense, star-forming, molecular condensations (Wh99) interacting with the shock front associated with the young ( Myr; Bonatto et al. 2006) high-mass cluster NGC6611 (Hillenbrand et al., 1993). Whether these condensations predate, or were formed by, the shock interaction is uncertain (Wh99; Wi01). The heads are being destroyed by the interaction with NGC6611, with a lifetime of yr (McLeod et al., 2015), and are thus likely to be considerably longer-lived than the lower-density pillars, whose estimated lifetime is a few yr (Wi01), suggesting that they will become disconnected cometary globules (Bertoldi & McKee, 1990), unless another mechanism, such as a B-field, is at work.
We observed the Pillars of Creation in 850 m polarized light with the POL-2 polarimeter (Friberg et al. 2016) on the SCUBA-2 camera (Holland et al., 2013), giving a map of the B-field in the dense gas of photoionized pillars unprecedented in sensitivity, area and resolution. We observed Pillars I, II and III (Hester et al., 1996) at high S/N, and Pillar IV, the Spire and SFO30 (not shown) at lower S/N.
2 Observations
The Eagle Nebula was observed in 20 separate 40-minute exposures between 6 June 2017 and 27 July 2017, with a total integration time of 14 hours. The observations were taken in JCMT Band 2 weather, with atmospheric optical depth at 225 GHz, , of . The BISTRO survey’s observing strategy is described by Ward-Thompson et al. (2017).
The 850 m POL-2 data were reduced using the routine111http://starlink.eao.hawaii.edu/docs/sc22.pdf, recently added to smurf (Berry et al., 2005; Chapin et al., 2013). The reduction process is described in detail by Kwon et al. (2018). The output Stokes , and maps are gridded to 4′′ pixels and are calibrated in mJy/beam. The output vectors are debiased using the mean of their and variances to remove statistical biasing in regions of low signal-to-noise.
Our final map has a FWHM resolution of 14.1′′ (0.12 pc; AU), a diameter of 12′ and an RMS noise level of 0.9 mJy/beam in Stokes and intensity on 14.1′′ pixels.
3 Results
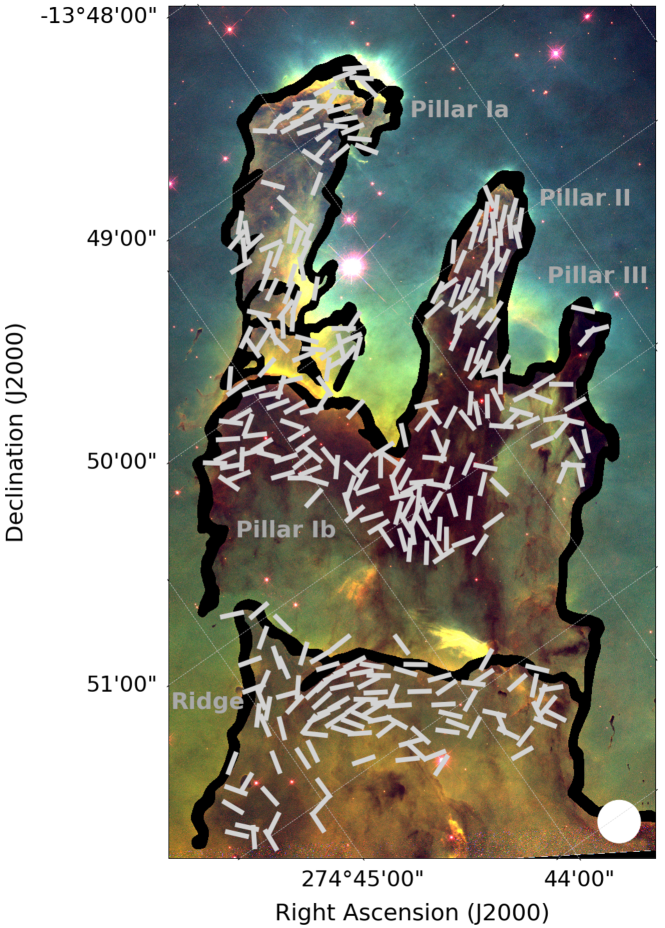
Figure 1 shows the observed B-field morphology in the Pillars. We detect Pillars I, II and the material between their bases (the ‘Ridge’) in polarized light, and marginally detect Pillar III. The B-field clearly runs along the length of the pillars, apparently turning at the tips of the pillars (best seen in the head of Pillar I). ‘Pillar I’ has two separate components: Pillar Ia (north-west), located further along the line of sight than II and III, behind the source of ionizing photons; and Pillar Ib (south-east), approximately equidistant with II and III (Pound, 1998; McLeod et al., 2015). The apparent change in field direction seen between Pillars Ia and Ib represents different field directions in the two pillars.
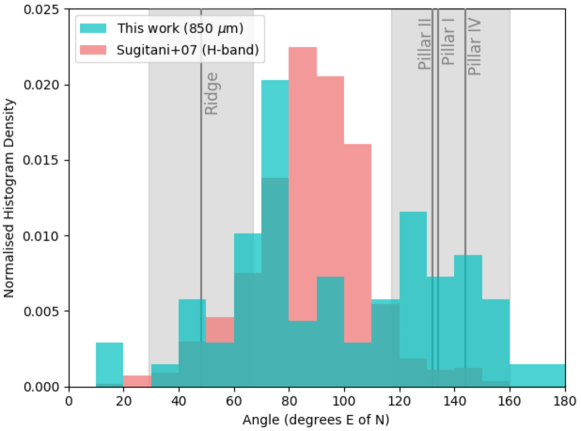
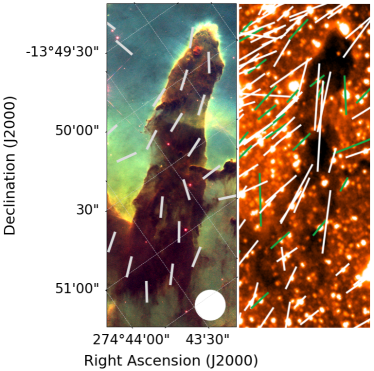
The B-field geometry in the pillars is significantly different to that in the surrounding photoionized region, as measured using near-infrared extinction polarimetry (Sugitani et al., 2007), as shown in Figure 2. The near-infrared vectors vary smoothly across the photoionized region, producing a singly-peaked distribution (at east of north). The B-field in the dense gas shows more complex behaviour, with field lines running roughly parallel to the length of the pillars. The B-field distribution in the dense gas is bimodal, peaking at (head of Ia, Ib, base of IV, Ridge) and (length of Ia, II, IV), compared to mean pillar directions of in I, in II, in IV, and in the Ridge. The B-field vectors observed in Pillar II – upon which our subsequent analysis focusses – are shown in detail in Figure 3. The near-infrared polarization vectors observed by Sugitani et al. (2007) in the vicinity of Pillar II are shown alongside.
3.1 B-field strength
We estimated the plane-of-sky B-field strength in Pillar II – the most well-defined pillar, with velocity-coherent structure and a linear plane-of-sky morphology – using the Chandrasekhar-Fermi method (Chandrasekhar & Fermi, 1953).
The Chandrasekhar-Fermi (CF) method provides an estimate of the plane-of-sky B-field strength by assuming that the variation in B-field around the mean field direction represents distortion of the B-field lines by non-thermal motions in the gas. The plane-of-sky field strength () is given by
| (1) |
where is the gas density, is the non-thermal gas velocity dispersion, is the standard deviation in polarization angle about the mean field direction, and is a factor of order unity that accounts for variation in the field on scales smaller than the beam. We take throughout (Ostriker et al., 2001; Crutcher et al., 2004). The second form of the expression takes number density of molecular hydrogen () to be in cm-3, FWHM non-thermal gas velocity dispersion () to be in km s-1, and to be in degrees (Crutcher et al., 2004).
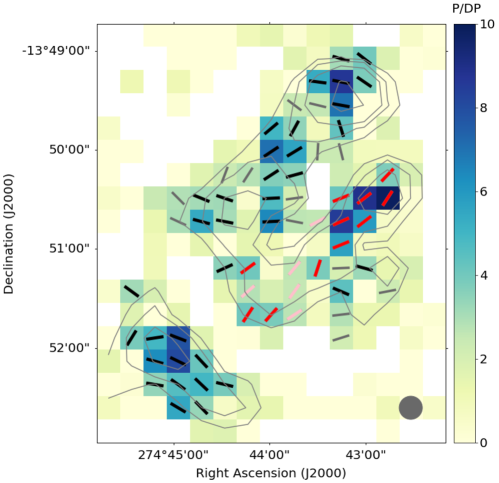
We binned the data to 14.1-arcsec resolution (statistically-independent pixels), and selected pixels with SNR in total intensity of associated with Pillar II. Of these, 16 have SNR in polarization fraction of , and 11 have . In order to mitigate against small sample size effects potentially introduced by using only the sample, we found the weighted standard deviations of both samples. The sample has a weighted dispersion in angle of , while the sample has a very similar . We thus adopt as being a representative value. We assume that all dispersion in the position angles of the vectors associated with the pillar represents dispersion about a uniform mean field direction. As the measured angular dispersion is greater than the uncertainty on angle in our vectors, it is not necessary to correct the angular dispersion for measurement uncertainty (Pattle et al., 2017). The values of our data for 14.1-arcsec pixels are shown in Figure 4.
We took the gas density in the pillar to be cm-3 (R05), and the FWHM gas velocity dispersion to be in the range km s-1, as measured by Wh99 in various dense gas tracers. These linewidths are highly supersonic (Wh99), and so the correction for the thermal component is negligible.
We thus estimated a plane-of-sky B-field strength of G in Pillar II. This value is intermediate between the B-field strengths of G observed in relatively unperturbed gas in low-mass star-forming regions (Crutcher, 2012), and of G observed in massive, gravitationally unstable structures in high-mass star formation sites (e.g. Curran & Chrysostomou 2007; Hildebrand et al. 2009; Pattle et al. 2017).
4 Discussion
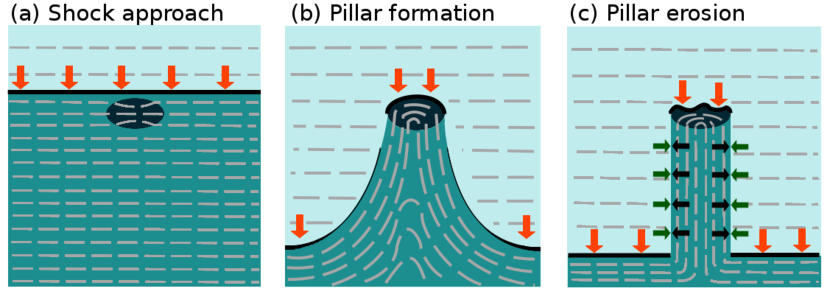
Simulations of photoionized regions suggest that B-field orientation is largely unchanged by the free passage of a plane-parallel shock front (Henney et al., 2009). Hence, we assume that the B-field in the photoionized region is representative of the B-field direction in the unshocked gas – approximately parallel to the shock front. For a weak initial B-field, field lines are predicted to become aligned parallel to the pillar’s length in the pillar itself, while remaining approximately perpendicular in the surrounding photoionized region (Wi07; Mackey & Lim 2011, hereafter ML11). This prediction results from otherwise quite different scenarios of magnetized pillar formation.
Wi07 finds that, in two dimensions, when a shock propagates into a dense medium ( cm-3) in which a denser core ( cm-3) is embedded, a pillar forms behind the core, and the weak, plane-parallel B-field in the dense medium is compressed. Thus, the B-field strength is enhanced by pillar formation, with the field ‘bowing’ into the material behind the pillar. The pillar has a density of a few cm-3, while the surrounding ionized material has a density cm-3. (The pillar head has higher density.) Arthur et al. (2011) find similar behaviour in three-dimensional simulations of expanding Hii regions, although with lower resolution.
ML11 find that when a shock impinges on a set of approximately co-linear dense globules embedded in a much lower-density medium ( cm-3; c.f. Mackey & Lim 2010) threaded by a weak, plane-parallel B-field, a pillar-like feature forms behind the globules due to radiation-driven implosion and the rocket effect (Oort & Spitzer, 1955). These effects orient the B-field along the length of the forming pillar on timescales kyr.
Wi07 and M11 agree that a strong plane-parallel initial B-field should deviate significantly from its initial orientation only in the pillar head (see also Henney et al. 2009). Our results do not match this scenario, strongly suggesting that the B-field in M16 was dynamically unimportant in the formation of the Pillars.
ML11 predict a B-field strength in the material around the pillars of G, but do not quantitatively predict the B-field strength inside the pillars. Our plane-of-sky B-field is in the ML11 ‘strong-field’ regime, which they exclude for M16. It is not clear how the gas compression necessary to increase the B-field could occur in this model. (Henney et al. (2009) predict volume-averaged B-field strengths to remain approximately constant with time within pillars formed behind individual globules.) ML11 also show a B-field which while broadly orientated parallel to the pillar’s length shows considerable disorder, whereas our observations show an ordered (albeit not well-resolved) B-field along the length of the Pillars.
The Pillars are anchored to a larger cloud (Hester et al., 1996), similar to the Wi07 scenario. Moreover, the Wi07 simulations show the B-field compression necessary to significantly strengthen an initially dynamically unimportant field, albeit qualitatively and two-dimensionally. We thus consider the Wi07 scenario to be broadly more consistent with our observations, and so illustrate it in Figure 5. However, both mechanisms could be involved in creating the observed B-field, and neither model quantitatively predicts B-field strength inside the pillars. Detailed, three-dimensional, quantitative modelling of the B-field inside photoionized columns is needed to fully distinguish between these mechanisms.
4.1 Pressure balance
Magnetic pressure is given by . Our measured plane-of-sky B-field, G, implies K cm-3. R05 give an ablation pressure on the heads of the pillars of K cm-3, an order of magnitude higher than our inferred . This suggests that the B-field cannot support the pillars against longitudinal erosion by the shock front, unless the field is compressed in the pillar heads (which are not resolved by our observations).
The effective gas pressure within the Pillars is , where is the effective gas temperature and is number density of particles. Taking cm-3 and K (Wh99), K cm-3, an order of magnitude lower than our . However, Wh99 and Wi01 argue that non-thermal gas motions create an effectively hydrostatic pressure within the Pillars. The Wh99 FWHM gas velocity dispersion range km s-1 thus represents an effective sound speed km s-1 and so, for a mean molecular weight , K cm-3, very comparable to our inferred . (This result follows naturally from the assumptions of the CF analysis.)
Hester et al. (1996) argue that atomic hydrogen number density cm-3 in the M16 photoionized region. Simulations take cm-3 (assumed by Wi01 and ML11; predicted by Wi07). Using cm-3 (assuming and that the number fraction of helium atoms is small), and taking K (Hester et al., 1996; García-Rojas et al., 2006), this implies an external gas pressure K cm-3 on the Pillars. Using cm-3, K cm-3, still an order of magnitude lower than our and values.
Higgs et al. (1979) find a non-thermal velocity dispersion in the photoionized gas of M16 of km s-1. If these non-thermal motions create a hydrostatic pressure on the Pillars, then km s-1 in the photoionized region, equivalent to K if in the ionized material (consistent with the value we use in the molecular gas). For cm-3, this implies K cm-3, comparable to our inferred internal .
The above analysis assumes a uniform-density, i.e. non-self-gravitating, pillar. Pillar II has radius pc, and so line mass M⊙ pc-1, assuming cylindrical symmetry (taking and cm-3). If non-thermal gas motions within the pillars create hydrostatic pressure, the critical line mass (Stodólkiewicz 1963; Ostriker 1964) is
| (2) |
For km s-1, M⊙ pc-1, comparable to the observed . Thus, there may be some concentration of mass towards its axis, somewhat lowering at the Hii region boundary. However, the B-field will provide significant support against radial gravitational collapse, with the observed B-field geometry resisting radial motion of material.
We note that these estimates are accurate only to order of magnitude. Our results broadly suggest that the pillar walls are in approximate pressure equilibrium, with and supporting against , and also that, contrary to common assumptions, the pillar’s self-gravity is non-negligible. Both and require a non-thermal component in order to be comparable to our inferred . Other sources of external pressure could include ram pressure due to flow of material across the ionization front into the pillar (e.g. Henney et al. 2009).
4.2 The Alfvén velocity
Our favoured scenario requires (a) the flux-frozen (infinite conductivity) approximation (Alfvén, 1942; Crutcher, 2012) to hold (neutral and ionized material are collisionally coupled; flow across field lines is forbidden), and (b) the pillars to form faster than the compressed B-field can relax to a lower-energy configuration, i.e. the photoionized region must expand faster than the Alfvén velocity (; Alfvén 1942). The photoionized region is expanding at a rate of km s-1 (Wi01; McLeod et al. 2015). For a representative B-field strength of G and cm-3 in the pillars, km s-1. Since in flux-frozen plasma, this value should apply throughout the pillars’ lifetimes, suggesting that they could have formed too quickly for the B-field to react, allowing the observed, highly pinched, geometry to form (see Figure 5).
The (flux-frozen) B-field geometry should allow longitudinal motion of material along the pillars, but strongly resist motion across the pillars that would lead to radial collapse. This suggests that the predicted evolution of the pillars into disconnected cometary globules (Bertoldi & McKee, 1990) may be considerably slowed by the effects of the B-field geometry.
5 Summary
We have observed the dense gas of the Pillars of Creation in M16 in 850m polarized light using the POL-2 polarimeter on the JCMT. We find that the B-field in the Pillars is ordered, running along the length of the pillars, with a plane-of-sky field strength of G, estimated using the Chandrasekhar-Fermi method. The observed morphology is consistent with the field being dynamically negligible in the Pillars’ formation. However, the current B-field strength suggests that magnetic pressure provides significant support against both gravitational and pressure-driven radial collapse of the pillars, and may be slowing the Pillars’ evolution into cometary globules. We hypothesize that the persistence of such photoionized columns as objects connected to their parent molecular cloud may be related to the geometry of their B-fields, and specifically to the relative orientation of the B-fields in the pillars and their surrounding photoionized regions. The BISTRO project is currently surveying B-fields in the dense gas of many nearby high-mass star-forming regions, thus allowing further testing of this hypothesis in the immediate future.
References
- Alfvén (1942) Alfvén, H. 1942, Nature, 150, 405, doi: 10.1038/150405d0
- Arthur et al. (2011) Arthur, S. J., Henney, W. J., Mellema, G., de Colle, F., & Vázquez-Semadeni, E. 2011, MNRAS, 414, 1747
- Astropy Collaboration et al. (2013) Astropy Collaboration, Robitaille, T. P., Tollerud, E. J., et al. 2013, A&A, 558, A33, doi: 10.1051/0004-6361/201322068
- Berry et al. (2005) Berry, D. S., Gledhill, T. M., Greaves, J. S., & Jenness, T. 2005, in Astronomical Society of the Pacific Conference Series, Vol. 343, Astronomical Polarimetry: Current Status and Future Directions, ed. A. Adamson, C. Aspin, C. Davis, & T. Fujiyoshi, 71
- Bertoldi & McKee (1990) Bertoldi, F., & McKee, C. F. 1990, ApJ, 354, 529, doi: 10.1086/168713
- Bonatto et al. (2006) Bonatto, C., Santos, Jr., J. F. C., & Bica, E. 2006, A&A, 445, 567
- Chandrasekhar & Fermi (1953) Chandrasekhar, S., & Fermi, E. 1953, ApJ, 118, 113
- Chapin et al. (2013) Chapin, E. L., Berry, D. S., Gibb, A. G., et al. 2013, MNRAS, 430, 2545
- Crutcher (2012) Crutcher, R. M. 2012, ARA&A, 50, 29
- Crutcher et al. (2004) Crutcher, R. M., Nutter, D. J., Ward-Thompson, D., & Kirk, J. M. 2004, ApJ, 600, 279
- Curran & Chrysostomou (2007) Curran, R. L., & Chrysostomou, A. 2007, MNRAS, 382, 699
- Currie et al. (2014) Currie, M. J., Berry, D. S., Jenness, T., et al. 2014, in Astronomical Society of the Pacific Conference Series, Vol. 485, Astronomical Data Analysis Software and Systems XXIII, ed. N. Manset & P. Forshay, 391
- Dufton et al. (2006) Dufton, P. L., Smartt, S. J., Lee, J. K., et al. 2006, A&A, 457, 265
- Friberg et al. (2016) Friberg, P., Bastien, P., Berry, D., et al. 2016, Proc. SPIE, 9914, 991403
- García-Rojas et al. (2006) García-Rojas, J., Esteban, C., Peimbert, M., et al. 2006, MNRAS, 368, 253, doi: 10.1111/j.1365-2966.2006.10105.x
- Henney et al. (2009) Henney, W. J., Arthur, S. J., de Colle, F., & Mellema, G. 2009, MNRAS, 398, 157, doi: 10.1111/j.1365-2966.2009.15153.x
- Hester et al. (1996) Hester, J. J., Scowen, P. A., Sankrit, R., et al. 1996, AJ, 111, 2349
- Higgs et al. (1979) Higgs, L. A., Doherty, L. H., MacLeod, J. M., & Terzian, Y. 1979, AJ, 84, 77
- Hildebrand et al. (2009) Hildebrand, R. H., Kirby, L., Dotson, J. L., Houde, M., & Vaillancourt, J. E. 2009, ApJ, 696, 567
- Hillenbrand et al. (1993) Hillenbrand, L. A., Massey, P., Strom, S. E., & Merrill, K. M. 1993, AJ, 106, 1906
- Holland et al. (2013) Holland, W. S., Bintley, D., Chapin, E. L., et al. 2013, MNRAS, 430, 2513
- Kwon et al. (2018) Kwon, J., Doi, Y., Tamura, M., et al. 2018, arXiv preprints, arXiv:1804.09313
- Mackey & Lim (2010) Mackey, J., & Lim, A. J. 2010, MNRAS, 403, 714
- Mackey & Lim (2011) —. 2011, MNRAS, 412, 2079
- McLeod et al. (2015) McLeod, A. F., Dale, J. E., Ginsburg, A., et al. 2015, MNRAS, 450, 1057
- Oliveira (2008) Oliveira, J. M. 2008, in Handbook of Star Forming Regions, Volume II, ed. B. Reipurth (ASP Monograph Series), 599
- Oort & Spitzer (1955) Oort, J. H., & Spitzer, Jr., L. 1955, ApJ, 121, 6, doi: 10.1086/145958
- Ostriker (1964) Ostriker, J. 1964, ApJ, 140, 1056
- Ostriker et al. (2001) Ostriker, E. C., Stone, J. M., & Gammie, C. F. 2001, ApJ, 546, 980
- Pattle et al. (2017) Pattle, K., Ward-Thompson, D., Berry, D., et al. 2017, ApJ, 846, 122
- Pound (1998) Pound, M. W. 1998, ApJ, 493, L113, doi: 10.1086/311131
- Ryutov et al. (2005) Ryutov, D. D., Kane, J. O., Mizuta, A., Pound, M. W., & Remington, B. A. 2005, Ap&SS, 298, 183
- Spitzer (1954) Spitzer, Jr., L. 1954, ApJ, 120, 1, doi: 10.1086/145876
- Stodólkiewicz (1963) Stodólkiewicz, J. S. 1963, Acta Astron., 13, 30
- Strömgren (1939) Strömgren, B. 1939, ApJ, 89, 526
- Sugitani et al. (2007) Sugitani, K., Watanabe, M., Tamura, M., et al. 2007, PASJ, 59, 507
- Ward-Thompson et al. (2017) Ward-Thompson, D., Pattle, K., Bastien, P., et al. 2017, ApJ, 842, 66
- White et al. (1999) White, G. J., Nelson, R. P., Holland, W. S., et al. 1999, A&A, 342, 233
- Williams (2007) Williams, R. J. R. 2007, Astrophysics and Space Science Proceedings, 1, 129
- Williams et al. (2001) Williams, R. J. R., Ward-Thompson, D., & Whitworth, A. P. 2001, MNRAS, 327, 788
- Zinnecker & Yorke (2007) Zinnecker, H., & Yorke, H. W. 2007, ARA&A, 45, 481, doi: 10.1146/annurev.astro.44.051905.092549