Subdominant -wave interaction in superconducting CaKFe4As4?
Abstract
We report inelastic light scattering results on the stoichiometric and fully ordered superconductor CaKFe4As4 as a function of temperature and light polarization. In the energy range between 10 and 315 cm-1 (1.24 and 39.1 meV) we observe the particle-hole continuum above and below the superconducting transition temperature and 7 of the 8 Raman active phonons. The main focus is placed on the analysis of the electronic excitations. Below all three symmetries projected with in-plane polarizations display a redistribution of spectral weight characteristic for superconductivity. The energies of the pair-breaking peaks in and symmetry are in approximate agreement with the results from photoemission studies. In symmetry the difference between normal and superconducting state is most pronounced, and the feature is shifted downwards with respect to those in and symmetry. The maximum peaking at 134 cm-1 (16.6 meV) has a substructure on the high-energy side. We interpret the peak at 134 cm-1 in terms of a collective Bardasis-Schrieffer (BS) mode and the substructure as a remainder of the pair-breaking feature on the electron bands. There is a very weak peak at 50 cm-1 (6.2 meV) which is tentatively assigned to another BS mode.
pacs:
74.70.Xa, 74.20.Mn, 74.25.ndI Introduction
CaKFe4As4 is among the few iron-based compounds which are superconducting at high transition temperature at stoichiometry Iyo et al. (2016) since the Ca and K atoms form alternating intact layers as shown in Fig. 1. The high degree of order allows one to get as close to the intrinsic properties of the material class as possible since the effects of disorder are expected to be negligible or at least significantly smaller than in solid solutions such as Ba1-xKxFe2As2 or Ba(Fe1-xCox)2As2. For instance the residual resistivity ratio (RRR) reaches 15 and is much higher than for Ba(Fe1-xCox)2As2 and comparable or better than for Ba1-xKxFe2As2 Meier et al. (2016). Other transport and the thermodynamic properties Meier et al. (2016) highlight the similarities to optimally or overdoped Ba1-xKxFe2As2.
These similarities include the electronic structure, in particular the Fermi surfaces [Fig. 1 (c)] and the superconducting energy gaps Mou et al. (2016). The gaps were found to be rather isotropic on the individual bands having values of , , and on the three hole bands (, , ) and the electron band (), respectively. The good nesting observed between the and bands was considered to support -wave interband pairing Mou et al. (2016); Biswas et al. (2017); Yang et al. (2017) as proposed earlier for the iron-based materials in general Mazin et al. (2008).
Since there is also nesting among the electron bands one can expect a competing pairing interaction with -wave symmetry as a subleading instability Hirschfeld (2016). Indications thereof were found recently in Raman scattering experiments on Ba1-xKxFe2As2 Kretzschmar et al. (2013); Böhm et al. (2014, 2017). The subleading channel manifests itself as a narrow line below the gap edge given that the gap is clean as, e.g., in Ba1-xKxFe2As2 Bardasis and Schrieffer (1961); Monien and Zawadowski (1990); Scalapino and Devereaux (2009). The bound state has its origin in a phase fluctuation of the condensate of Cooper pairs. The experimental identification of this excitation as a Bardasis-Schrieffer (BS) exciton rests on the shape of the line, its temperature dependence and the spectral weight transfer from the pair-breaking feature to the in-gap mode as described in detail in Refs. Böhm et al., 2014, 2017.
Given its nearly clean gap and the high crystal quality, CaKFe4As4 is an excellent candidate for scrutinizing the superconducting properties of hole doped 122 systems. We aim at answering the question as to wether or not subleading channels can also be observed in systems other than Ba1-xKxFe2As2 and can be identified as generic.
II Experiment
Calibrated Raman scattering equipment was used for the experiments. The sample was attached to the cold finger of a He-flow cryostat. For excitation a diode-pumped solid state laser emitting at 575 nm (Coherent GENESIS MX-SLM 577-500) was used. The polarization of the incoming light was adjusted in a way that the light inside the sample had the proper polarization state. The absorbed power (inside the sample) was set at typically mW independent of polarization. By setting the polarizations of the incident and scattered photons the four symmetries , , , and of the D4h space group can be accessed. For the symmetry assignment we use the 1 Fe unit cell [see Fig. 1 (b) and (c)] since the density of states at the Fermi energy is nearly entirely derived from Fe orbitals. The related projections in the first Brillouin zone (BZ) are visualized in Fig. A1 of Appendix A. In this work the focus is placed on low energies, where is negligibly small. The polarization combinations , , and almost exclusively project the , , and symmetries as desired. Here and are horizontal and vertical, respectively, in the laboratory system. Note that the out-of-phase vibration of the Fe atoms appears in symmetry in the 1 Fe unit cell rather than in symmetry of the crystallographic unit cell hosting two Fe atoms per Fe2As2 plane. For more details see section B. The spectra are represented as response functions which are obtained by dividing the measured cross section by the thermal Bose factor . is an experimental constant.
The CaKFe4As4 single crystals were grown from the FeAs flux and characterized thoroughly as described by Meier and coworkers Meier et al. (2016, 2017). The value of K we found here is in the range K determined by Meier et al. (see Fig. C in Appendix A3). The crystal structure of CaKFe4As4 is very similar to that of AFe2As2 systems [cf. Fig. 1 (a)] and belongs to the tetragonal space group. Since CaKFe4As4 has alternating Ca and K planes between the Fe2As2 layers the point group is simple-tetragonal () Iyo et al. (2016) rather than the body-centered tetragonal () as BaFe2As2 [Rotter et al., 2008].
III Results
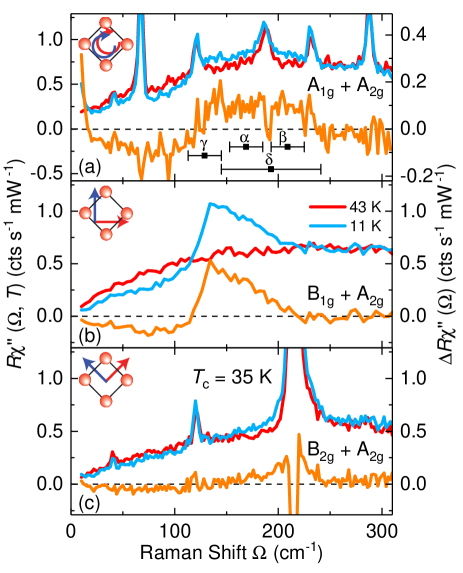
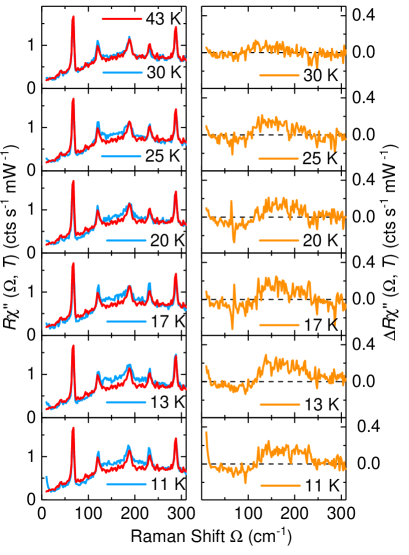
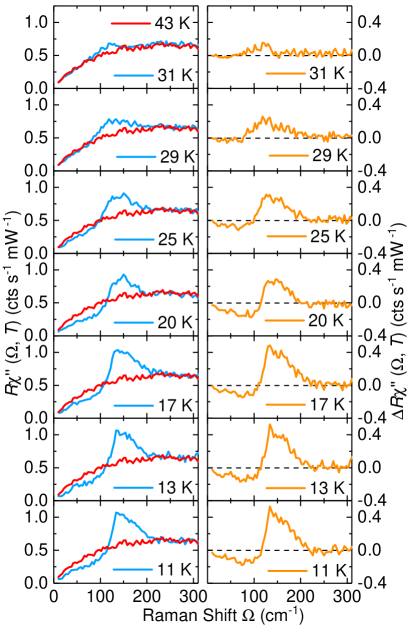
Fig. 2 shows the normal (red) and superconducting (blue) Raman spectra of CaKFe4As4 at the three polarization configurations (a) , (b) , and (c) . The sample is rotated by 45∘ with respect to the orientation in Figs. 1 and A1 in order to suppress any -axis projection in the spectra ( in the laboratory system). Superimposed on the particle-hole continua we observe six and four phonons in and polarization, respectively Scholz (2017) which will be discussed in Appendix B. As intended there are no phonons in configuration, and the spectrum in the normal state is completely smooth to within the experimental error. The structure-less shape indicates that there is no polarization leakage and, more importantly, that there is no defect-induced scattering from phonons highlighting the high crystal quality.
We focus now exclusively on the electronic continua.
To this end we also plot the difference spectra,
| (1) |
(orange in Fig. 2) along with the raw data of each polarization configuration. In the difference spectra temperature-independent structures such as (most of) the phonons and the presumably weak and temperature-independent luminescence contributions are eliminated. In this way the changes induced by superconductivity are highlighted.
All spectra show the typical changes upon entering the superconducting state: (i) The opening of the gap induces a suppression of the intensity below a cross-over energy of for , , and symmetry, respectively. In this range (orange) is negative. (ii) The intensity piles up above due to a coherent superposition of pair-breaking and Bogoliubov quasiparticle excitations across the gap . The amplitude of the redistribution is small in and symmetry [Fig. 2 (a) and (c) and Figs. A4 and A6] but pronounced in symmetry. [Fig. 2 (b) and Fig. A5]. In the response [Fig. 2 (a)] the signal at is enhanced because of surface layers of accumulating residual gas molecules at low temperature (see Fig. A4) and the insufficient suppression of the elastically scattered light in the case of parallel light polarizations ( here).
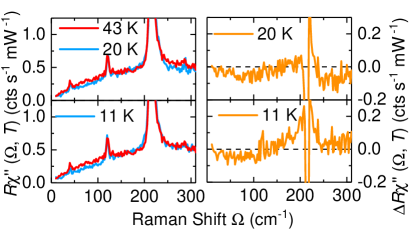
The first striking observation is the nearly symmetry-independent cross-over energy where the normal (red) and superconducting (blue) spectra intersect each other or where changes sign. Yet, the intensity for does not vanish entirely as expected for a clean gap but is only reduced. No additional structures are observed in the and spectra while a weak hump appears at approximately 50 cm-1 [see Fig. 2 (b) and arrows in Fig. 3 (b) to (f)] in symmetry. It appears also at elevated temperatures as shown in Fig. A5 and is therefore considered a robust feature.
Second, whereas the normal and the superconducting spectra merge at similar energies close to cm-1 in all symmetries the distribution of spectral weight in the range varies substantially. In none of the symmetries the pair-breaking features display the typical shape. The pair-breaking maximum in symmetry is found at approximately 215 cm-1 right underneath the Fe phonon. The negative intensity at 215 cm-1 shows that the phonon is renormalized below , and an influence of this renormalization on the electronic features cannot be excluded. However, the gap below 130 cm-1 indicates the presence of an intensity redistribution below . In symmetry a wide plateau is observed between and . Finally in symmetry, a pronounced peak is found at 135 cm-1 above which the intensity decays. Upon studying various temperatures a secondary maximum at about 165 cm-1 can be resolved as shown in Fig. A5 in the .
IV Discussion
The main purpose of this section is a balanced discussion of the possible interpretations of the electronic Raman spectra presented in section III. Can the spectra be interpreted exclusively in terms of pair-breaking or are collective modes, similarly as in Ba1-xKxFe2As2, necessary for a more consistent explanation?
IV.1 Gap energies
Using yellow excitation we find a strong redistribution of spectral weight in symmetry similarly as in a simultaneous Raman study using red photons Zhang et al. (2018) (Note that and are interchanged in these studies.) With yellow photons the redistribution can be observed in all three symmetry channels. As already noticed earlier this difference in the experimental results may be traced back to orbital dependent resonance effects Böhm et al. (2017).
The highest pair-breaking energy in our study is observed in symmetry implying a maximal gap energy of cm-1. This energy corresponds to meV slightly higher than the largest gaps derived for the and bands, meV using angle-resolved photoemission spectroscopy (ARPES) Mou et al. (2016). 215 cm-1 coincides with the edge of the pair-breaking feature [see Fig. 2], and we conclude that the ARPES data slightly underestimate the gap energies found by Raman scattering as already observed for Ba1-xKxFe2As2 [Kretzschmar et al., 2013; Böhm et al., 2014]. Similarly, the lowest gap energy of meV is below 9.3 meV expected from the lower edge in the spectra. There are no structures in the and spectra which one could associate with the gap energy on the band, meV, obtained from ARPES. On this basis we conclude that the maximal gap energies derived from the and Raman spectra are in the same range of approximately as in Ba1-xKxFe2As2 close to optimal doping Böhm et al. (2014).
The question arises whether ARPES and Raman results are compatible with the selection rules. As shown in Fig. A1 all bands should be visible in symmetry with comparable weight upon neglecting resonance effects. In fact, all energies are represented in the spectra shown in Fig. 2 (a). Even if a Leggett mode contributes to the spectra, as suggested recently Cea and Benfatto (2016), this conclusion survives since the Leggett modes are expected close to the maximal gap energies in the Fe-based systems. The spectra are less easily to be reconciled with this scenario since the gaps on the hole bands should be projected with a similar spectral weight as that of the electron band. Yet we find only a contribution from the largest gap. Although the overall intensity is very weak here the absence of contributions from the band cannot be explained by the variation of the peak height with [Devereaux and Hackl, 2007] or by applying the symmetry selection rules. Either a phenomenological treatment as for Ba1-xKxFe2As2 [Böhm et al., 2014] or a detailed resonance study needs to be performed which, however, is beyond the scope of this work.
Given that the single particle gap energies are by and large reproduced in the and spectra it is important to understand the spectra. As shown in Fig. 2 (c) the energies appearing there are well below those of the and spectra. This is particularly surprising as the bands are expected to be projected fully (and not marginally) in symmetry (see Fig. A1) as opposed to all hole bands. Thus, the argument that the strongest peak in the spectra results from the band can be discarded.
IV.2 Response
There is only one alternative scenario which reconciles the results observed in the three Raman active symmetries and the ARPES results: The spectra do not directly reflect gap energies but rather are shifted downward by final state interaction as discussed for Ba1-xKxFe2As2 in earlier work Kretzschmar et al. (2013); Böhm et al. (2014, 2017). The similarity can be observed directly by comparing the data in Fig. 3. The difference spectra as a function of temperature indicate that the peak has a robust shoulder on the high-energy side. The overall shape is surprisingly similar to the spectra of .
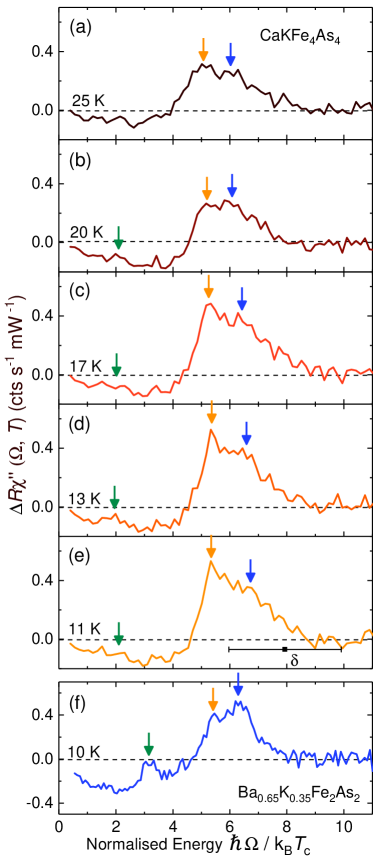
Following this reasoning we identify the maximum of the spectra at 135 cm-1 with a collective mode pulled off the maximal gap energy on the band due to a wave subleading interaction among the two electron bands predicted theoretically Scalapino and Devereaux (2009) and observed in Ba1-xKxFe2As2. The hump at approximately 165 cm-1 is then the remaining intensity of the pair-breaking peak on the band after switching on the final state interaction which induces a transfer of intensity from the pair-breaking peak into the bound state Monien and Zawadowski (1990); Scalapino and Devereaux (2009); Böhm et al. (2014). Only in this way the missing intensity in the range of can be explained consistently.
It is tempting to explain the faint peak close to 50 cm-1 () in terms of a second BS mode in a similar fashion as in Ba1-xKxFe2As2 Böhm et al. (2017). This would mean that the subdominant coupling is already very strong, and CaKFe4As4 is on the brink of a -wave instability. The very weak intensity of the peak argues in this direction since the BS mode is expected to vanish when -wave pairing wins. Yet, the vanishingly small intensity is also the Achilles heel of the argumentation, and a robust statement is possible only on the basis of a microscopic model, which includes the derivation of the eigenvectors of the subdominant pairing channels, as proposed for Ba1-xKxFe2As2 Böhm et al. (2017). Such an expensive theoretical treatment is beyond the scope of this experimental study.
V Conclusion
We investigated the recently discovered superconductor CaKFe4As4 with inelastic light scattering as a function of photon polarisation and temperature. Using yellow light (575 nm) superconducting features were found in , and symmetry.
A weak but well-defined pair-breaking feature is found at 215 cm-1 (corresponding to meV) in symmetry which is slightly above the largest gaps observed by ARPES for the and the bands Mou et al. (2016) and close to the energy where the normal and the superconducting spectra merge in all symmetry projections. This feature is also present in the spectra. In addition to the high-energy feature the intensity displays a plateau-like shape down to cm-1. Given the small discrepancies between the gap energies derived from the ARPES data and the Raman spectra one can conclude that the spectra reflect the entire range of gap energies of CaKFe4As4 even though the individual gap energies cannot be resolved.
In symmetry, the superconducting feature is centered at lower energy than in the two other symmetries. We interpret the sharp maximum at 135 cm-1 as a collective Bardasis-Schrieffer mode pulled off the maximal gap on the band similarly as in the sister compound . The shoulder at approximately 165 cm-1 is a remainder of the pair-breaking peak losing most of its intensity to the collective mode Scalapino and Devereaux (2009); Böhm et al. (2014). Whether or not the weak structure at 50 cm-1 is another BS mode with even stronger coupling cannot be decided with certainty because of the fading intensity. If this interpretation could be supported further CaKFe4As4 would be closer to a -wave instability than Ba1-xKxFe2As2. The smaller of CaKFe4As4 argues in this direction since a strong pairing channel frustrates the -wave ground state and reduces . Even without dwelling on the peak at 50 cm-1 we may conclude that CaKFe4As4 is a true sibling of Ba1-xKxFe2As2 Böhm et al. (2017) thus demonstrating that pairing fingerprints can be observed preferably in materials with clean gaps.
Acknowledgements
We acknowledge valuable discussions with G. Blumberg. The work was supported by the Friedrich-Ebert-Stiftung, the Transregional Collaborative Research Center TRR 80, and the Serbian Ministry of Education, Science and Technological Development under Project III45018. We acknowledge support by the DAAD through the bilateral project between Serbia and Germany (grant numbers 56267076 and 57142964). Work at Ames Laboratory was supported by the U.S. Department of Energy, Office of Basic Energy Sciences, Division of Materials Sciences and Engineering under Contract No. DE-AC02- 07CH11358. W.R.M. was supported by the Gordon and Betty Moore Foundation’s EPiQS Initiative through Grant No. GBMF4411.
Appendix A Raman Selection Rules
Using different combinations of light polarizations different parts of the Brillouin zone can be projected independently for particle-hole excitations Devereaux et al. (1994). The weighting factors for the three Raman-active in-plane symmetries are shown in Fig. A1. Here the linear vertices are displayed which are derived entirely on the basis of symmetry arguments. In symmetry we use the second order vertex which reflects the band structure better than the first order vertex because of the curvature of the hole and the electron bands Mazin et al. (2010); Böhm et al. (2014). (The zero-order vertex is a constant and entirely screened.)
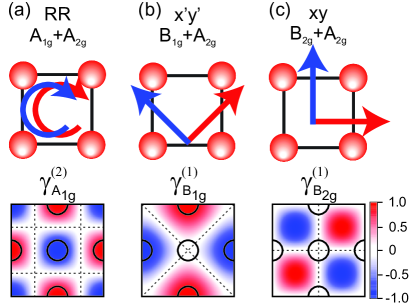
For the experiments the samples were mounted on the cold finger in a way that the crystallographic axes match the laboratory system (). Because of the large angle of incidence, the incoming photons having polarization or have the same finite projection on the -axis. Consequently, phonons, obeying and selection rules, are expected to appear in both and scattering configurations, whereas they are absent in configuration.
Appendix B Phonons
For the phonons it is more appropriate to use the crystallographic 2 Fe unit cell of CaKFe4As4 having symmetry as shown in Fig. 1. The orientation of the crystal in the experiment is displayed as an inset in Fig. A2. The energies of all phonon lines observed are collected in Table 1.
The strongest line that appears at 215 cm-1 in polarization is the out-of-phase -axis Fe vibration having the proper symmetry in the crystallographic (2 Fe) unit cell.
| pol | unit | |||||||
|---|---|---|---|---|---|---|---|---|
| cm-1 | 42 | 66 | 120 | 188 | 232 | 288 | ||
| meV | 5.21 | 8.18 | 14.9 | 23.3 | 26.7 | 28.8 | 35.7 | |
| cm-1 | 42 | 120 | 215 | 232 |
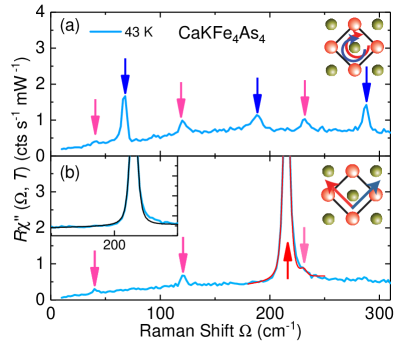
The in-phase -axis vibrations of the As atoms appear at 66 and 188 cm-1 in the spectra. The line at 288 cm-1 corresponds to the in-phase -axis vibrations of the Fe atoms. Three modes appear simultaneously with approximately the same intensity in and polarization both of which having the same finite projection of about 30% on the -axis of the incoming photons inside the crystal and are tentatively identified as three of the four modes expected to be Raman-active in the structure of CaKFe4As4. They are projected in and configuration thus have only approximately 10% of the full intensity. The mode at 232 cm-1 cannot be observed independently in the spectra since it is too close to the mode. We show an approximate decomposition in Fig. A2 (b). All phonons are shear modes with the Fe and As atoms moving parallel to the FeAs planes with different eigenvectors. In total one expects four modes Scholz (2017). The missing fourth mode is either too weak to be observable or outside the range we studied.
Appendix C Sample characterization
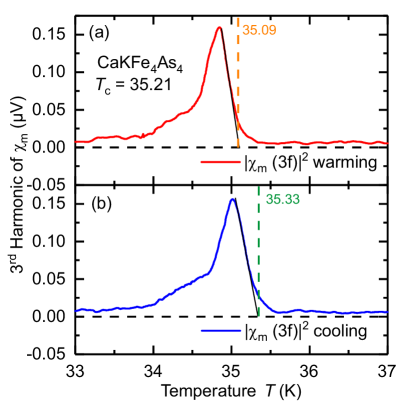
The transition temperature of CaKFe4As4 sample used for the experiments was determined via the temperature dependence of the nonlinear magnetic susceptibility which is very sensitive for sample inhomogeneities Raphael et al., 1998. Fig. A3 displays the results of the measurements on the samples used here for a cooling and a heating run.
As shown by Shatz and coworkers Shatz et al. (1993) the curves displays a nearly linear onset right below given that there is no dc field, the amplitude of the exciting ac field is small (typically ), and the superconducting transition is sharp (). Below peaks at an amplitude-dependent temperature and decays again. The extrapolation to zero of the linear part between the peak and can be identified with the midpoint of the transition obtained from the linear susceptibility. If is not negligible has a foot above the extrapolated value. The width of the foot indicates .
Upon measuring during cooling and heating with typical rates of K per min a small hysteresis of K results. We use the average of the two individual values, K, as the sample’s transition temperature. K can be derived from the foot of above . The transition temperature is identical to that of Ref.Meier et al. (2016). We cannot identify any secondary phases.
Appendix D Raw Data
The left panels of Figs. A4, A5, and A6 show the raw data (after division by the Bose factor) above and at various temperatures below for CaKFe4As4. The difference spectra according to Eq. (1) are shown in the right column.
References
- Iyo et al. (2016) Akira Iyo, Kenji Kawashima, Tatsuya Kinjo, Taichiro Nishio, Shigeyuki Ishida, Hiroshi Fujihisa, Yoshito Gotoh, Kunihiro Kihou, Hiroshi Eisaki, and Yoshiyuki Yoshida, “New-Structure-Type Fe-Based Superconductors: CaAFe4As4 ( K, Rb, Cs) and SrAFe4As4 ( Rb, Cs),” J. Am. Chem. Soc. 138, 3410–3415 (2016).
- Meier et al. (2016) W. R. Meier, T. Kong, U. S. Kaluarachchi, V. Taufour, N. H. Jo, G. Drachuck, A. E. Böhmer, S. M. Saunders, A. Sapkota, A. Kreyssig, M. A. Tanatar, R. Prozorov, A. I. Goldman, Fedor F. Balakirev, Alex Gurevich, S. L. Bud’ko, and P. C. Canfield, “Anisotropic thermodynamic and transport properties of single-crystalline ,” Phys. Rev. B 94, 064501 (2016).
- Mou et al. (2016) Daixiang Mou, Tai Kong, William R. Meier, Felix Lochner, Lin-Lin Wang, Qisheng Lin, Yun Wu, S. L. Bud’ko, Ilya Eremin, D. D. Johnson, P. C. Canfield, and Adam Kaminski, “Enhancement of the Superconducting Gap by Nesting in : A New High Temperature Superconductor,” Phys. Rev. Lett. 117, 277001 (2016).
- Biswas et al. (2017) P. K. Biswas, A. Iyo, Y. Yoshida, H. Eisaki, K. Kawashima, and A. D. Hillier, “Signature of multigap nodeless superconductivity in ,” Phys. Rev. B 95, 140505 (2017).
- Yang et al. (2017) Run Yang, Yaomin Dai, Bing Xu, Wei Zhang, Ziyang Qiu, Qiangtao Sui, Christopher C. Homes, and Xianggang Qiu, “Anomalous phonon behavior in superconducting : An optical study,” Phys. Rev. B 95, 064506 (2017).
- Mazin et al. (2008) I. I. Mazin, D. J. Singh, M. D. Johannes, and M. H. Du, “Unconventional Superconductivity with a Sign Reversal in the Order Parameter of LaFeAsO1-xFx,” Phys. Rev. Lett. 101, 057003 (2008).
- Hirschfeld (2016) Peter J. Hirschfeld, “Using gap symmetry and structure to reveal the pairing mechanism in fe-based superconductors,” C. R. Physique 17, 197 – 231 (2016), iron-based superconductors / Supraconducteurs base de fer.
- Kretzschmar et al. (2013) F. Kretzschmar, B. Muschler, T. Böhm, A. Baum, R. Hackl, Hai-Hu Wen, V. Tsurkan, J. Deisenhofer, and A. Loidl, “Raman-Scattering Detection of Nearly Degenerate -Wave and -Wave Pairing Channels in Iron-Based and Superconductors,” Phys. Rev. Lett. 110, 187002 (2013).
- Böhm et al. (2014) T. Böhm, A. F. Kemper, B. Moritz, F. Kretzschmar, B. Muschler, H.-M. Eiter, R. Hackl, T. P. Devereaux, D. J. Scalapino, and Hai-Hu Wen, “Balancing act: Evidence for a strong subdominant -wave pairing channel in ,” Phys. Rev. X 4, 041046 (2014).
- Böhm et al. (2017) T. Böhm, F. Kretzschmar, A. Baum, M. Rehm, D. Jost, R. Hosseinian Ahangharnejhad, R. Thomale, C. Platt, T. A. Maier, W. Hanke, B. Moritz, T. P. Devereaux, D. J. Scalapino, S. Maiti, P. J. Hirschfeld, P. Adelmann, T. Wolf, H.-H. Wen, and R. Hackl, “Microscopic pairing fingerprint of the iron-based superconductor ,” ArXiv e-prints (2017), arXiv:1703.07749 [cond-mat.supr-con] .
- Bardasis and Schrieffer (1961) A. Bardasis and J. R. Schrieffer, “Excitons and Plasmons in Superconductors,” Phys. Rev. 121, 1050–1062 (1961).
- Monien and Zawadowski (1990) H. Monien and A. Zawadowski, “Theory of Raman scattering with final-state interaction in high- BCS superconductors: Collective modes,” Phys. Rev. B 41, 8798–8810 (1990).
- Scalapino and Devereaux (2009) D. J. Scalapino and T. P. Devereaux, “Collective -wave exciton modes in the calculated Raman spectrum of Fe-based superconductors,” Phys. Rev. B 80, 140512 (2009).
- Meier et al. (2017) W. R. Meier, T. Kong, S. L. Bud’ko, and P. C. Canfield, “Optimization of the crystal growth of the superconductor from solution in the system,” Phys. Rev. Materials 1, 013401 (2017).
- Rotter et al. (2008) Marianne Rotter, Marcus Tegel, and Dirk Johrendt, “Superconductivity at 38 K in the Iron Arsenide (Ba1-xKx)Fe2As2,” Phys. Rev. Lett. 101, 107006 (2008).
- Scholz (2017) J.-R. Scholz, Raman Scattering Study of the Superconducting Pairing in , Master’s thesis, Technische Universität München (2017).
- Zhang et al. (2018) W.-L. Zhang, W. R. Meier, T. Kong, P. C. Canfield, and G. Blumberg, “High superconductivity in CaKFe4As4 in absence of nematic fluctuations,” ArXiv e-prints (2018), arXiv:1804.06963 [cond-mat.supr-con] .
- Cea and Benfatto (2016) T. Cea and L. Benfatto, “Signature of the Leggett mode in the Raman response: From to iron-based superconductors,” Phys. Rev. B 94, 064512 (2016).
- Devereaux and Hackl (2007) Thomas P. Devereaux and Rudi Hackl, “Inelastic light scattering from correlated electrons,” Rev. Mod. Phys. 79, 175 (2007).
- Devereaux et al. (1994) T. P. Devereaux, D. Einzel, B. Stadlober, R. Hackl, D. H. Leach, and J. J. Neumeier, “Electronic Raman scattering in high- superconductors: A probe of pairing,” Phys. Rev. Lett. 72, 396 (1994).
- Mazin et al. (2010) I. I. Mazin, T. P. Devereaux, J. G. Analytis, Jiun-Haw Chu, I. R. Fisher, B. Muschler, and R. Hackl, “Pinpointing gap minima in Ba(Fe0.94Co0.06)2As2 via band-structure calculations and electronic Raman scattering,” Phys. Rev. B 82, 180502 (2010).
- Raphael et al. (1998) M. P. Raphael, M. E. Reeves, and E. F. Skelton, “Nonlinear response of type II superconductors: A new method of measuring the pressure dependence of the transition temperature ,” Rev. Sci. Instrum. 69, 1451–1455 (1998).
- Shatz et al. (1993) S. Shatz, A. Shaulov, and Y. Yeshurun, “Universal behavior of harmonic susceptibilities in type-II superconductors,” Phys. Rev. B 48, 13871 (1993).