Long-Term Monitoring of Throughput in Las Cumbres Observatory’s Fleet of Telescopes
Abstract
The Las Cumbres Observatory operates a fleet of robotically controlled telescopes currently two 2m, nine 1m, and ten 0.4m telescopes, distributed amongst six sites covering both hemispheres. Telescopes of an aperture class are equipped with an identical set of optical imagers, and those data are subsequently processed by a common pipeline (BANZAI). The telescopes operate without direct human supervision, and assessing the daily and long-term scientific productivity of the fleet of telescopes and instruments poses an operational challenge.
One key operational metric of a telescope/instrument system is throughput. We present a method of long-term performance monitoring based on nightly science observations: For every image taken in matching filters and within the footprint of the PANSTARRS DR1 catalog we derive a photometric zeropoint, which is a good proxy for system throughput. This dataset of over data points enables us to answer questions about general throughput degradation trends, and how individual telescopes perform at the various sites. This particular metric is useful to plan the effort level for on-site support and to prioritize the cleaning and re-aluminizing schedule of telescope optics and mirrors respectively.
keywords:
Telescope operations, mirror reflectivity1 The Las Cumbres Observatory Fleet of Telescopes and the Operational Challenge
The Las Cumbres Observatory (LCOGT) operates a fleet of currently more than 20 telescopes, consisting of ten 0.4 meter, nine 1 meter, and two 2 meter telescopes at multiple sites across the globe[1]; an expansion of the network by additional five 1 meter class telescopes in the northern hemisphere is planned. The telescopes are located at well-established observatory sites which already provide service infrastructure111At LCOGT, telescope sites are identified by their nearest airport code (see Table 1), and we will follow that nomenclature throughout this paper.: Cerro Tololo Inter-American Observatory (CTIO) in Chile, South African Astronomical Observatory (SAAO) in Sutherland, Siding Spring observatory in Australia, Teide Observatory in Canary Islands, Spain, McDonald Observatory in the continental US, and at Haleakala Observatory on Maui. Ensuring scientific productivity in this globally distributed observatory is a multi-faceted challenge, where financial realities and the time overheads of international logistics need to be considered.
The maintenance and support situation for LCOGT is complicated since all telescopes operate autonomously, i.e., both nighttime and daytime operations of the network are based on computerized execution of observations without direct local or remote human supervision. The observing schedule for the entire observatory is dynamically generated in near real time to react to short term changes in the telescope network[2], e.g., due to weather closures or a camera failure. The sheer number of telescopes and the lack of human presence at the sites pose a challenge to understand the state of a facility and to discover problems of the telescope network. E.g., there is no daily walk-through of the facility as is typically practiced at larger single telescope facilities, and observatory staff’s interaction with the telescopes fully depends on remote sensing.
With the exception of the two 2 meter telescope sites (Haleakala and Siding Spring) where LCOGT staff are in residence, emergency maintenance and basic operational support are provided by the observatory’s site staff. The telescopes and site infrastructure are maintained and upgraded during dedicated service campaigns. Since the effort and cost for each maintenance campaign to a site are large — equipment and personnel need to be transported from the headquarters in Santa Barbara, CA, to each site — it is highly desirable to prioritize service tasks based on performance metrics that are relevant to the scientific productivity of the telescope network.
In this paper we describe how one specific metric, the throughput of a telescope system as measured by the photometric zeropoint, is used to understand the state of the telescope’s optics and to guide improvement and maintenance throughout the observatory.
| Location | Site code | #2m | #1m | #0.4m |
|---|---|---|---|---|
| Siding Spring, Australia | COJ | 1 | 2 | 2 |
| Sutherland, South Africa | CPT | 3 | 1 | |
| Teide, Spain | TFN | 2 | ||
| Cerro Tololo, Chile | LSC | 3 | 2 | |
| McDonald Observatory, USA | ELP | 1 | 1 | |
| Haleakala, Hawaii, USA | OGG | 1 | 2 | |
| Total: | 2 | 9 | 10 |
1.1 Maintenance of Optical Surfaces at LCOGT
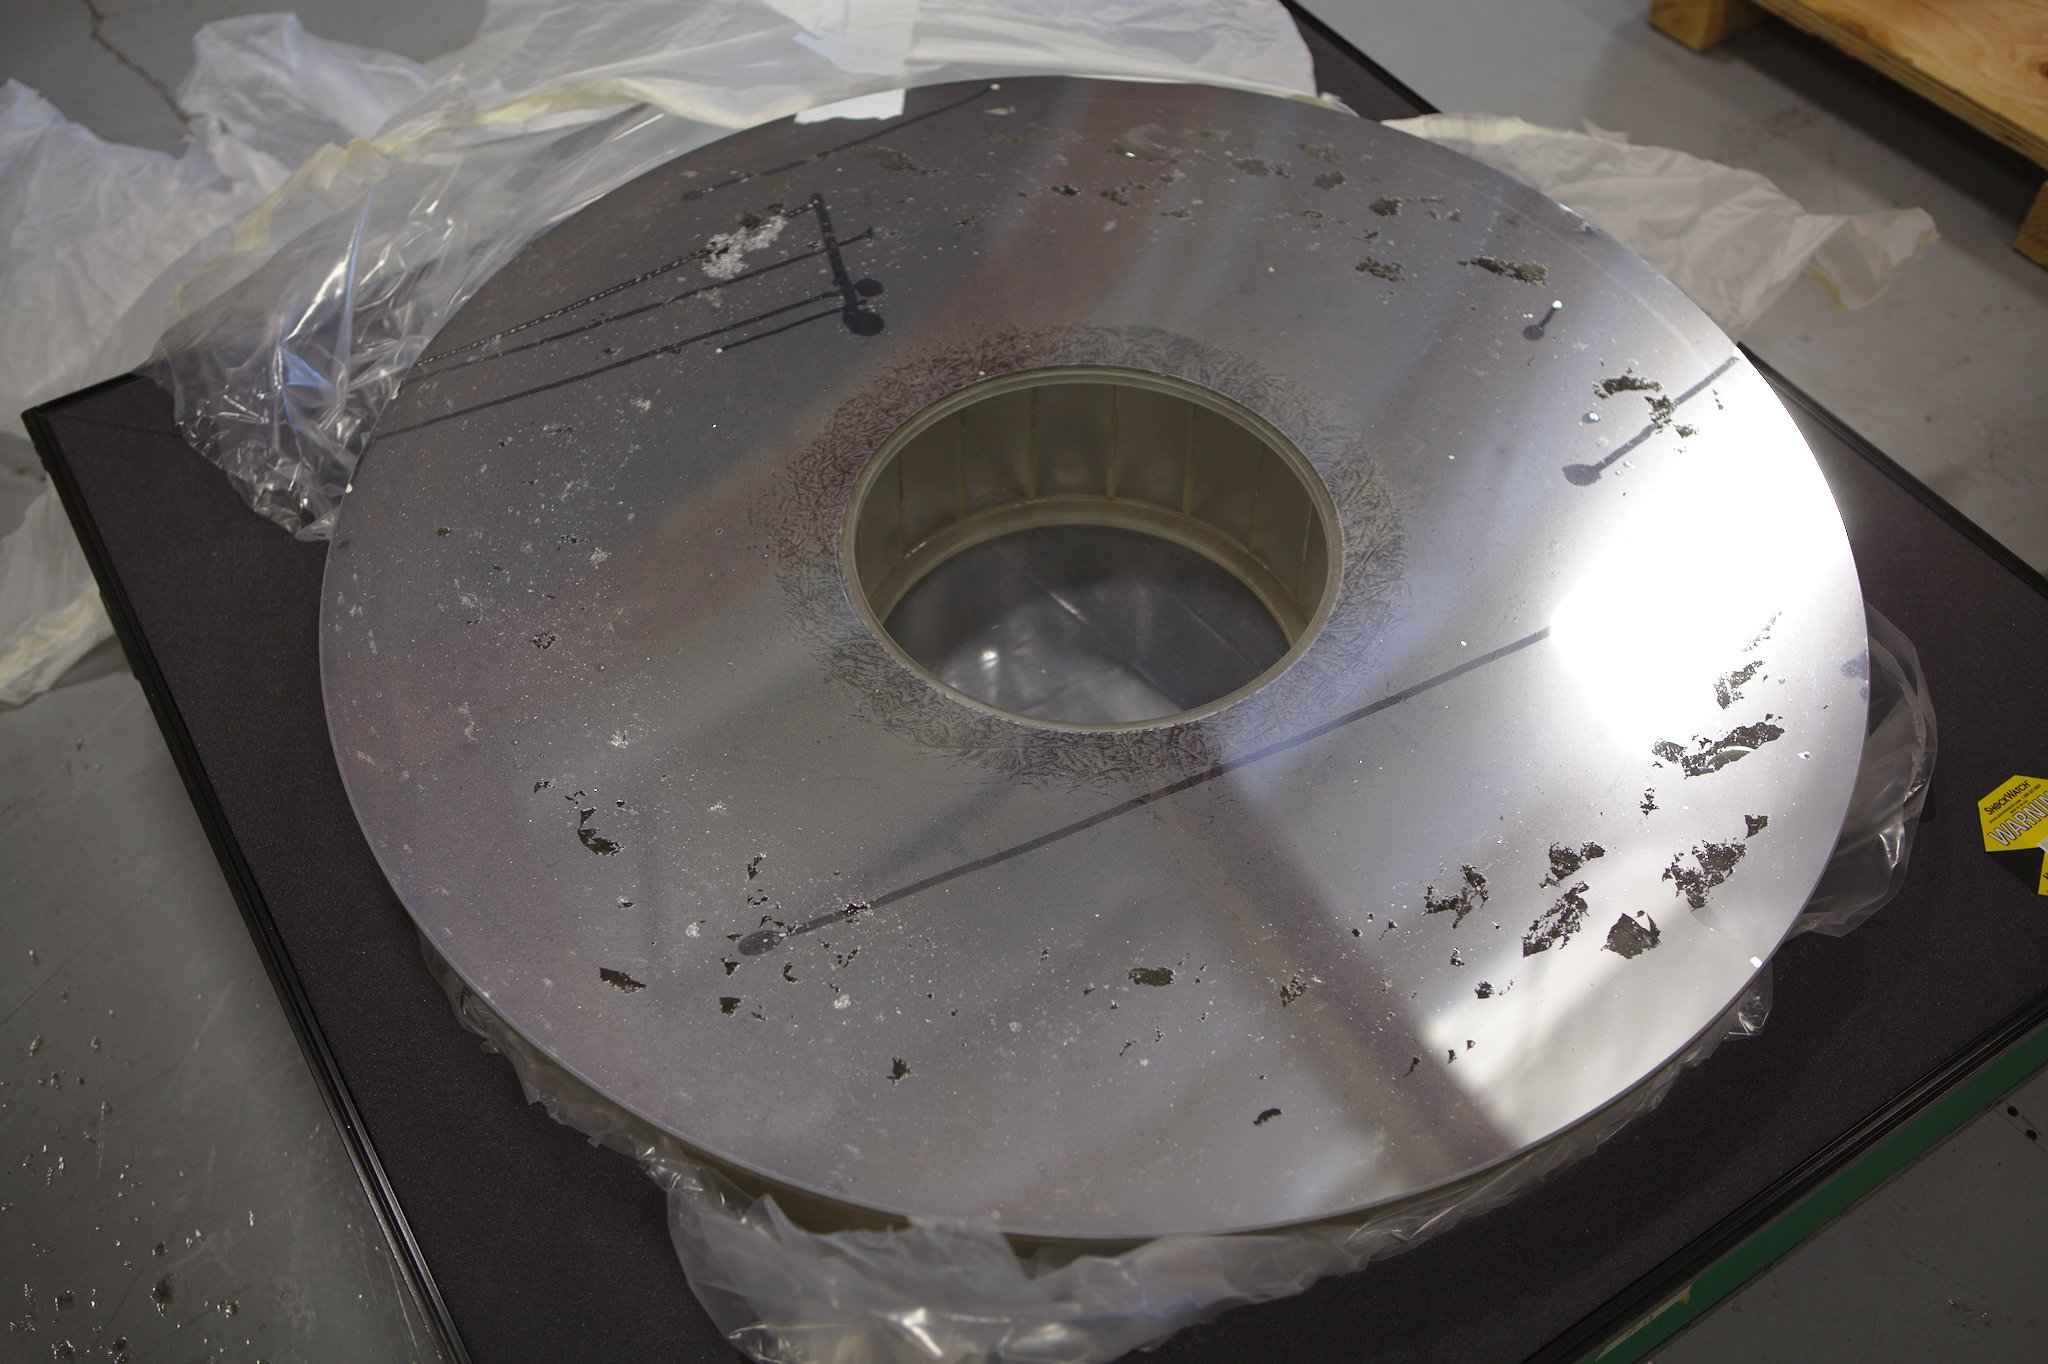
The mirrors of a telescope are a key factor in the scientific performance of an observatory. Their reflectance typically degrades over time due to their exposure to the environment. A dominant degradation mechanism is dust and pollen accumulation on the mirror surface which is usually addressed by CO2 snow cleaning or direct contact methods (e.g., wet wash with mild soap, adhesive films). The long-term degradation of optics is driven by the accumulation of scratches, dust permanently binding to the surface, and in worse cases, by the delamination of the aluminum coating itself. The latter is a particular problem for all deployed LCOGT mirrors, where the aluminum layer has peeled off and degraded over significant areas of the mirrors (Figure 1).
The mirrors of the 1 meter telescopes still use the original coating from their deployment in 2012 and 2013, i.e., at the time of this writing they are of the order of five to six years old. The coating on the two meter telescope’s primary and secondary mirrors at the COJ site (Siding Spring) are 5 and 16 years old, respectively. The primary mirror at the OGG site (Haleakala) was coated in 2017, after 8 years in service; the secondary was coated in 2014 with a protective overcoat.
Site staff administers CO2-snow cleaning of the mirror surfaces of the 1 meter and 2 meter telescopes on a roughly monthly basis, following locally adopted best practices. However, there is no widespread cleaning procedure established for the 0.4 meter’s corrector plates yet, although they accumulate dust as well. LCOGT is working currently on improving the cleaning protocol for all telescopes. In order to address the significantly degraded coating at the 1 meter and 2 meter telescopes, all mirrors are scheduled for recoating by the end of 2018. This is an enormous logistical effort given there are eleven such mirrors at multiple sties.
At the beginning of 2018 a project team was formed to complete the optics renewal for all 1 meter and 2 meter telescopes. Leveraging a quality-controlled coating company, a schedule was outlined to complete the removal, reassembly, and collimation of the network of telescopes. Revised existing procedures were tested at LCOGT’s headquarter, where personnel were trained to complete the work in the field. Collimation characterization criteria were developed to qualify the newly installed optics along with wavefront sensing equipment to validate the before and after condition of the telescopes. Upon completion of the ELP (McDonald Observatory) 1 meter telescope, the team is now formalizing the maintenance tasks for cleaning and monitoring the throughput of the network’s telescopes.
2 Measuring the photometric zeropoint in a homogeneous fleet of telescopes
Our interest is in using the photometric zeropoint measured in a science image as a proxy for the telescope and image system throughput, as it is standard practice at many observatories. An individual image’s photometric zeropoint measurement is impacted by many factors, such as attenuation by clouds, measurement errors, and instrument errors, and is hence of limited relevance. However, the long term trend in the photometric zeropoint of all images taken at a telescope is a meaningful proxy for the system’s efficiency.
On-sky throughput measurements in the past have often been limited to isolated observations of a few standard stars per year[3], or to nightly standard star observations[4]. We exploit the availability of well-calibrated photometric catalogs and access to a central data archive with homogeneously calibrated data to turn every exposure at an LCOGT telescope into a measurement of a telescope’s throughput. We have demonstrated this approach before for data from the One Degree Imager at the WIYN 3.5 meter telescope[5].
Each telescope is equipped with a primary scientific imaging camera (the imagers at the 1 and 2 meter telescopes are based on Fairchild CCD486 devices with a field of view of and respectively, the imagers at the 0.4 meter telescopes are commercial SBIG 6303 cameras with a field of view of ). The cameras have a comprehensive filter set, which includes a set in the Sloan Digital Sky Survey (SDSS) photometric system[6]. The 2 meter telescopes provide low resolution spectroscopy capability via the Floyds[1] spectrograph, whereas three of LCOGT’s 1 meter telescopes are equipped with high resolution Echelle spectrograph instruments (NRES)[7, 8].
All data taken at LCOGT’s telescopes are transferred via the Internet to a live storage located at the headquarters in Santa Barbara. The incoming imaging data are then processed daily with the BANZAI pipeline (Beautiful Algorithms to Normalize Zillions of Astronomical Images) [9]222https://github.com/LCOGT/banzai, which performs the standard CCD processing (crosstalk, overscan, bias, dark, and flat field correction), followed by the extraction of an object catalog from the image and cross-matching with existing catalogs to derive an astrometric solution via astrometry.net[10]. The object catalog is stored along with the final calibrated data product and then published in LCOGT’s online archive333https://archive.lco.global. Photometric calibration of images is not a part of standard processing.
To measure the photometric zeropoint in LCOGT’s images we have developed a program that crawls through BANZAI processed images from LCOGT’s on-site archive and derives a photometric zeropoint calibration for each image by cross-matching sources with the PANSTARRS DR1 photometric catalog[11]. For each BANZAI-processed image taken at any telescope, we determine the photometric zero point following the prescription below. Note that this approach is passive in the sense that it is utilizing science observations that have already been observed – no special calibration field observation requests are injected into the schedule for the purpose of this study, therefore maximizing usable science observations:
-
1.
Check if an exposure is viable for photometric zeropoint measurement:
-
•
Image is taken in a filter with a viable transformation to the SDSS photometric system. At this time, the analysis is limited to the g’ r’ i’ z’ filters.
-
•
Image is in footprint of the PANSTARRS DR1 catalog, i.e., is the declination larger than .
-
•
A minimum exposure time requirement is met: This is selected to be 10 seconds for the 1 and 2 meter telescopes, and 15 seconds for the 0.4 meter telescopes.
-
•
-
2.
Cross-match the image’s object catalog by RA/Dec coordinates with the PS1 catalog (a locally cached copy is used).
-
3.
Transform the PS1 photometry into the SDSS system[12].
-
4.
Iteratively, with outlier rejection, fit the photometric zeropoint between instrumental magnitudes and catalog.
-
5.
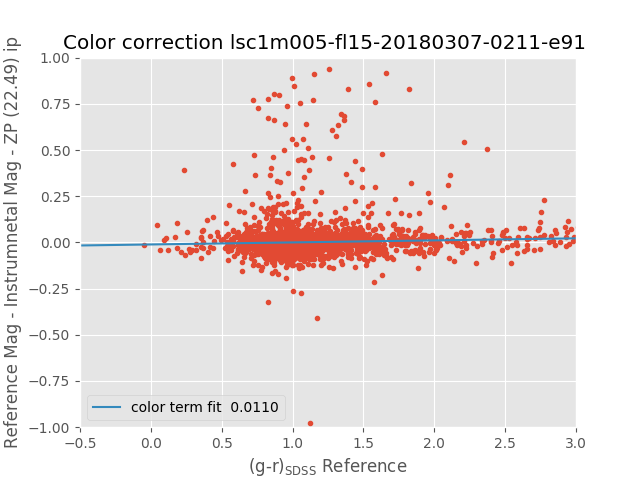
Iteratively, with outlier rejection, fit a linear color term for diagnostic purposes:
The color term is not yet incorporated into the zeropoint fitting.
-
6.
Store the resulting zeropoint along with meta data (exposure identifier, telescope, instrument identifier, airmass, formal error, color term) in a SQLite database.
Diagnostic plots are optionally generated during the zeropoint fitting procedure to display the SDSS reference band magnitude versus difference in instrumental and catalog magnitude; these plots have been useful during code development, but they are too numerous to inspect for all data in the archive and therefore disabled by default. We find those plots however useful when recommissioning a camera at a telescope. Example plots are shown in Figure 2.
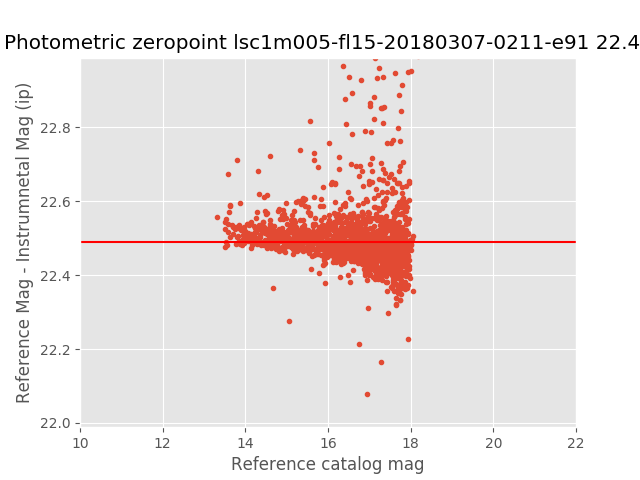
After initially processing all BANZAI-calibrated444BANZAI was deployed early 2016, which is why the following plots will start at that time; LCOGT has been operational earlier. images in the LCOGT archive (over images), zeropoints for newly observed images are now calculated on a daily basis using an autonomous process. The results are made available at a web page internal to LCOGT. It is a goal to implement the zeropoint calibration as a part of the default processing in the BANZAI pipeline.
3 Long term trends in throughput
The photometric zeropoint database by now contains over data points, spawning a parameter space of about 30 cameras at 21 telescopes in four filters (g’r’i’z’) from 2016 to today. A canonical way to inspect those data is to show the photometric zeropoint of the imager (there is only one primary imager at any moment per telescope) vs time, and we plot the zeropoint in the SDSS g’ and r’ filter for all LCOGT’s sites in Figure 3; the sampling in the i’ and z’ band filters is too sparse to add meaningful information. Different cameras are identified in those plots. Photometric zeropoints are corrected to an airmass of 1 for plotting and further calculation. Note that the zeropoint is in magnitudes, i.e., it is a logarithmic representation of the throughput. A zeropoint difference translates into a flux (throughput) ratio as . We observe:
-
1.
Only the upper envelope of the overall zeropoint vs time trend is of importance - data points below the mean trend line are an indication of non-photometric conditions. Measurements with large errors (e.g., images taken in the Galactic plane) are grayed out in the plots. Some 0.4 meter telescopes do not yet have a long history of observations since they were only deployed recently.
-
2.
Different CCD camera types have a different quantum efficiency, as seen by, e.g., the sudden increase of the throughput in October 2016 in the throughput of the LSC doma-1m0a plot. At that time an older SBIG CCD camera was replaced by a more sensitive Sinistro imager.
-
3.
The general trend in zeropoint vs time trends down, as is expected.
-
4.
Realuminizing of a mirror results in very significant throughput improvements. Those events (as well as a special cleaning of a mirror) are marked with grey vertical bars in the plots:
-
(a)
In October 2017 the 1 meter telescope in the dome C at the LSC (CTIO) site.
-
(b)
In November 2017 for the 2 meter telescope at the OGG (Haleakala) site.
-
(c)
In April 2018 the 1 meter telescope at the ELP (McDonald observatory) site.
The throughput improved by about 0.8 magnitudes for the two one meter telescope, which is about a factor of 2.1. The throughput of the 2 meter telescope improved by about 1.7 magnitudes, or a factor of 4.8!
-
(a)
-
5.
Cleaning a mirror, or for the 0.4 meter telescopes, the corrector plate, can yield a significant throughput improvement. An example is the 0.4 meter telescope at the COJ (Siding Spring) site around July 2017, where after CO2 snow cleaning the throughput increased by about 0.35 magnitudes, or a factor of 1.4.
LSC


LSC continued


COJ


COJ continued


COJ continued


OGG


OGG continued


ELP


CPT


CPT continued


TFN


We are interested in the behavior of the telescope fleet. We model the upper envelope of the zeropoint vs. time trend for each individual telescope, as indicated by the red lines in Figure 3. The general trends in the r’ band for all 1 meter and 2 meter telescopes are shown together in Figure 4. We observe:
-
1.
All telescopes in LCOGT’s telescope network lost significant throughput over the time covered by the data.
-
2.
Around October 2016, a number of new imaging cameras (Sinistro) were deployed to the telescope, improving the throughput throughout the network significantly.
-
3.
The degradation of the 2 meter telescope mirrors is very significant, especially when seen in comparison to the performance of the 1 meter telescopes. The recent recoating of the first 2 meter and 1 meter telescope mirrors demonstrates their performance potential. Comparing the peak performance of the COJ 2 meter telescope with the peak of the ELP 1 meter telescope, as indicated in Figure 3, yields a relative throughput difference ( , which is remarkably close to the expected value based on their aperture ratio .
-
4.
The mirrors at the various sites degrade at a very similar rate, which is remarkable given the different levels of dust exposures at the sites, e.g., between McDonald observatory and CTIO. The throughput is lost at a rate of approximately 0.25 mag per year, which corresponds to about per month, which is significantly higher than the decrease rate of reported for the William Hershel Telescope[13, 3] for particle deposition on mirrors. This elevated decay rate is consistent with the decomposition of the aluminum coating seen throughout our mirrors.
-
5.
We note that since the beginning of 2018, the throughput at the 2 meter telescope at COJ (Siding Spring) has started to degrade at an accelerated pace, indicating the approach of a total coating failure. It is scheduled for recoating in June 2018.
-
6.
The mirror recoated in October 2017 at the LSC site has already lost reflectivity of the order of 0.2 mag; CO2 snow cleaning in May 2018 (Figure 3) did not fully recover the throughput of the freshly replaced mirror, indicating that the current cleaning schedule or method is insufficient to maintain a high throughput over an extended time.

4 Summary and Conclusion
The vast data set from a large fleet of telescopes with identical instrumentation over a multi-year time span has provided a unique insight into the aging of the optical surfaces of telescopes at multiple sites across the globe. At LCOGT, quantifying the throughput evolution as shown in this paper was an important tool to communicate the urgency of a systematic approach to maintaining the mirrors and proved more effective than isolated reports about mirrors deteriorating.
LCOGT is evolving from the construction phase to an observatory in full operation; at this transition point, a new culture is developing to emphasize maintenance and protecting aging equipment against decay. The significance of the throughput loss at the telescopes was recognized in 2017, and a process was started to recoat all mirrors within LCOGT’s network. This was especially true once the drastic improvements from the first three refurbished systems became visible. Analyzing the state of the telescopes in near real-time will inform staff in the cost-effective scheduling of cleaning and recoating of mirrors should telescopes degrade faster than expected (e.g., due to dust storms).
Understanding the telescope performance reaches beyond managing operational costs: LCOGT operates a network of telescopes. When an observing request is entered into the system, it is not yet clear at which telescope it will be executed. Moreover, due to the spread of locations, one of LCOGT’s unique capabilities is to monitor an object continuously, handing over observations from one site to another as the darkness progresses over the globe. In this operation scenario it is problematic if the throughput varies significantly between telescopes of a class, which are all treated equally by the scheduler. It is hence desirable to maintain the telescopes in an equal and good state, or alternatively give the scheduler awareness of the individual telescopes’ performance. Deriving the throughput of all telescopes, from all science images, and on a daily basis can inform observatory staff to better the observatory hardware and software.
5 Acknowledgement
The Pan-STARRS1 Surveys (PS1) and the PS1 public science archive have been made possible through contributions by the Institute for Astronomy, the University of Hawaii, the Pan-STARRS Project Office, the Max-Planck Society and its participating institutes, the Max Planck Institute for Astronomy, Heidelberg and the Max Planck Institute for Extraterrestrial Physics, Garching, The Johns Hopkins University, Durham University, the University of Edinburgh, the Queen’s University Belfast, the Harvard-Smithsonian Center for Astrophysics, the Las Cumbres Observatory Global Telescope Network Incorporated, the National Central University of Taiwan, the Space Telescope Science Institute, the National Aeronautics and Space Administration under Grant No. NNX08AR22G issued through the Planetary Science Division of the NASA Science Mission Directorate, the National Science Foundation Grant No. AST-1238877, the University of Maryland, Eotvos Lorand University (ELTE), the Los Alamos National Laboratory, and the Gordon and Betty Moore Foundation.
References
- [1] T. M. Brown, N. Baliber, F. B. Bianco, et al., “Las Cumbres Observatory Global Telescope Network,” PASP 125, 1031 (2013).
- [2] E. S. Saunders, S. Lampoudi, T. A. Lister, et al., “Novel scheduling approaches in the era of multi-telescope networks,” in Observatory Operations: Strategies, Processes, and Systems V, Proc. SPIE 9149, 91490E (2014).
- [3] C. R. Benn and R. G. Talbot, “Increasing the productivity of the WHT,” in Observatory Operations to Optimize Scientific Return II, P. J. Quinn, Ed., Proc. SPIE 4010, 64–71 (2000).
- [4] U. Hopp, R. Bender, C. Goessl, et al., “Improving the Wendelstein Observatory for a 2m-class telescope,” in Observatory Operations: Strategies, Processes, and Systems II, Proc. SPIE 7016, 70161T (2008).
- [5] D. R. Harbeck, T. Boroson, M. Lesser, et al., “The WIYN one degree imager 2014: performance of the partially populated focal plane and instrument upgrade path,” in Ground-based and Airborne Instrumentation for Astronomy V, Proc. SPIE 9147, 91470P (2014).
- [6] M. Fukugita, T. Ichikawa, J. E. Gunn, et al., “The Sloan Digital Sky Survey Photometric System,” AJ 111, 1748 (1996).
- [7] J. D. Eastman, T. M. Brown, J. Hygelund, et al., “NRES: the network of robotic Echelle spectrographs,” in Ground-based and Airborne Instrumentation for Astronomy V, Proc. SPIE 9147, 914716 (2014).
- [8] R. J. Siverd, T. M. Brown, J. Hygelund, et al., “NRES: the network of robotic Echelle spectrographs,” in Ground-based and Airborne Instrumentation for Astronomy VI, Proc. SPIE 9908, 99086X (2016).
- [9] C. McCully, N. Volgenau, D. Harbeck, et al., “Real-time processing of the imaging data from the network of Las Cumbres Observatory telescopes using BANZAI,” in Software and Cyberinfrastructure for Astronomy V, Proc. SPIE (2018 in press).
- [10] D. Lang, D. W. Hogg, K. Mierle, et al., “Astrometry.net: Blind Astrometric Calibration of Arbitrary Astronomical Images,” AJ 139, 1782–1800 (2010).
- [11] K. C. Chambers, E. A. Magnier, N. Metcalfe, et al., “The Pan-STARRS1 Surveys,” ArXiv e-prints (2016).
- [12] D. P. Finkbeiner, E. F. Schlafly, D. J. Schlegel, et al., “Hypercalibration: A Pan-STARRS1-based Recalibration of the Sloan Digital Sky Survey Photometry,” ApJ 822, 66 (2016).
- [13] P. Bely, The Design and Construction of Large Optical Telescopes, Astronomy and Astrophysics Library, Springer New York (2006).