The X-Ray Luminosity Function of Ultra Luminous X-Ray Sources in Collisional Ring Galaxies
Abstract
Ring galaxies are fascinating laboratories: a catastrophic impact between two galaxies (one not much smaller than the other) has produced fireworks especially in the larger one, when hit roughly perpendicularly to the plane. We analyze the point sources, produced by the starburst episode following the impact, in the rings of seven galaxies and determine their X-ray luminosity function (XLF). In total we detect 63 sources, of which 50 have luminosity L erg s-1, classifying them as ultra luminous X-ray sources (ULXs). We find that the total XLF is not significantly different from XLFs derived for other kinds of galaxies, with a tendency of having a larger fraction of high X-ray luminosity objects. Both the total number of ULXs and the number of ULXs per unit star formation rate are found in the upper envelope of the more normal galaxies distribution. Further analysis would be needed to address the issue of the nature of the compact component in the binary system.
1 Introduction
Ring Galaxies (RiGs hereafter) are unique laboratories in which to study peculiar phases of galaxy evolution. At least a fraction of ring galaxies are thought to form via (almost) head-on collisions with massive intruder galaxies. Due to the gravitational perturbation induced by the bullet galaxy, a density wave propagates through the disc of the target galaxy, generating an expanding ring of gas and stars (e.g. Lynds & Toomre 1976). They are often characterized by high star formation rates (SFR M⊙ yr-1), suggesting that the density wave associated with the propagating ring triggers the formation of stars. Even if they constitute a small subclass of galaxies (they are estimated to be about 0.02-0.2 percent of all spiral galaxies, Athanassoula & Bosma 1985) they represent a peculiar and energetic environment worth investigating.
The archetype of RiGs is the Cartwheel galaxy (see e.g. Wolter et al. 1999; Wolter & Trinchieri 2004 for a description of the X-ray emission in the Cartwheel and references for multi-wavelength observations). It is bright in all bands, and contains a large number of ultra luminous X-ray sources (ULXs), most of which trace the star forming regions in the ring.
ULXs are off-center point-like sources with X-ray luminosity (assumed isotropic) erg s-1, higher than the Eddington limit for a few M⊙ black hole (BH). The general consensus until recently was that most ULXs represent the high luminosity tail of high mass X-ray binaries (HMXBs, see for instance the X-ray luminosity functions of ULX in the Cartwheel, Antennae and NGC 2276 in Wolter & Trinchieri 2004; Zezas et al. 2007; Wolter et al. 2015) and the BHs powering them are of (heavy) stellar mass size (Feng & Soria 2011; Kaaret et al. 2017). However, it has not yet been excluded that a number of ULXs are powered by intermediate-mass black holes (IMBH). IMBHs are compact objects with masses in the range , which are intermediate between stellar mass BHs and super-massive BHs in the center of galaxies (see e.g. van der Marel (2004), for a review), and have fundamental cosmological implications, as they are deemed to be seeds of super-massive BHs, sources of pre-heating of the intergalactic medium (e.g. Fragos et al. 2013; Mesinger et al. 2013), of fluctuations in the near-infrared cosmic background (Yue et al. 2013) and of gravitational waves (e.g. Mapelli 2016; Abbott et al. 2017c). Furthermore, recent observations have found that at least 4 ULXs, including one of the most luminous, are powered by a neutron star (NS), betraying its presence through X-ray pulsations - hence the name PULXs, from pulsar ULXs (Bachetti et al. 2014; Israel et al. 2017b, a; Fürst et al. 2016; Carpano et al. 2018). Indeed, it might even turn out that all ULXs are NS! (e.g. King & Lasota 2016).
It is therefore most likely that the class of ULXs, being defined purely on one single observational parameter (their X-ray luminosity), contains a mixed class of sources. Mass measure is a very challenging task for ULXs and only few reliable results are available. The dynamical evidence for a small mass for the compact object is scanty: it comes mostly from ULX-1 in M101 (Liu et al. 2013), and P13 in NGC 7793 (Motch et al. 2014). In fact, source P13 turned out to be a NS (Israel et al. 2017b; Walton et al. 2018). On the other hand, the most luminous ULXs known, and therefore the most promising IMBH candidates, are M82-X1, ESO 243-49 HLX-1, NGC 2276-S6, and Cartwheel-N10 (Portegies Zwart et al. 2004; Feng et al. 2010; Farrell et al. 2009; Mezcua et al. 2015; Wolter et al. 2006).
With the aim of studying ULXs of extreme properties in extreme environments, we decided to better investigate a sample of RiGs in search for ULXs. The objects in our sample are similar to the Cartwheel, suggesting the presence of a catastrophic event. If RiGs are ”caught in the act” of forming new stars, we might be in a better position for finding the most massive products of star formation. Ages of rings are estimated to be of not longer than a few hundred Myrs (see Sect. 2.1 for age determinations, when available, and references). Furthermore, due to the peculiar morphology of ring galaxies, point sources detected in the ring are very likely to be physically associated with the galaxy, reducing the problem of contamination from spurious sources.
We collected therefore all collisional RiGs observed by Chandra, four of them already published, three analyzed in this paper for the first time, with the aim of constructing their global X-ray luminosity function (XLF) to study the population of ULXs on statistical grounds. Section 2 describes the sample and the individual galaxies, Section 3 the XLF and Section 4 our discussion of the findings. We use H Km s-1 Mpc-1 to compute X-ray luminosities.
2 The Sample
Collisionally formed rings, with enhanced star formation, represent an ideal nursery to collect a fair sample of ULXs. And yet only a few X-ray observations of ring galaxies exist. We focus on the objects observed by the Chandra satellite because of the superior spatial resolution of the telescope, that allows for a better identification of the sources and less source confusion.
Chandra observed only 7 RiGs, but they make up for this paucity by having a large number of individual sources. These galaxies were selected for observation because they are bright and have a spectacular morphology in all known wavebands. Of the seven galaxies, four have been published already in the literature. The X-ray observations of the remaining three galaxies are unpublished except that in one case the literature reports only the identification of the brightest source with an interloper AGN. We have analyzed their Chandra data, and list here the relevant findings for point sources (see Sect. 2.1). To construct the XLF we will consider only sources along the ring. Below we list and describe all the RiGs considered in this paper.
2.1 Individual galaxies
Table 1 lists the relevant information for all the galaxies: name, position, Galactic line of sight absorption (NH) as used in this paper, distance in Mpc (as used in this paper), optical diameter (D25 from the NASA/IPAC Extragalactic Database - NED), and the scale at the distances of the galaxies. We describe below each galaxy in turn, concentrating mainly on the references and information about the X-ray analysis, the star formation rate (SFR) and the metallicity of the galaxies. We use as the primary SFR indicator the H derived value, which is most sensitive to the recent star formation. We expect the stellar population to be of young age (see below). This is also favouring the presence of massive OB stars as donors, which are the case for HMXB, although the issue is far from settled, as a few ULXs may have a late star as optical counterpart (e.g. IC 342 X1: Feng & Kaaret (2008)) and Main Sequence stars are favoured as donors in simulations, due to their longer life (e.g. Wiktorowicz et al. 2017). We list also, where available, other SFRs from the literature.
| Name (Other name) | Position | NH | Dist | Diam | Scale | |
|---|---|---|---|---|---|---|
| J2000 | [ cm-2] | [Mpc] | [′] | [kpc/] | ||
| Cartwheel Galaxy (AM 0035335) | 00 37 41.1 | 33 42 59 | 19.0 | 122 | 1.5 | 0.566 |
| NGC 922 (AM 0222250) | 02 25 04.4 | 24 47 17 | 1.62 | 48 | 2.6 | 0.239 |
| Arp 147 | 03 11 18.9 | 01 18 53 | 6.2 | 133 | 0.5 | 0.643 |
| AM 0644741 (Lindsay-Shapley Ring) | 06 43 06.1 | 74 13 35 | 10.0 | 91.6 | 1.7 | 0.447 |
| Arp 143 | 07 46 53.6 | 39 01 10 | 5.01 | 57.1 | 3.0 | 0.283 |
| Arp 148 (Mayall’s object) | 11 03 53.2 | 40 50 57 | 1.01 | 145.2 | 0.6 | 0.696 |
| Arp 284 (NGC 7714/7715) | 23 36 18.1 | 02 09 21 | 18.0 | 37 | 2.9 | 0.186 |
2.1.1 Cartwheel Galaxy (AM 0035335)
The Cartwheel (catalog Cartwheel Galaxy) is the most famous object in the group. It has been studied extensively at all wavelengths. Several authors have studied this galaxy in great details both in the X-ray and other wavebands (e.g. Wolter et al. 1999; Gao et al. 2003; Wolter & Trinchieri 2004; Wolter et al. 2006; Crivellari et al. 2009; Pizzolato et al. 2010 for the description of the X-ray data). The Cartwheel contains 16 ULX (Wolter & Trinchieri 2004) and has a high SFR: Wolter & Trinchieri (2004) find it consistent with the SFR obtained from LHα (Appleton & Marston 1997), while Mayya et al. (2005) derive a SFR from radio data. The metallicity has been measured by Fosbury & Hawarden (1977) at the position of the brightest HII regions in the ring, and the result is subsolar: Z = 0.14 Z⊙, assuming Z⊙ = 0.019 (Anders & Grevesse 1989).
The nuclear mass of the Cartwheel, derived from the rotation velocity in the ring, is M , while the ring contains stars and ionized gas for a total of and (Fosbury & Hawarden 1977).
CO is detected by ALMA only in the nucleus and inner ring (Higdon et al. 2015) for a total mass of 2.7 M⊙. The kinematic of the gas implies an age of the inner ring of Myr. The outer ring appears dominated by an atomic phase of the gas, with a very little content of H2. The age of the outer ring is estimated to be Myr (Higdon 1995, 1996).
| Name | MK | B | SFR | ZaaAssuming Z⊙ = 0.02, 12+log(O/H)⊙ = 8.92 | RefbbReference list: 1: Hα data: Appleton & Marston (1997); 2: Fosbury & Hawarden (1977); 3: Hα data Wong et al. (2006); 4: Hα data: Romano et al. (2008); 5: from log(NII/Hα) in different ring positions (Fogarty et al. 2011); 6: Hα data Higdon & Wallin (1997); 7: Mapelli et al. (2009); 8: Higdon et al. (1997) citing Jeske (1986); 9: Hα data Schmitt et al. (2006); 10: García-Vargas et al. (1997). (SFR, Z) |
|---|---|---|---|---|---|
| M⊙/yr | Z⊙ | ||||
| Cartwheel | 14.82ccB-Magnitude of the ring | 20 | 0.14 | 1, 2 | |
| NGC 922 | -23.21 | 12.32 | 8.0 | 0.5 - 1. | 3, 3 |
| Arp 147 | -22.88 | 15.990.05 | 4.1 | 0.19 - 0.40 | 4, 5 |
| AM 0644741 | 11.00.4 | 2.6 | 0.45 | 6, 7 | |
| Arp 143 | -23.86 | 13.300.08 | 2.3 | 0.44 - 0.71 | 4, 8 |
| Arp 148 | -23.23 | 16.040.03 | 2.5 | 4, – | |
| Arp 284 | 4.0 | 0.19 - 0.38 | 9, 10 |
In this paper we use the results of the X-ray analysis as presented in Wolter & Trinchieri (2004).
2.1.2 NGC 922 (AM 0222250)
NGC 922 (catalog NGC 922) has been described as a RiG only recently (Wong et al. 2006). It contains 7 ULXs and has a SFR = 8 (Prestwich et al. 2012; Wong et al. 2006) derived from measures, which we use hereafter.
The ring has a distorted appearance that probably hindered the classification of the galaxy. However the high SFR and high number of ULXs are consistent with it being a collisional RiG. Metallicity has been published only for the nucleus of the galaxy (Wong et al. 2006) and is consistent with solar (following Prestwich et al. 2012, we adopt Z⊙). Optical spectra taken at optical knots positions suggest a smaller value for metallicity in the ring (Emanuele Ripamonti, private communication). The gravitational interaction of the bullet galaxy (S2) with NGC 922 has likely happened about 330 Myr ago (Wong et al. 2006) with a slightly off-center impact. Pellerin et al. (2010) find young stellar clusters in the ring and nuclear region, while the plume is made of older stars, consistent with the impact scheme.
In this paper we use the results of the X-ray analysis as presented in Prestwich et al. (2012).
2.1.3 Arp 147
Arp 147 (catalog Arp147) lives in one of the most diverse collections of celestial objects in a small patch of the sky: in the close vicinity of the RiGs there are the possible intruder galaxy, a bright star and an X-ray emitting AGN. All within less than 1′. Rappaport et al. (2010) have analyzed this galaxy and list 9 ULXs and a SFR of .
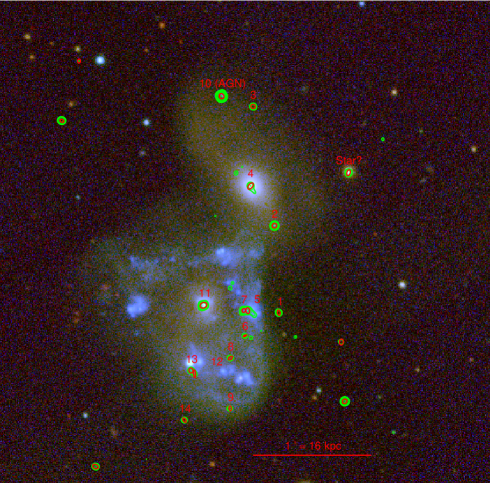
2.1.4 AM 0644741 (Lindsay-Shapley Ring)
AM 0644741 (catalog AM~0644-741) (see figure 1) shows an almost complete ring, and a partial second, more internal ring. It is probably the galaxy most similar to the Cartwheel in morphology, except for the presence of an active nuclear source.
The brightest source in AM0644-741(#3) has been observed spectroscopically by Heida et al. (2013) and it has been identified with an AGN at z=1.40. The source is not positionally coincident with the ring and therefore does not belong to the sample which we use for the XLF.
In this paper we use a SFR of 2.6 derived from H by Higdon & Wallin (1997) and sub-solar metallicity of Z = 0.45 ⊙ (Mapelli et al. 2009). However we are aware that Higdon et al. (2011) derive a SFR = 11.20.4 M⊙ yr-1 from LHα and the less favored SFR = 17.60.9 M⊙ yr-1 from radio measures, in addition to a metallicity in excess of solar with no significant azimuthal variations.
The Chandra X-ray observation is not published so we downloaded it from the archive and analyzed it as described below (see Setc. 2.2). All 9 detected point sources are listed in Table 4. Their luminosities are all above the ULX limit if associated to the galaxy. The list includes one source associated to the nucleus. In addition to #3, we will exclude this source from the XLF computation.
From the total detected net counts in the area of the galaxy (excluding the interloper AGN and the nuclear source) of 593.037.0 we measure a total unabsorbed luminosity associated with the galaxy of L erg/s. We assumed a spectral shape that includes both a “point-sources” spectrum with fixed and a thermal plasma (mekal in XSPEC) component to describe the diffuse gas, both absorbed by a fixed N cm-2. The fraction accounted for by the thermal component corresponds to an unabsorbed L erg/s with kT = 0.08 () keV. We extracted the counts for all detected point sources (178.1 counts in total) and derived a mean spectral shape of NH = 0.22 [0.01-0.43] cm-2 and = 1.55 [1.18-1.99] for a total unabsorbed LkeVerg/s. Most of the X-ray luminosity is in unresolved sources.
| Name | OBSID | Date | Time | Ref. for X-rays |
|---|---|---|---|---|
| sec | ||||
| Cartwheel Galaxy | 2019 | 2001-may-26 | 76.15 | Wolter & Trinchieri (2004) |
| NGC 922 | 10563 | 2009-mar-05 | 29.74 | Prestwich et al. (2012) |
| NGC 922 | 10564 | 2009-oct-02 | 10.02 | – |
| Arp 147 | 11280 | 2009-sep-13 | 24.53 | Rappaport et al. (2010) |
| Arp 147 | 11887 | 2009-sep-15 | 18.04 | – |
| AM 0644741 | 3969 | 2003-nov-17 | 39.40 | this paper |
| Arp 143 | 14906 | 2012-dec-10 | 39.00 | this paper |
| Arp 148 | 12977 | 2011-feb-07 | 52.34 | this paper |
| Arp 284 | 4800 | 2004-jan-24 | 59.00 | Smith et al. (2005) |
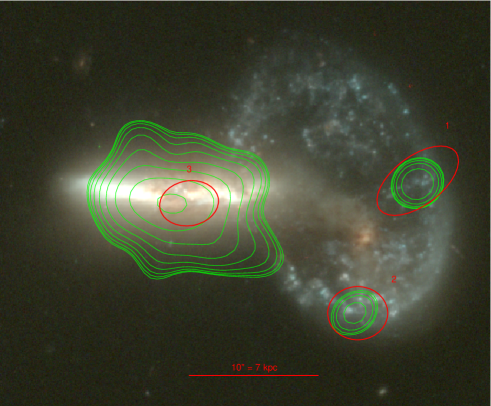
2.1.5 Arp 143
Arp 143 (catalog Arp 143) (see figure 2) has a complex morphology. It consists of the galaxies NGC 2444 and NGC 2445. The Galex image clearly shows the young stellar population in the ring (Beirão et al. 2009). HI and CO are detected in the galaxy: HI in the ring and CO clustered around the nucleus (Higdon et al. 1997) together with a number of HII regions. A long ( kpc) HI tail (Appleton et al. 1987) might represent the leftover of previous, perhaps multiple encounters. The kinematics of the ring implies an age of the ring of 6015 Myr, about 20% of the Cartwheel, and the N-body simulations of Gerber et al. (1996) imply that time elapsed since the collision is less than 80 Myr. About 30 Myr have elapsed since the encounter, assuming NGC 2444 is the bullet galaxy and based on the dynamics and distance of the two galaxies (from Jeske 1986 referred to in Higdon (1995)). The total molecular gas content is estimated to be H2=4-24 (Higdon 1995).
Romano et al. (2008) find a SFR = from Hα and a SFR = from FIR. We use the Hα derived SFR and a sub-solar metallicity from Jeske (1986), cited by Higdon et al. (1997) as Z = Z⊙.
The Chandra X-ray observation is not published so we downloaded it from the archive and analyzed it as described below (see Sect. 2.2). All 14 detected point sources are listed in Table 4. Both nuclei are detected in the galaxies forming Arp 143, plus an interloper Sy 1 at z=0.6155313 (Abolfathi et al. 2017). Two sources have a radio counterpart including the nucleus of NGC 2445. A couple more of X-ray sources (noted in Table 4) are not consistent with the ring position and will not be used to derive the XLF.
From the total detected net counts in the area of the galaxy (excluding the Sy1 and the two nuclear sources) of 490.639.6 we measure a total unabsorbed luminosity associated with the galaxy of L keVerg/s. We assumed a spectral shape with fixed NH= cm-2 that includes a ”point-sources” spectrum with fixed and a thermal plasma (mekal in XSPEC) component to describe the diffuse gas. The fraction accounted for by the thermal component corresponds to an unabsorbed L keVerg/s with kT = 0.50 (0.32-0.66) keV. We extracted the counts for all detected point sources (247.1 counts in total) and derived a mean spectral shape of NH= 0.074 [] cm-2 and = 1.57 [1.26-1.94] for a total unabsorbed L keVerg/s.
2.1.6 Arp 148 (Mayall’s object)
Arp 148 (catalog Arp 148) (see figure 3) is a beautiful example of an interacting pair. We detect only two sources in the ring, beside the foreground member of the pair, which is also a radio source. However the limiting flux of the Chandra observation corresponds to much higher luminosity of Lerg/s than the other galaxies, given the much larger distance and comparatively short exposure time.
The galaxy lies in fact at D=145 Mpc (Strauss et al. 1992) with a low galactic line of sight absorption of N cm-2. The source was observed by Chandra on 7 Feb 2011 for a total of 52.34 ksec. The X-ray observation is not published so we downloaded it from the archive and analyzed it as described below (see Sect. 2.2). All the detected point sources are listed in Table 4. In our analysis we used a SFR = from Hα (Romano et al. 2008). A SFR = is derived from the far infrared (Romano et al. 2008), however this measurement could be affected, given the low resolution of the IRAS data, by confusion with the companion galaxy, which could host an AGN, being a radio emitter. The metallicity is not known. Romano et al. (2008) estimate an elapsed time since collision of less than 80 Myr, based on N-body simulations of Gerber et al. (1996).
The total unabsorbed luminosity associated with the ring galaxy, computed with a spectral shape with fixed N cm-2 that includes a point sources spectrum with fixed and a thermal plasma (mekal in XSPEC) component to describe the diffuse gas, is of Lerg/s given the total detected net counts in the area of the ring galaxy (excluding the interloper) of 73.613.3. The fraction accounted for by the thermal component corresponds to an unabsorbed Lerg/s with kT = 0.23 (0.17-0.31) keV. However the small number of counts does not allow a very reliable fit. As a last step, we extracted the counts for all detected point sources (34.0 counts in total) and derived a mean spectral shape of N cm-2 and = 1.63 [1.14-2.14] for a total unabsorbed LX is Lerg/s .
As regards the intruder galaxy, it is detected with total net counts = 384.0 20.9. We fit the extracted spectrum with a power law to represent both the nucleus and possible unresolved point sources, plus a thermal plasma (mekal in XSPEC) component to account for the diffuse plasma. Both components are necessary to the fit. We fix the absorbing hydrogen column density to the Galactic value of N. The resulting = 1.63 [1.25-1.96] is perfectly consistent with both unresolved point sources or the presence of a nucleus, while the kT = 0.66 [0.58-0.74]keV is also similar to temperatures found for the gas in the other RiGs and for local galaxies in general (Bogdán & Gilfanov 2011). The unabsorbed flux is f erg/cm2/s for a luminosity Lerg/s where the two components contribute as follows: the power law Lerg/s and the diffuse gas Lerg/s.
2.1.7 Arp 284 (NGC 7714/7715)
Arp 284 (catalog Arp 284) is the interacting pair NGC 7714 and NGC 7715, with many structures, for instance bridges between the two galaxies and tails. The galaxy contains 9 ULXs and has a SFR = 7 (Smith et al. 2005). While Lançon et al. (2001) finds a SFR from complex SED modeling, Schmitt et al. (2006) find a value of SFR = 4.0 from H data and a SED correction. We use this last H derived value. The metallicity has been measured by García-Vargas et al. (1997) to be Z = Z⊙. We use only the sources in the ring, as listed in Table 5, to construct the XLF.
In this paper we use the results of the X-ray analysis as presented in Smith et al. (2005).
| Source # | Pos | Counts | f | L | L | XLF Corr | NOTES | |
| (FK5) | (a) | (b) | (b) | (c) | ||||
| AM0644x1 | 06 42 58.62 | -74 14 44.1 | 28.9 5.5 | 7.952.1 | 8.0 | 5.1 | 1.0 | |
| AM0644x2 | 06 43 01.40 | -74 15 16.1 | 46.3 6.9 | 12.62.8 | 12.6 | 8.1 | 1.0 | |
| AM0644x3 | 06 43 02.27 | -74 14 11.1 | 107.3 10.4 | 28.55.1 | 28.6 | 18.3 | – | AGN in Heida et al. (2013) |
| AM0644x4 | 06 43 04.81 | -74 13 43.1 | 36.4 6.1 | 9.82.7 | 9.8 | 6.3 | 1.0 | |
| AM0644x5 | 06 43 06.08 | -74 14 10.9 | 85.1 9.3 | 22.34.1 | 22.4 | 14.3 | – | Nucleus |
| AM0644x6 | 06 43 06.51 | -74 14 48.7 | 7.6 2.8 | 2.11.3 | 2.1 | 1.3 | 1.67 | |
| AM0644x7 | 06 43 07.71 | -74 15 02.1 | 8.4 3.0 | 2.31.5 | 2.3 | 1.4 | 1.33 | |
| AM0644x8 | 06 43 10.54 | -74 14 06.9 | 19.2 4.5 | 5.11.7 | 5.1 | 3.3 | 1.05 | |
| AM0644x9 | 06 43 10.64 | -74 14 34.9 | 31.4 5.7 | 8.52.2 | 8.5 | 5.4 | 1.0 | |
| Gal | 06 43 25.50 | -74 15 26.2 | 30.416.78 | 6.962.6 | 7.0 | 4.44 | – | possible bullet? Few et al. (1982) |
| Arp148x1 | 11 3 52.35 | +40 51 1.4 | 18.4 4.4 | 3.50.9 | 8.8 | 5.7 | 1.0 | |
| Arp148x2 | 11 3 52.74 | +40 50 51.3 | 14.8 4.0 | 2.80.9 | 7.1 | 4.6 | 1.0 | |
| Arp148x3 | 11 3 53.99 | +40 51 0.1 | 139.2 11.9 | 25.84.0 | 65.1 | 42.1 | – | Nucleus/Galaxy |
| Star? | 7 46 48.81 | +39 02 01.7 | 28.75.39 | 8.62.8 | – | – | – | not related |
| Arp143x1 | 7 46 51.85 | +39 00 50.6 | 21.84.7 | 6.92.6 | 2.7 | 1.7 | 1.0 | |
| Arp143x2 | 7 46 52.04 | +39 01 34.8 | 83.79.2 | 25.04.7 | 9.8 | 63 | – | bridge? |
| Arp143x3 | 7 46 52.97 | +39 02 35.4 | 23.74.9 | 7.32.3 | 2.9 | 1.9 | – | not on ring (N2444) |
| Arp143x4 | 7 46 53.08 | +39 01 54.9 | 16.54.1 | 4.81.9 | 1.9 | 1.2 | – | Nucleus N2444 |
| Arp143x5 | 7 46 53.20 | +39 00 51.6 | 32.75.7 | 9.62.5 | 3.8 | 2.5 | 1.0 | radio source |
| Arp143x6 | 7 46 53.32 | +39 00 38.8 | 7.92.8 | 4.02.4 | 1.6 | 1.0 | 1.25 | |
| Arp143x7 | 7 46 53.38 | +39 00 51.7 | 35.86.0 | 10.92.7 | 4.3 | 2.8 | 1.0 | |
| Arp143x8 | 7 46 53.96 | +39 00 27.5 | 11.83.5 | 3.61.8 | 1.4 | 0.9 | 1.10 | |
| Arp143x9 | 7 46 53.97 | +39 00 01.9 | 9.83.2 | 3.11.5 | 1.2 | 0.8 | 1.18 | |
| Arp143x10 | 7 46 54.35 | +39 02 40.6 | 669.625.9 | 226.014.0 | 1.8 | – | Sy1 z=0.6155313 (SDSS) | |
| Arp143x11 | 7 46 55.14 | +39 00 54.4 | 66.48.2 | 19.23.9 | 7.5 | 4.8 | – | Nucl.N2445+radio source |
| Arp143x12 | 7 46 55.52 | +39 00 19.5 | 10.73.3 | 3.71.7 | 1.4 | 0.9 | 1.10 | |
| Arp143x13 | 7 46 55.68 | +39 00 21.2 | 18.74.4 | 5.62.1 | 2.2 | 1.4 | 1.02 | |
| Arp143x14 | 7 46 55.96 | +38 59 56.0 | 12.83.6 | 4.22.0 | 1.6 | 1.0 | 1.09 | |
2.2 Data Analysis
Chandra observations for all ring galaxies were performed with the Advanced CCD Imaging Spectrometer S Array (ACIS-S; Garmire et al. 2003), and their log is reported in Table 3. For each source we list the Observation Id (ObsID), the date of the observation together with the total live time and the references for the published data for four of the galaxies. We refer to the original papers for a detailed description of the data analysis. Three of the galaxies are presented here for the first time (see Sect.2.1 and Table 4). The ACIS detector was operated in the standard timed exposure full-frame mode, with FAINT (Arp 143) or VERY FAINT telemetry format. In all cases the targets were positioned on the back-illuminated chip S3 (CCD7). The data were reprocessed with the Chandra Interactive Analysis of Observations software package (ciao, version 4.7 and 4.8, Fruscione et al. 2006) and caldb version 4.6/4.7111http://cxc.harvard.edu/ciao/ (we note here that no significant changes have occurred in ciao or the caldb that could affect our analysis). We followed standard data reduction and analysis procedures: after downloading the data from the public archive, we run the chandra_repro tool to perform all the recommended data processing steps, then the fluximage tool to generate exposure-corrected images. Source detection was performed with the wavedetect tool on an image of the S3 chip generated by fluximage in the ”broad” energy range (0.5-7 keV) after excluding low-exposure regions at the edge of the chips (the expmapthresh parameter in fluximage). The detected sources are visible in figures 1, 2 and 3 as positional error ellipses. We computed count rates and fluxes for all the detected sources using the srcflux tool and assuming a power law model with photon index absorbed by an Hydrogen column density of as listed in table 1 for each galaxy. This choice is appropriate for ULXs (e.g. Swartz et al. (2011)) which are unresolved at the Chandra resolution. The instrumental responses (ARF and RMF) were calculated for each source, while the PSF contribution to both the source and background regions was calculated with the arfcorr method (where a simulated circularly symmetric PSF is used to estimate the aperture correction). Fluxes were calculated in the 0.5-10 keV and 2-10 keV energy bands for all the sources and are listed in Table 4. Luminosities were calculated assuming the galaxy distance from table 1. The ”XLFcorr” column contains the correction factors for each source as described in Sect. 3
In Fig. 1, 2 and 3 we display the optical image of the galaxies AM0644741, Arp 143 and Arp 148 and overplot the detected sources and X-ray contours from Chandra data. The description of the main results for each galaxy is in Sect. 2.1
Table 5 lists all the sources from the literature. For sake of uniformity and with the aim of constructing the X-ray Luminosity Function we recalculated luminosities in the 0.5-10 keV band for all the ring sources from the literature. In all cases we assumed the published and a power law model with photon index .
3 X-ray Luminosity Function
In order to study the ULXs as a class and to be able to compare the results with different models and with results from different samples, we construct the X-ray luminosity function (XLF) by incorporating the sources detected in all the rings. The purpose is to see if an encounter as violent as the splashdown of a bullet galaxy into another galaxy is so energetic as to create a different ”flavor” of ULXs, or a different distribution in luminosity. RiGs might host the most extreme class of ULXs. We assume that the ring population represents a single burst of star formation, produced by the impact, and that the populations from the different galaxies are homogeneous and can be combined. Luminosities are taken from Table 4 and Table 5, recalculated in the (0.5-10) keV band for uniformity with previous studies. We have collected a total of 63 sources, of which 50 above the ULX limit (1039 erg/s) . There are 23 sources with erg s-1 and 8 with erg s-1.
In order to take into account the detection confusion due the presence of diffuse and unresolved emission linked to the galaxies, we have applied a correction to the efficiency of detection following Kim & Fabbiano (2003). We base our assessment on fig. 12 from Kim & Fabbiano (2003) in which the detection probabilities as a function of background counts and source counts are plotted. The background includes both diffuse emission from the galaxy and field background and is estimated for each galaxy by averaging the total counts in the ring region, after excluding detected sources. We use the second panel, relative to a 2 arcmin off-axis, since the galaxies are always entirely within this limit. We apply the interpolated correction - listed in Tab. 4 and Table 5 - to all sources with less than 22 counts. This represents a conservative estimate.
We assess the probability of interlopers by measuring the number of sources expected by chance in the area of the rings in which we run the detection algorithm. We conservatively use an elliptical annulus that includes all of the optical extent of the ring. The density of sources at the limiting fluxes for each galaxy is derived from Moretti et al. (2003). Since the LogN-logS is given in the (0.5-2 keV) band, we used the 0.5-2 keV flux limit for each field (computed along the galaxies’ ring) derived with the same spectral hypothesis. The total expected number of interlopers is 1 for each galaxy at the relative detection limit and in total it is . Given these numbers, we disregard the interlopers and remove no further sources from the XLF.
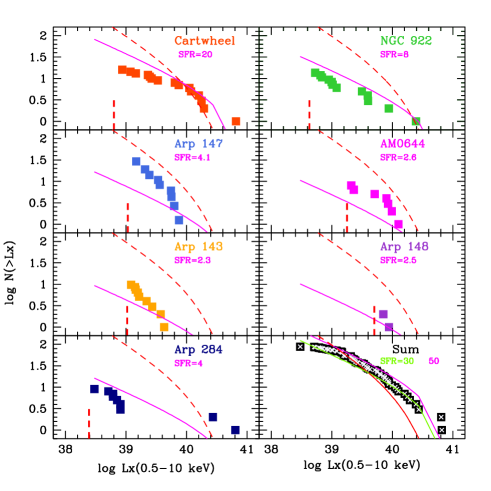
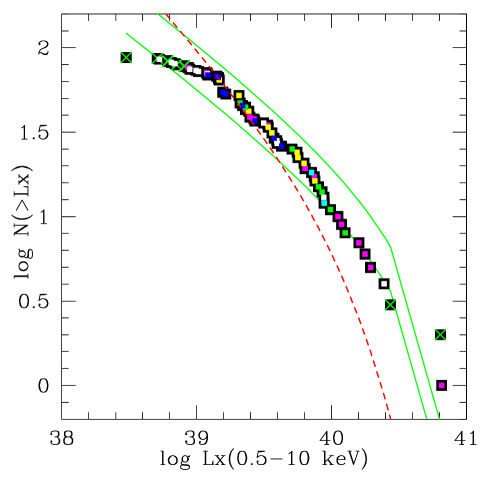
We plot the resulting XLF in Fig. 4 for each galaxy and in Fig. 5 for the sum of all sources, distinguishing sources from the same host galaxy by the same color and symbol. We notice that, since not all observations have the same limiting luminosity, the sampling at low LX is still not complete, even after the correction for the higher background due to the galaxy contribution. This explains the flattening below L erg/s: since we are interested mainly in the high luminosity end of the XLF, we do not consider this fact as a major problem at this time.
We have considered also two potential observational biases that could affect the final XLF. First, high absorbing columns of gas within the galaxies could obscure ULXs and lead to an underestimate of their numbers. For instance, Luangtip et al. (2015) find that the high absorbing columns of 10 cm-2 and dust content in luminous infrared galaxies might be a cause for the smaller number of ULXs per SFR unit they found. However, in RiGs the absorbing columns due to our Galaxy are in the 1021 cm-2 range at most, and fitted values in the ULX spectra (when statistics allows to perform a fit) are about at the same 1021 cm-2 level. Furthermore, the effect of a high absorbing column would be stronger for lower luminosity sources. We have sufficiently low detection limits, except for the case or Arp148, that this should not be a problem. The most significant cause for losing low flux sources would be the enhanced background due to the diffuse galactic emission, which we corrected for. Second, the finite angular resolution may cause multiple sources to be detected as a single one, with an artificially higher luminosity, with the effect of flattening the high luminosity end of the XLF. If we take the Cartwheel as a reference, we know that most of ULXs are variable (Crivellari et al. 2009; Wolter et al. 2006), and therefore more likely to be single sources. A higher X-ray spatial resolution could indeed resolve a few ULXs. With the statistics in hand, however, we do not find any difference in the high LX end of the XLF by dividing the sample in near and far galaxies (most likely to be unresolved). The statistics however is not large, and therefore more numerous samples are needed to estimate if the effect is present at low levels.
We compare our results with previous work on XLFs. In late-type galaxies, the occurrence and the luminosity of bright HMXBs (see e.g. Grimm et al. 2003; Ranalli et al. 2003; Mineo et al. 2011) and of ULXs (e.g. Mapelli et al. 2009, 2010) are found to correlate with the SFR.
It was shown already with the XLF of the Cartwheel Galaxy (Wolter & Trinchieri 2004) and of NGC 2276 (Wolter et al. 2015) that the Grimm et al. (2003) relation linking the HMXB luminosity function with the SFR of the galaxy gives consistent results. Grimm et al. (2003) use 14 galaxies with a total of 99 sources above erg s-1 in the (2-10 keV) band. The Grimm et al. (2003) function is normalized using the sum of the SFR values for the seven galaxies (SFR, see Sect. 2.1). The luminosity is rescaled to our 0.5-10 keV band by using a power law slope of . Given the uncertainties in SFR measures, we plot for reference the Grimm et al. (2003) function normalized to SFR = 35 M⊙ yr-1 and SFR = 50 M⊙ yr-1 which represent a lower and an upper envelope for the XLF, respectively.
Mineo et al. (2012) selected a sample of 29 local galaxies (D Mpc) with SFR in the range 0.1 to 15 to discuss the connection with recent star formation activity and binary evolution. They point out that a few incorrect assumptions have been used to derive the Grimm et al. (2003) functional form, however their relation between the SFR and the total is very similar to Grimm et al. (2003). It is of interest here to verify the relation with the total luminosity of HMXBs, given in their eq. (22): . The total luminosity of the sum of the detected point sources is definitely consistent with this estimate, although a similar scatter in the vs. SFR relation is evident. This could be due either to large uncertainties in the determination of the correct SFR, or to some intrinsic physical effects.
A large sample of ULXs has been assembled by Swartz et al. (2011) by searching about a hundred galaxies, up to D = 14.5 Mpc. The total effective SFR is . We plot their XLF curve in Figure 5 for reference as a dashed line, after rescaling the luminosity to the 0.5-10 keV band by using a power law slope of . The number of ULXs in the Swartz et al. (2011) sample is 86 (to be compared with our 50) at L erg/s; 16 (to be compared with our 23) at L erg/s; and 6 (to be compared with our 8) at L erg/s. At face value the RiGs XLF is flatter than the Swartz et al. one. However, a straightforward comparison would be incorrect, since we know that we have lost some sources at low fluxes. Figure 5 shows a more significant comparison between the distribution corrected for the presence of diffuse emission and the Swartz et al. (2011) fit. In comparison with the Grimm et al. (2003) curve we see an excess of only two sources at high luminosities, indicating that a higher cut-off LX might be more appropriate for the RiG XLF. The trend of RiGs XLF to be flatter with respect to Swartz et al. (2011) is still present, indicating a larger incidence of high sources, consistent with the fact that the Swartz et al. (2011) sample includes galaxies of all types including ellipticals, and therefore has a substantial population of low-mass X-ray binaries with a steeper XLF. We think that the outliers effect merits further investigation even though the small number statistics definitely affects the results.
4 Discussion
We have presented the first XLF derived solely from ring galaxies and in particular from sources associated to the ring itself. We deem this a “clean” sample of ULXs produced from a single burst of recent star formation in a peculiar and energetic environment.
There are additional X-ray sources in the galaxies’ area, but their chance of being interlopers is larger than in the ring (see e.g. Heida et al. (2013); Wolter & Trinchieri (2004); Wolter et al. (2015)) otherwise and they could be due to a different formation mechanism or a different episode of star formation.
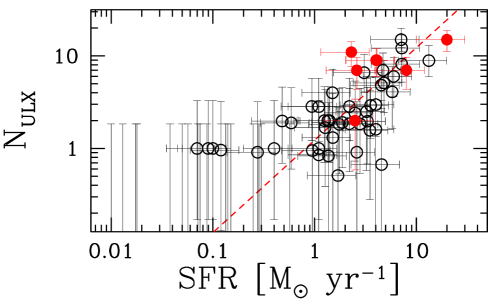
In late-type galaxies, there is a strong and almost linear correlation between the number of ULXs per host galaxy and the SFR of the host galaxy (e.g. Swartz et al. 2009; Mapelli et al. 2009, 2010, 2011; Mineo et al. 2011). This has been interpreted as the smoking gun for the association of ULXs with high-mass X-ray binaries in regions of recent star formation. In Fig. 6, we compare the galaxies considered in this paper with the sample of 66 late-type galaxies reported by Mapelli et al. (2011), which is an update of the sample published by Mapelli et al. 2010. Given the large uncertainty of the SFR we plot an errobar at 50% of the SFR value, for consistency with Mapelli et al. (2010). With the addition of the ring galaxies studied in this paper the total correlation remains consistent with that reported by Mapelli et al. (2011). Moreover, our galaxies occupy the high SFR and high ULX number region of the plane covered by the comparison sample.
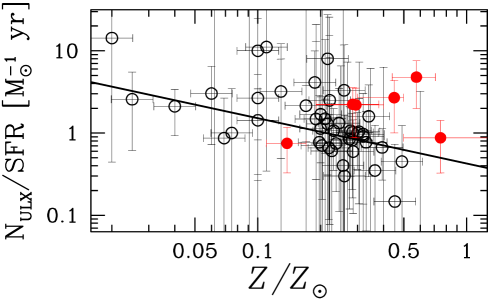
Several studies (Mapelli et al. 2009, 2010, 2011; Kaaret et al. 2011; Prestwich et al. 2013; Brorby et al. 2014, 2016) also suggest that there is an anti-correlation between the number of ULXs per host galaxy (normalized to the SFR) and the metallicity of the host galaxy. The interpretation of this result is still debated. This might indicate that a large fraction of ULXs are associated with massive stellar black holes ( M⊙), which are expected to form at sub-solar metallicity (e.g. Mapelli et al. 2009; Zampieri & Roberts 2009; Mapelli et al. 2013; Mapelli & Zampieri 2014). Alternatively, it might suggest that metal-poor X-ray binaries are more luminous than their metal-rich peers (e.g. Linden et al. 2010), which could be the case for both BH or NS counterparts.
| Name | logL/L | LX(0.5-10 keV) | Net Counts | XLF corr | Notes |
|---|---|---|---|---|---|
| erg s-1 | erg s-1 | * | |||
| Cart-N6 | 1.41 | 3.36 | 19.974.69 | 1.0 | (a,b) |
| Cart-N7 | 5.01 | 11.86 | 70.648.60 | 1.0 | counts in 0.3-7 keV |
| Cart-N9 | 4.68 | 11.15 | 66.208.31 | 1.0 | |
| Cart-N10 | 27.54 | 65.49 | 383.7719.77 | 1.0 | |
| Cart-N12 | 3.09 | 7.43 | 43.756.78 | 1.0 | |
| Cart-N13 | 2.69 | 6.37 | 38.026.40 | 1.0 | |
| Cart-N14 | 7.59 | 17.70 | 105.9210.54 | 1.0 | |
| Cart-N15 | 1.15 | 2.66 | 16.064.24 | 1.0 | |
| Cart-N16 | 6.76 | 15.93 | 94.519.90 | 1.0 | |
| Cart-N17 | 8.32 | 19.47 | 116.1010.95 | 1.0 | |
| Cart-N20 | 0.93 | 2.30 | 13.203.87 | 1.0 | |
| Cart-N21 | 0.50 | 1.19 | 6.972.83 | 1.25 | |
| Cart-N22 | 1.02 | 2.47 | 14.284.00 | 1.0 | |
| Cart-N23 | 0.60 | 1.45 | 8.543.16 | 1.10 | |
| Cart-N24 | 0.37 | 0.86 | 5.162.45 | 1.68 | |
| N922-2 | 0.68 | 0.69 | 8.92 | 1.19 | (c) |
| N922-3 | 3.87 | 3.92 | 46.69 | 1.0 | counts corrected for PSF in 0.3-8 keV |
| N922-4 | 24.20 | 24.49 | 341.08 | 1.0 | |
| N922-5 | 1.19 | 1.20 | 14.57 | 1.05 | |
| N922-6 | 1.02 | 1.03 | 13.08 | 1.10 | |
| N922-7 | 0.52 | 0.53 | 6.24 | 1.67 | |
| N922-8 | 3.10 | 3.14 | 44.31 | 1.0 | |
| N922-9 | 0.98 | 0.99 | 13.08 | 1.10 | |
| N922-11 | 3.91 | 3.96 | 43.42 | 1.0 | |
| N922-12 | 8.67 | 8.77 | 121.33 | 1.0 | |
| N922-13 | 0.88 | 0.89 | 12.48 | 1.14 | |
| N922-14 | 0.64 | 0.65 | 7.73 | 1.33 | |
| Arp147-Ring1 | 6.2 | 7.52 | 14.7+4.2-0.5 | 1.25 | (d) |
| Arp147-Ring2 | 2.7 | 3.39 | 6.7+3.0-2.3 | 2.5 | counts in 0.5-8 kEV |
| Arp147-Ring3 | 1.4 | 1.47 | 2.7+2.1-1.4 | 10 | |
| Arp147-Ring4 | 1.6 | 2.06 | 3.7+2.4-1.7 | 5 | |
| Arp147-Ring5 | 5.1 | 3.61 | 7.4+3.2-2.5 | 2.2 | |
| Arp147-Ring6 | 1.9 | 2.43 | 4.5+2.6-1.9 | 3.3 | |
| Arp147-Ring7 | 6.9 | 5.63 | 10.6+3.7-3.0 | 1.7 | |
| Arp147-Ring8 | 6.7 | 6.25 | 11.7+3.8-3.0 | 1.42 | |
| Arp147-Ring9 | 5.7 | 5.54 | 10.5+3.7-3.0 | 1.7 | |
| Arp284-4 | 64 | 64.1 | 265752 | 1.0 | (e,f) |
| Arp284-5 | 0.5 | 0.5 | 215 | 1.0 | count in 0.3-8 keV |
| Arp284-6 | 0.6 | 0.6 | 215 | 1.0 | |
| Arp284-7 | 0.7 | 0.7 | 265 | 1.0 | |
| Arp284-8 | 0.8 | 0.8 | 306 | 1.0 | |
| Arp284-9 | 0.6 | 0.6 | 225 | 1.0 | |
| Arp284-10 | 0.3 | 0.3 | 103 | 1.05 | |
| Arp284-11 | 0.8 | 0.8 | 306 | 1.0 | |
| Arp284-12 | 24 | 27.3 | 107633 | 1.0 |
Note. — Data are from NED unless specified otherwise; NH and distance from literature as in Table 3; scale is the plate scale at the galaxies’ distance.
Note. — MK and B are from NED, SFR and Z from References in column 6.
Note. — Fluxes (0.5-10.0 keV) are computed by ciao/srcflux assuming NH as in Table 1 and = 1.7. Quoted errors are all 90%.
Note. — The table reports the original published LX and the unabsorbed LX in the 0.5-10 keV band computed assuming and Galactic NH as in Notes (and Table 1).
Upper limits in flux for each observation and relative corresponding luminosity at the distance of the individual galaxies. Name fX (0.5-2 keV) LX (0.5-2 keV) Arearing Contamination 10-15 erg cm 1039 erg cm-2 ′′ src/galaxy Cartwheel Galaxy 0.18 0.32 2478 0.43 NGC 922 0.80 0.20 3888 0.27 Arp 147 2.7 0.54 294 0.009 AM 0644741 0.83 0.78 3010 0.20 Arp 143 1.2 0.44 2032 0.11 Arp 148 1.1 2.63 282 0.016 Arp 284 0.8 0.44 1399 0.10
Fig. 7 shows the number of ULXs (normalized to the SFR) versus the metallicity for six of the galaxies in our sample (Arp 148 is not included because it lacks a metallicity measurement), compared to the sample by Mapelli et al. (2011). The overall trend is still the same, and our RiGs seem to sit at the high NULX and high metallicity end. While this seems a tantalizing result, it is important to stress that most galaxies in our sample (with the exception of the Cartwheel) lack an accurate metallicity estimate, while the sample of Mapelli et al. (2011) was selected on the basis of the availability of a reliable metallicity estimate. We stress that the true uncertainties on the metallicity content is probably much higher than what plotted here, which reflects the maximum and minimum measure, or 0.1dex, whichever is larger.
We investigate if the galaxy impact has a direct effect on the nuclear activity of the target galaxies. Most, but not all the ring galaxies show emission in the region corresponding to the original nucleus of the galaxy before the impact. In two galaxies it is not straightforward to distinguish between the circumstellar diffuse emission of the galaxy and a central nuclear source (NGC 922) or it is not obvious where the optical nucleus currently is (Arp 147). The impact, in fact, might have been slightly different for different galaxies and/or projection effects might make the nucleus appear projected onto the ring (Gerber et al. 1992; Mapelli & Mayer 2012). The presence of an active nucleus is not ubiquitous: the Cartwheel Galaxy for instance does not have one. With the small statistics available we infer about a 60% chance of finding an X-ray faint nucleus (L erg/s) in RiGs, implying that the effect of the impact on the activity of the nucleus, if present, is mild.
As discussed in Sect. 3, we find a substantial agreement with previous measures of the XLF (e.g. Swartz et al. (2011)), with a hint to a flatter slope and a larger number of bright ULXs in RiGs. An interesting comparison could be made with the results of Wang et al. (2016) (similar analyses were done previously, with smaller samples, by Kilgard et al. (2002, 2005)) for more than 300 galaxies spanning all morphological types observed in the Chandra ACIS catalog. These authors find a decrease in the steepness of the XLF going from early to late types, with peculiar and irregular being the flattest. The high LX sample is dominated by late type objects, which in turn is dominated by spirals. The peculiar galaxies slope, to which RiGs should better compare, is , consistent with findings in this paper and in Swartz et al. (2011).
Given the recent discovery of PULXs (see Sect. 1), it is tempting to speculate about the composition of the XLF in this sample. We do not really know how to distinguish observationally PULXs, unless pulsation are seen, which might be a rare event also for known PULXs. A first attempt at proposing a discrimination has been based on the spectral shape of the X-ray emission (Pintore et al. 2017). In our case, however, the sources are too faint to measure the spectral shape of single sources. The spectrum of the collective sample of detected point sources has a slope of which does not allow us to discriminate. A bimodal flux distribution has been observed in a few PULXs, which might depend on the propeller effect (Tsygankov et al. 2016; Israel et al. 2017b, a) or on changes in the accretion rate leading to accretion flow sphericization (Grebenev 2017). To establish the presence of a low flux state is a very observationally consuming task.
The collective sample of RiGs seems to confirm the effect of low metallicity on the production of ULXs, especially if compared with a sample of nearby Luminous Infrared Galaxies (Luangtip et al. 2015) selected to have a large SFR ( M⊙/yr) which shows a large deficit in ULX per unit SFR, consistent also with the results of the high metallicity sample from Prestwich et al. (2013). The luminous infrared galaxies in the Luangtip et al. (2015) sample have in fact metallicity generally , however the authors claim a significant contribution from dust which obscures the emission of the fainter sources and impedes their detection. The issue is possibly more complex and better and more adequate measures - e.g. metallicity at different position in the galaxy - are necessary to address it.
5 Conclusions
We have collected all the ”bright and famous” ring galaxies observed by Chandra with the aim of studying their point sources population detected along the ring. We use both our analysis and literature data to gather an homogeneous sample of 50 ULXs, while 63 sources in total are detected along the seven rings. We construct the first ring-only XLF. This is an estimate of the ULX luminosity distribution at a young age after the burst of star formation, even if uncertainties in the age of the stellar population are still large, both theoretically and observationally. However the young age of the encounter favors both high mass donors and BH accretor, since we should be observing these galaxies at most a few hundreds Myr after the beginning of the star formation episode (see e.g. Renaud et al. (2018)). We see a larger average number of ULXs per galaxy than in other galaxies, even if there is not a statistical distinction with the bulk of spiral galaxies XLF. We are tempted to favor a high mass BH interpretation for the brightest objects, given their relative higher luminosities, given also the recent discovery of BHs of mass in excess of 60 M⊙ due to their gravitational wave emission from coalescence by the LIGO-Virgo collaboration (Abbott et al. 2016, 2017a, 2017b). RiGs, the Cartwheel in particular due to its large number of ULXs, are perfect test-bed for models of binary formation and the origin of ULX, such as the one from Wiktorowicz et al. (2017).
References
- Abbott et al. (2016) Abbott, B. P., Abbott, R., Abbott, T. D., et al. 2016, Phys. Rev. D, 93, 122003
- Abbott et al. (2017a) —. 2017a, Physical Review Letters, 118, 221101
- Abbott et al. (2017b) —. 2017b, Physical Review Letters, 119, 141101
- Abbott et al. (2017c) —. 2017c, Phys. Rev. D, 96, 022001
- Abolfathi et al. (2017) Abolfathi, B., Aguado, D. S., Aguilar, G., et al. 2017, ArXiv e-prints, arXiv:1707.09322
- Anders & Grevesse (1989) Anders, E., & Grevesse, N. 1989, Geochim. Cosmochim. Acta, 53, 197
- Appleton et al. (1987) Appleton, P. N., Ghigo, F. D., van Gorkom, J. H., Schombert, J. M., & Struck-Marcell, C. 1987, Nature, 330, 140
- Appleton & Marston (1997) Appleton, P. N., & Marston, A. P. 1997, AJ, 113, 201
- Arnaud (1996) Arnaud, K. A. 1996, in Astronomical Society of the Pacific Conference Series, Vol. 101, Astronomical Data Analysis Software and Systems V, ed. G. H. Jacoby & J. Barnes, 17
- Athanassoula & Bosma (1985) Athanassoula, E., & Bosma, A. 1985, ARA&A, 23, 147
- Bachetti et al. (2014) Bachetti, M., Harrison, F. A., Walton, D. J., et al. 2014, Nature, 514, 202
- Beirão et al. (2009) Beirão, P., Appleton, P. N., Brandl, B. R., et al. 2009, ApJ, 693, 1650
- Bogdán & Gilfanov (2011) Bogdán, Á., & Gilfanov, M. 2011, MNRAS, 418, 1901
- Brorby et al. (2014) Brorby, M., Kaaret, P., & Prestwich, A. 2014, MNRAS, 441, 2346
- Brorby et al. (2016) Brorby, M., Kaaret, P., Prestwich, A., & Mirabel, I. F. 2016, MNRAS, 457, 4081
- Carpano et al. (2018) Carpano, S., Haberl, F., Maitra, C., & Vasilopoulos, G. 2018, MNRAS, 476, L45
- Crivellari et al. (2009) Crivellari, E., Wolter, A., & Trinchieri, G. 2009, A&A, 501, 445
- Doe et al. (2007) Doe, S., Nguyen, D., Stawarz, C., et al. 2007, in Astronomical Society of the Pacific Conference Series, Vol. 376, Astronomical Data Analysis Software and Systems XVI, ed. R. A. Shaw, F. Hill, & D. J. Bell, 543
- Farrell et al. (2009) Farrell, S. A., Webb, N. A., Barret, D., Godet, O., & Rodrigues, J. M. 2009, Nature, 460, 73
- Feng & Kaaret (2008) Feng, H., & Kaaret, P. 2008, ApJ, 675, 1067
- Feng et al. (2010) Feng, H., Rao, F., & Kaaret, P. 2010, ApJ, 710, L137
- Feng & Soria (2011) Feng, H., & Soria, R. 2011, New A Rev., 55, 166
- Few et al. (1982) Few, J. M. A., Arp, H. C., & Madore, B. F. 1982, MNRAS, 199, 633
- Fogarty et al. (2011) Fogarty, L., Thatte, N., Tecza, M., et al. 2011, MNRAS, 417, 835
- Fosbury & Hawarden (1977) Fosbury, R. A. E., & Hawarden, T. G. 1977, MNRAS, 178, 473
- Fragos et al. (2013) Fragos, T., Lehmer, B. D., Naoz, S., Zezas, A., & Basu-Zych, A. 2013, ApJ, 776, L31
- Freeman et al. (2001) Freeman, P., Doe, S., & Siemiginowska, A. 2001, in Proc. SPIE, Vol. 4477, Astronomical Data Analysis, ed. J.-L. Starck & F. D. Murtagh, 76–87
- Fruscione et al. (2006) Fruscione, A., McDowell, J. C., Allen, G. E., et al. 2006, in Proc. SPIE, Vol. 6270, Society of Photo-Optical Instrumentation Engineers (SPIE) Conference Series, 62701V
- Fürst et al. (2016) Fürst, F., Walton, D. J., Harrison, F. A., et al. 2016, ApJ, 831, L14
- Gao et al. (2003) Gao, Y., Wang, Q. D., Appleton, P. N., & Lucas, R. A. 2003, ApJ, 596, L171
- García-Vargas et al. (1997) García-Vargas, M. L., González-Delgado, R. M., Pérez, E., et al. 1997, ApJ, 478, 112
- Garmire et al. (2003) Garmire, G. P., Bautz, M. W., Ford, P. G., Nousek, J. A., & Ricker, Jr., G. R. 2003, in Proc. SPIE, Vol. 4851, X-Ray and Gamma-Ray Telescopes and Instruments for Astronomy., ed. J. E. Truemper & H. D. Tananbaum, 28–44
- Gerber et al. (1992) Gerber, R. A., Lamb, S. A., & Balsara, D. S. 1992, ApJ, 399, L51
- Gerber et al. (1996) —. 1996, MNRAS, 278, 345
- Grebenev (2017) Grebenev, S. A. 2017, Astronomy Letters, 43, 464
- Grimm et al. (2003) Grimm, H.-J., Gilfanov, M., & Sunyaev, R. 2003, MNRAS, 339, 793
- Heida et al. (2013) Heida, M., Jonker, P. G., Torres, M. A. P., et al. 2013, MNRAS, 433, 681
- Higdon (1995) Higdon, J. L. 1995, ApJ, 455, 524
- Higdon (1996) —. 1996, ApJ, 467, 241
- Higdon et al. (2015) Higdon, J. L., Higdon, S. J. U., Martín Ruiz, S., & Rand, R. J. 2015, ApJ, 814, L1
- Higdon et al. (2011) Higdon, J. L., Higdon, S. J. U., & Rand, R. J. 2011, ApJ, 739, 97
- Higdon et al. (1997) Higdon, J. L., Rand, R. J., & Lord, S. D. 1997, ApJ, 489, L133
- Higdon & Wallin (1997) Higdon, J. L., & Wallin, J. F. 1997, ApJ, 474, 686
- Israel et al. (2017a) Israel, G. L., Belfiore, A., Stella, L., et al. 2017a, Science, 355, 817
- Israel et al. (2017b) Israel, G. L., Papitto, A., Esposito, P., et al. 2017b, MNRAS, 466, L48
- Jeske (1986) Jeske, N. A. 1986, PhD thesis, California Univ., Berkeley.
- Joye (2011) Joye, W. 2011, in Astronomical Data Analysis Software and Systems XX. ASP Conference Proceedings, Vol. 442, proceedings of a Conference held at Seaport World Trade Center, Boston, Massachusetts, USA on 7-11 November 2010. Edited by Ian N. Evans, Alberto Accomazzi, Douglas J. Mink, and Arnold H. Rots. San Francisco: Astronomical Society of the Pacific, 2011., p.633, Vol. 442, 633
- Kaaret et al. (2017) Kaaret, P., Feng, H., & Roberts, T. P. 2017, ARA&A, 55, 303
- Kaaret et al. (2011) Kaaret, P., Schmitt, J., & Gorski, M. 2011, ApJ, 741, 10
- Kilgard et al. (2002) Kilgard, R. E., Kaaret, P., Krauss, M. I., et al. 2002, ApJ, 573, 138
- Kilgard et al. (2005) Kilgard, R. E., Cowan, J. J., Garcia, M. R., et al. 2005, ApJS, 159, 214
- Kim & Fabbiano (2003) Kim, D.-W., & Fabbiano, G. 2003, ApJ, 586, 826
- King & Lasota (2016) King, A., & Lasota, J.-P. 2016, MNRAS, 458, L10
- Lançon et al. (2001) Lançon, A., Goldader, J. D., Leitherer, C., & González Delgado, R. M. 2001, ApJ, 552, 150
- Linden et al. (2010) Linden, T., Kalogera, V., Sepinsky, J. F., et al. 2010, ApJ, 725, 1984
- Liu et al. (2013) Liu, J.-F., Bregman, J. N., Bai, Y., Justham, S., & Crowther, P. 2013, Nature, 503, 500
- Luangtip et al. (2015) Luangtip, W., Roberts, T. P., Mineo, S., et al. 2015, MNRAS, 446, 470
- Lynds & Toomre (1976) Lynds, R., & Toomre, A. 1976, ApJ, 209, 382
- Mapelli (2016) Mapelli, M. 2016, MNRAS, 459, 3432
- Mapelli et al. (2009) Mapelli, M., Colpi, M., & Zampieri, L. 2009, MNRAS, 395, L71
- Mapelli & Mayer (2012) Mapelli, M., & Mayer, L. 2012, MNRAS, 420, 1158
- Mapelli et al. (2011) Mapelli, M., Ripamonti, E., Zampieri, L., & Colpi, M. 2011, Astronomische Nachrichten, 332, 414
- Mapelli et al. (2010) Mapelli, M., Ripamonti, E., Zampieri, L., Colpi, M., & Bressan, A. 2010, MNRAS, 408, 234
- Mapelli & Zampieri (2014) Mapelli, M., & Zampieri, L. 2014, ApJ, 794, 7
- Mapelli et al. (2013) Mapelli, M., Zampieri, L., Ripamonti, E., & Bressan, A. 2013, MNRAS, 429, 2298
- Mayya et al. (2005) Mayya, Y. D., Bizyaev, D., Romano, R., Garcia-Barreto, J. A., & Vorobyov, E. I. 2005, ApJ, 620, L35
- Mesinger et al. (2013) Mesinger, A., Ferrara, A., & Spiegel, D. S. 2013, MNRAS, 431, 621
- Mezcua et al. (2015) Mezcua, M., Roberts, T. P., Lobanov, A. P., & Sutton, A. D. 2015, MNRAS, 448, 1893
- Miller et al. (2015) Miller, J., Burke, D. J., Evans, I. N., Evans, J. D., & McLaughlin, W. 2015, in Astronomical Data Analysis Software an Systems XXIV (ADASS XXIV), Proceedings of a conference held 5-9 October 2014 at Calgary, Alberta Canada. Edited by A. R. Taylor and E. Rosolowsky. San Francisco: Astronomical Society of the Pacific, 2015., p.111, Vol. 495, 111
- Mineo et al. (2011) Mineo, S., Gilfanov, M., & Sunyaev, R. 2011, Astronomische Nachrichten, 332, 349
- Mineo et al. (2012) —. 2012, MNRAS, 419, 2095
- Moretti et al. (2003) Moretti, A., Campana, S., Lazzati, D., & Tagliaferri, G. 2003, ApJ, 588, 696
- Motch et al. (2014) Motch, C., Pakull, M. W., Soria, R., Grisé, F., & Pietrzyński, G. 2014, Nature, 514, 198
- Pellerin et al. (2010) Pellerin, A., Meurer, G. R., Bekki, K., et al. 2010, AJ, 139, 1369
- Pintore et al. (2017) Pintore, F., Zampieri, L., Stella, L., et al. 2017, ApJ, 836, 113
- Pizzolato et al. (2010) Pizzolato, F., Wolter, A., & Trinchieri, G. 2010, MNRAS, 406, 1116
- Portegies Zwart et al. (2004) Portegies Zwart, S. F., Dewi, J., & Maccarone, T. 2004, MNRAS, 355, 413
- Prestwich et al. (2013) Prestwich, A. H., Tsantaki, M., Zezas, A., et al. 2013, ApJ, 769, 92
- Prestwich et al. (2012) Prestwich, A. H., Galache, J. L., Linden, T., et al. 2012, ApJ, 747, 150
- Ranalli et al. (2003) Ranalli, P., Comastri, A., & Setti, G. 2003, A&A, 399, 39
- Rappaport et al. (2010) Rappaport, S., Levine, A., Pooley, D., & Steinhorn, B. 2010, ApJ, 721, 1348
- Renaud et al. (2018) Renaud, F., Athanassoula, E., Amram, P., et al. 2018, MNRAS, 473, 585
- Romano et al. (2008) Romano, R., Mayya, Y. D., & Vorobyov, E. I. 2008, AJ, 136, 1259
- Schmitt et al. (2006) Schmitt, H. R., Calzetti, D., Armus, L., et al. 2006, ApJS, 164, 52
- Smith et al. (2005) Smith, B. J., Struck, C., & Nowak, M. A. 2005, AJ, 129, 1350
- Strauss et al. (1992) Strauss, M. A., Huchra, J. P., Davis, M., et al. 1992, ApJS, 83, 29
- Swartz et al. (2011) Swartz, D. A., Soria, R., Tennant, A. F., & Yukita, M. 2011, ApJ, 741, 49
- Swartz et al. (2009) Swartz, D. A., Tennant, A. F., & Soria, R. 2009, ApJ, 703, 159
- Tsygankov et al. (2016) Tsygankov, S. S., Mushtukov, A. A., Suleimanov, V. F., & Poutanen, J. 2016, MNRAS, 457, 1101
- van der Marel (2004) van der Marel, R. P. 2004, Coevolution of Black Holes and Galaxies, 37
- Walton et al. (2018) Walton, D. J., Fürst, F., Harrison, F. A., et al. 2018, MNRAS, 473, 4360
- Wang et al. (2016) Wang, S., Qiu, Y., Liu, J., & Bregman, J. N. 2016, ApJ, 829, 20
- Wiktorowicz et al. (2017) Wiktorowicz, G., Sobolewska, M., Lasota, J.-P., & Belczynski, K. 2017, ApJ, 846, 17
- Wolter et al. (2015) Wolter, A., Esposito, P., Mapelli, M., Pizzolato, F., & Ripamonti, E. 2015, MNRAS, 448, 781
- Wolter & Trinchieri (2004) Wolter, A., & Trinchieri, G. 2004, A&A, 426, 787
- Wolter et al. (2006) Wolter, A., Trinchieri, G., & Colpi, M. 2006, MNRAS, 373, 1627
- Wolter et al. (1999) Wolter, A., Trinchieri, G., & Iovino, A. 1999, A&A, 342, 41
- Wong et al. (2006) Wong, O. I., Meurer, G. R., Bekki, K., et al. 2006, MNRAS, 370, 1607
- Yue et al. (2013) Yue, B., Ferrara, A., Salvaterra, R., & Chen, X. 2013, MNRAS, 431, 383
- Zampieri & Roberts (2009) Zampieri, L., & Roberts, T. P. 2009, MNRAS, 400, 677
- Zezas et al. (2007) Zezas, A., Fabbiano, G., Baldi, A., et al. 2007, ApJ, 661, 135