Optical creation and temperature stability of the hidden charge density wave state in 1T-TaS2-xSex
Abstract
The femtosecond transinet optical spectroscopy is employed to study the relaxation dynamics of the equilibrium and hidden metastable charge-density-wave states in single crystals of 1T-TaS2-xSex as a function of the Se doping . Similarly to pristine 1T-TaS2, the transition to a hidden phase is observed at low temperature after a quench with a single 50 fs laser pulse, in the commensurate Mott phase up to . The photo-induced hidden-phase formation is accompanied by a notable change in the coherent phonon spectra, and particularly the collective amplitude mode. While the stability of the hidden phase with increased temperatures is only slightly dependent of the Se content the hidden-phase creation-treshold fluence strongly increases with the Se content from 1 to mJ/cm2.
Introduction
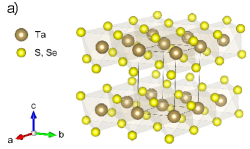
The interplay of different degrees of freedom shapes the manifold of emergent electronic and structural ordered phases in low-dimensional systems with competing interactions. A marked example is the class of non-semiconducting layered transition-metal dichalcogenides.Wilson et al. (1975) In this class 1T-TaS2 is of particular interest due to the presence of a meta-stable hidden charge-density-wave state induced by short strongly-nonequilibrium opticalStojchevska et al. (2014) or electricalVaskivskyi et al. (2015); Hollander et al. (2015); Vaskivskyi et al. (2016) excitations.
In equilibrium the pristine 1T-TaS2 shows a series of electronic phase transitions upon cooling from high temperature.Thomson et al. (1994) First, at K a transition to an incommensurate CDW (IC) phase is observed. With further cooling a first order transition to a nearly commensurate (NC) phase at K results in formation of star-shaped-polaron clusters. Below =183 K the system undergoes a first-order lock-in transition into a commensurate (C) phase where the polarons order commensurately with the underlying atomic lattice. Concurrently, after Brillouin zone folding due to the enlarged unit cell, the resulting narrow half-filled Ta 5 valence band splits due to the electronic correlations forming a 300 meV Mott insulator gap.Fazekas and Tosatti (1979); Dardel et al. (1992) Upon heating the C phase an additional trigonal (T) phase is observed between the C and NC phases in the range . The C Mott state can be suppressed by pressureSipos et al. (2008) or chemical dopingDi Salvo et al. (1975) leading to the superconductingLiu et al. (2013); Ang et al. (2013) ground state.
The nonequilibrium dynamics of this compound have been under intensive investigation recentlyDemsar et al. (2002); Dean et al. (2011); Perfetti et al. (2006); Stojchevska et al. (2014); Haupt et al. (2016); Laulhé et al. (2017); Ligges et al. (2018), leading to the discoveryStojchevska et al. (2014) of the low-temperature meta-stable hidden (H) phase. The phase forms under strongly nonequilibrium conditions on a short timescaleRavnik et al. (2018) and at low the H phase is practically stableStojchevska et al. (2014); Vaskivskyi et al. (2015). With increasing the characteristic relaxation time, , shows activated behavior , where depends on the in-plane strainVaskivskyi et al. (2015). In all-optical transient reflectivity experiments in bulk samples drops to the single scan timescale of minutes at K.Stojchevska et al. (2014); Vaskivskyi et al. (2015) From the point of view of possible memory applications it would be desirable to improve the stability of the H state at higher . Furthermore, the origin of metastability is still not fully understood, and it is thus of importance to investigate the influence of different external control parameters on its properties.
In the present case, we introduce isovalent Se substitution for S: -TaS2-xSex, which exerts a chemical strain and introduces disorder. The introduction of the chemical strain and disorder strongly alters the electronic ground state of -TaS2-xSex.Liu et al. (2013); Ang et al. (2013) With increasing the the hysteresis related to the NC-C-T phase transitions broadens, with the C phase being pushed to lower on cooling up to , whereafter the C Mott-insulating ground state is suppressed and the superconducting ground state appears.Liu et al. (2013); Ang et al. (2013). The broader hysteresis at low doping suggests that the doping increases the free-energy barriers between the C, NC and T phases in addition to the suppression of the the insulating Mott state. Since a high enough free-energy barrier is crucial for the stability of the metallic H state we therefore investigated the influence of the Se doping on its formation threshold and stability.
Recently, the collective mode spectral shifts in 1T-TaS2 were investigated both in equilibrium and in the metastable H and T states over a large range of temperatures.Ravnik et al. (2018) Shifts in the collective mode frequency, which presumably arise from changes of electronic structure accompanying the transition to the H state, were shown to be a useful fingerprint signature of the H state. Here we use this to investigate the stability of the H state in 1T-TaS2-xSex with different .
In the ultrafast transient reflectivity response the low frequency-phonon and collective mode frequencies are easily characterized by analysing the coherent transient response. Stojchevska et al. (2014); Ravnik et al. (2018) We therefore employ the ultrafast transient reflectivity spectroscopy to 1T-TaS2-xSex ( 0, 0.15, 0.2, 0.5 and 0.6) single crystals before and after strong laser pulse photoexcitation to study the influence of the Se doping on the formation and temperature stability of the H-phase.
Experimental
Single crystals of 1T-TaS2-xSex were grown by means of the chemical transport reaction with iodine as the transport agent. Appropriate amounts of of Ta, S and Se powders were put together with a small amount of I2 into evacuated quartz ampules and placed into a three-zone temperature gradient furnace. The crystal growth was achieved by setting the temperature gradient across the ampules to for 216 hours. Finally, ampules were quenched into water.
The Se content was determined by means of the standard energy-dispersive X-ray spectroscopy (EDS). For the optical measurements the characterized crystals were mounted on a cold finger of a liquid-He flow optical cryostat equipped with CaF2 windows and cleaved to expose fresh surface.
The optical pump-probe experiments were performed using a train of 50 fs laser pulses at 800 nm from a Ti:Sapphire laser system at a 250-kHz repetition rate. In order to ensure minimal heating and avoid switching into the H-phase the pump and probe fluences were kept constant during all measurements and estimated to be J/cm2 and J/cm2 for the pump and probe pulses, respectively.
For switching into the H-phase an additional single laser pulse at 800 nm with fluence mJ/cm2 was picked form the pulse train by means of an acousto-optical modulator driven by a programmable waveform generator.
Results
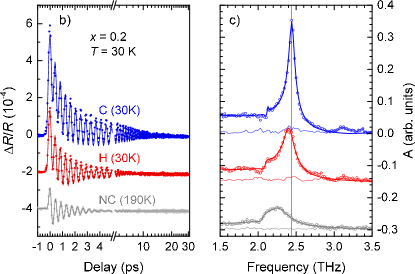
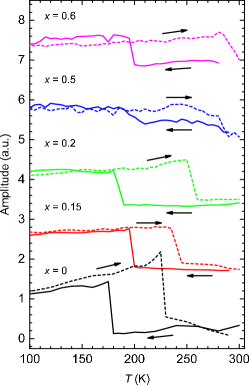
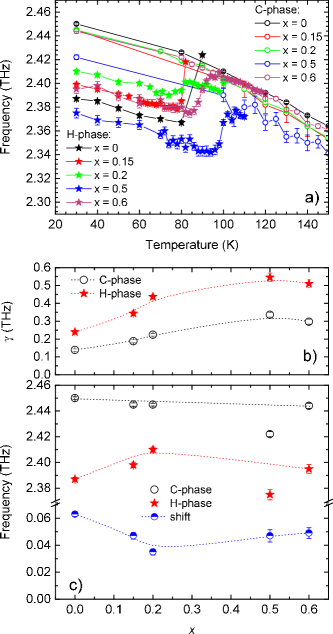
In Fig. 1 we plot the charateristic transient reflectivity transients ( ) in the the C, H and NC phases in the sample together with the Fourier transform amplitude (FTA) spectra. The C and NC phases differ strongly in the shape and the amplitude of the transients. To determine and we first measured the -dependence of the transients during a cooling-warming cycle between K and K . In Fig. 2 we show the normalized amplitude of the transients. Contrary to Refs. Di Salvo et al. (1975); Liu et al. (2013) we observe a weak increase of with increasing while and the broadening of the hysteresis show a similar trend.
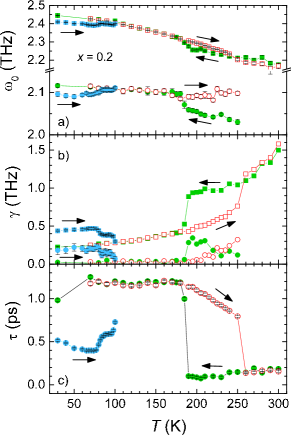
We further analyse the -dependent transients using the displacive coherent excitation (DCE) modelZeiger et al. (1992); Stojchevska et al. (2017); Ravnik et al. (2018). Contrary to Ravnik et al. (2018), where four modes were necessary to completely describe the lineshape in the vicinity of the 2.45-THz amplitude (AM) mode, using only two modes at THz and THz together with the initial exponential relaxation enabled a fair fit to the data (see Fig. 1). The -dependence of selected fit parameters for sample is shown in Fig. 3. The -THz mode could be unambigously fitted only below K due to weaker intensities and strong broadening of the modes in the NC and T phases. Apart from the frequencies, the mode damping and the initial relaxation decay time , both show notable differences in different CDW phases.
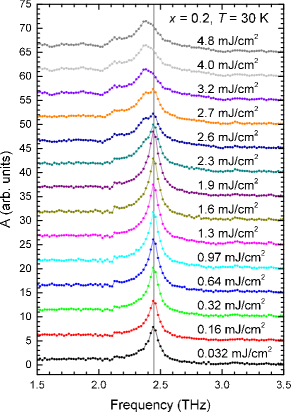
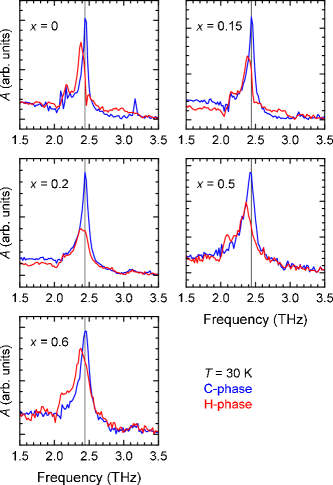
Next, we checked for the presence of the H-phase and determine the switching fluence at K by measuring a series of the low-fluence transients after an exposure to a single switching pulse of increasing fluence. An example sequence of the FTA spectra with increasing in the sample are shown in Fig. 4. The H phase is characterized mainly by the softening of the strongest coherent mode from THz in the C phase to THz (at K). The onset of the characteristic AM mode spectral weight transferStojchevska et al. (2014) is observed at mJ/cm2. The switching is complete above mJ/cm2. In the intermediate -interval the spectral shape indicates incomplete switching with the presence of both, C and H phases. The behavior is similar for all studied Se contents with the C- and H- phase spectra and the corresponding threshold fluences, , shown in Fig. 5 and Table 1. Here, is defined as the minimal fluence where the completed spectral change is observed and it strongly increases with increasing .
| (@ 30 K) | ||||
|---|---|---|---|---|
| 0 | 180 K | 225 K | 1 mJ/cm2 | 80 K |
| 0.15 | 200 K | 240 K | mJ/cm2 | 80 K |
| 0.2 | 185 K | 255 K | mJ/cm2 | 80 K |
| 0.5 | 200 K | 280 K | mJ/cm2 | 95 K |
| 0.6 | 200 K | 290 K | mJ/cm2 | 85 K |
Once we had driven the system into the H-phase, we investigated the dependence of the reflectivity transients in the H-phase. In these experiments, the H-phase transition was first triggered by the above-threshold fluence switching pulse at K. Then the transients were recorded using a weak pump-probe sequence at an increasing sequence until the C-phase transient response was observed.
The -dependence of the selected DCE-fit parameters in the H-phase for the sample is also shown in Fig. 3. While the frequencies of both modes soften in the H-phase, the modes decay faster (damping, , increases) and the initial exponential relaxation time, , decreases. With increasing the strongest H-phase mode shows a similar softening with increasing as in the C-phase (see also Fig. 6) until, at , a recovery of the C-phase transient response is observed.111Since the stability time, , of the H-phase strongly depends on Vaskivskyi et al. (2015) is set by the timescale of experimentRavnik et al. (2018), that was minutes in the present case. On shorter timescale the H-phase can be readily observed at much higher .Ravnik et al. (2018)
K does not show a strong variation with 222In the sample we observe a two step recovery of the C-phase with the dominant recovery of the spectral shape at K with the H-phase signature up to K. except for with K (Table 1). In the sample we observe also a slightly softer AM mode in the C-phase together with the softer corresponding mode in the H-phase while for other dopings the frequency shift is observed only in the H-phase.
Discussion
Contrary to earlier resultsDi Salvo et al. (1975); Liu et al. (2013) our samples do not show a significant decrease of with increasing Since the NCC transition is of first order the pinning of the CDW in the NC phase by the Se disorder can play a significant role in supercooling the NC phase. Since the disorder can be sample dependent the difference may be attributed to the sample dependent disorder. On the other hand, our measurements were done under a weak continous pump-probe optical excitation that can contribute to depinning and helps to trigger the transition at higher .
Overall, the observed effect of Se substition on the H phase is two fold. Firstly, the transition temperature TH increases slightly or not at all, with increasing as a result of increasing tensile strainLiu et al. (2013) exerted by the larger Se substitution. We can qualitatively compare the chemical strain effect of Se ion substitution with in-plane differential strain experiments with thin crystals of 1T-TaS2 on different substrates, where a tensile strain on cooling was found to empirically increase . The two trends thus agree qualitatively.
The second effect is that the threshold fluence increases with increasing . Pinning by the Se dopants would be expected to have an opposite effect in stabilizing the domain structure created in the switching process. Another possibility is that the absorption coefficient is changing with Se doping, changing the effective carrier density. The photon absorption near 1.5 eV is related to a charge-transfer excitation between metal and chalcogen, and is close to the absorption edge for this transition. It is therefore concievable that the chalcogen substitution can have an effect on the imaginary part of the dielectric constant in this region. Unfortunately, presently ellipsometric data are not available to confirm or disprove this hypothesis. The effect of disorder may also have an influence if doping is associated with traps (e.g. on interstitials), thus reducing the photinduced carrier density. A threfold increase in threshold fluence would require a significant number of traps, which we consider unlikely.
The frequency of the AM in the C phase does not show a systemtic -dependence while the corresponding mode frequency in the H-phase shows a small,333An order of magnitude smaller than . but detectable, dependence [see Fig. 6 c)]. The absence of the shift in the C-phase indicates that the AM mode eigenvector does not include significant (S,Se) site displacements. Since the corresponding mode observed in the H-phase hardens slightly with increasing the shift can not be related to the larger Se mass. Considering that the broadening of the modes is the most likely inhomogenous and is an order of magnitude larger [see Fig. 6 b)] than the shift the origin of the shift can be attributed to a doping dependence of the Se inhomogeneity.
Moreover, in the sample a notable softening of THz in comparison to the 0.5 samples is observed in both phases. This suggest a possibility of a Se ordering at this doping since correponds to a commensurate 25% filling of the triangular (S,Se) site lattice. The ordering, however, can not be long range since the mode linewidth is the largest at this doping. Nevertheles, the slight increase of the the H-phase stability at could be tentatively linked to enhanced pinning of the H-phase domain walls by partially ordered rows of Se ions.
Conclusions
We demonstrated a successful transition of 1T-TaS2-xSex system to the hidden photo-induced state over a major portion of the Mott-phase region (). The H-state transition is triggered by an ultrafast laser quench similarly to the pristine -TaS2,Stojchevska et al. (2014) but at fluences that significantly increase with increasing from mJ/cm2 at to mJ/cm2 at . The high temperature stability of the H-phase is not significantly influenced by the Se doping despite a much larger effect on the stability of the equilibrium C phase. An exception is Se doping where the slight increase of the the H-phase stability concurent with the AM mode softening could be tentatively linked to partial Se-ion ordering.
Acknowledgements.
The authors acknowledge the financial support of Slovenian Research Agency (research core funding No-P1-0040) and European Research Council Advanced Grant TRAJECTORY (GA 320602) for financial support. L. S. would also like to acknowledge supported by MIZŠ&ESS funds, ULTRA-MEM-Device project, 2014-2015.References
- Wilson et al. (1975) J. A. Wilson, F. Di Salvo, and S. Mahajan, Advances in Physics 24, 117 (1975).
- Stojchevska et al. (2014) L. Stojchevska, I. Vaskivskyi, T. Mertelj, P. Kusar, D. Svetin, S. Brazovskii, and D. Mihailovic, Science 344, 177 (2014).
- Vaskivskyi et al. (2015) I. Vaskivskyi, J. Gospodaric, S. Brazovskii, D. Svetin, P. Sutar, E. Goreshnik, I. A. Mihailovic, T. Mertelj, and D. Mihailovic, Science advances 1, e1500168 (2015).
- Hollander et al. (2015) M. J. Hollander, Y. Liu, W.-J. Lu, L.-J. Li, Y.-P. Sun, J. A. Robinson, and S. Datta, Nano letters 15, 1861 (2015).
- Vaskivskyi et al. (2016) I. Vaskivskyi, I. Mihailovic, S. Brazovskii, J. Gospodaric, T. Mertelj, D. Svetin, P. Sutar, and D. Mihailovic, Nature communications 7, 11442 (2016).
- Thomson et al. (1994) R. Thomson, B. Burk, A. Zettl, and J. Clarke, Physical Review B 49, 16899 (1994).
- Fazekas and Tosatti (1979) P. Fazekas and E. Tosatti, Philosophical Magazine B 39, 229 (1979).
- Dardel et al. (1992) B. Dardel, M. Grioni, D. Malterre, P. Weibel, Y. Baer, and F. Lévy, Phys. Rev. B 46, 7407 (1992).
- Sipos et al. (2008) B. Sipos, A. F. Kusmartseva, A. Akrap, H. Berger, L. Forró, and E. Tutiš, Nat. Mater. 7, 960 (2008).
- Di Salvo et al. (1975) F. Di Salvo, J. Wilson, B. Bagley, and J. Waszczak, Phys. Rev. B 12, 2220 (1975).
- Liu et al. (2013) Y. Liu, R. Ang, W. Lu, W. Song, L. Li, and Y. Sun, Appl. Phys. Lett. 102, 192602 (2013).
- Ang et al. (2013) R. Ang, Y. Miyata, E. Ieki, K. Nakayama, T. Sato, Y. Liu, W. Lu, Y. Sun, and T. Takahashi, Phys. Rev. B 88, 115145 (2013).
- Demsar et al. (2002) J. Demsar, L. Forró, H. Berger, and D. Mihailovic, Phys. Rev. B 66, 041101 (2002).
- Dean et al. (2011) N. Dean, J. C. Petersen, D. Fausti, R. I. Tobey, S. Kaiser, L. Gasparov, H. Berger, and A. Cavalleri, Phys. Rev. Lett. 106, 016401 (2011).
- Perfetti et al. (2006) L. Perfetti, P. Loukakos, M. Lisowski, U. Bovensiepen, H. Berger, S. Biermann, P. Cornaglia, A. Georges, and M. Wolf, Phys. Rev. Lett. 97, 067402 (2006).
- Haupt et al. (2016) K. Haupt, M. Eichberger, N. Erasmus, A. Rohwer, J. Demsar, K. Rossnagel, and H. Schwoerer, Phys. Rev. Lett. 116, 016402 (2016).
- Laulhé et al. (2017) C. Laulhé, T. Huber, G. Lantz, A. Ferrer, S. O. Mariager, S. Grübel, J. Rittmann, J. A. Johnson, V. Esposito, A. Lübcke, L. Huber, M. Kubli, M. Savoini, V. L. R. Jacques, L. Cario, B. Corraze, E. Janod, G. Ingold, P. Beaud, S. L. Johnson, and S. Ravy, Phys. Rev. Lett. 118, 247401 (2017).
- Ligges et al. (2018) M. Ligges, I. Avigo, D. Golež, H. Strand, Y. Beyazit, K. Hanff, F. Diekmann, L. Stojchevska, M. Kalläne, P. Zhou, et al., Physical Review Letters 120, 166401 (2018).
- Ravnik et al. (2018) J. Ravnik, I. Vaskivskyi, T. Mertelj, and D. Mihailovic, Physical Review B 97, 075304 (2018).
- Zeiger et al. (1992) H. Zeiger, J. Vidal, T. Cheng, E. Ippen, G. Dresselhaus, and M. Dresselhaus, Physical Review B 45, 768 (1992).
- Stojchevska et al. (2017) L. Stojchevska, M. Borovšak, P. Foury-Leylekian, J.-P. Pouget, T. Mertelj, and D. Mihailovic, Physical Review B 96, 035429 (2017).