Spiral Arms in Disks: Planets or Gravitational Instability?
Abstract
Spiral arm structures seen in scattered light observations of protoplanetary disks can potentially serve as signposts of planetary companions. They can also lend unique insights into disk masses, which are critical in setting the mass budget for planet formation but are difficult to determine directly. A surprisingly high fraction of disks that have been well-studied in scattered light have spiral arms of some kind (8/29), as do a high fraction (6/11) of well-studied Herbig intermediate mass stars (i.e., Herbig stars ). Here we explore the origin of spiral arms in Herbig systems by studying their occurrence rates, disk properties, and stellar accretion rates. We find that two-arm spirals are more common in disks surrounding Herbig intermediate mass stars than are directly imaged giant planet companions to mature A and B stars. If two-arm spirals are produced by such giant planets, this discrepancy suggests that giant planets are much fainter than predicted by hot start models. In addition, the high stellar accretion rates of Herbig stars, if sustained over a reasonable fraction of their lifetimes, suggest that disk masses are much larger than inferred from their submillimeter continuum emission. As a result, gravitational instability is a possible explanation for multi-arm spirals. Future observations can lend insights into the issues raised here.
1 Introduction
As the birthplaces of planets, protoplanetary disks surrounding young stars lend unique insights into the circumstances under which planets form. The initial masses of disks set an upper limit on the mass budget for planet formation, a basic constraint on theories of how planets form. From the detailed study of disk morphologies, we may also glean evidence of the formation of planets themselves, e.g., from the detection of gaps, rings, and spiral arms created by planets. As a result, numerous studies have examined the protoplanetary disks around T Tauri stars and Herbig stars for clues to their structure and planet formation status.
Despite their fundamental importance, disk masses have been proven difficult to measure. Although disk masses are commonly inferred from submillimeter continuum fluxes, which probe the dust content of disks, several arguments strongly suggest that much of the solids in T Tauri disks have grown beyond the sizes probed by submillimeter continua. As one simple example, submillimeter continuum disk masses are too low to even account for the solids that are known to be locked up in exoplanet populations and debris disks, indicating that T Tauri disks harbor more massive reservoirs of solids than those probed by continuum measurements (Najita & Kenyon, 2014), and disk masses are underestimated as a result.
More graphically, high resolution submillimeter continuum images of disks made with ALMA commonly show stunning rings and gaps (ALMA Partnership et al., 2015; Andrews et al., 2016; Cieza et al., 2016; Isella et al., 2016; Cieza et al., 2017; Loomis et al., 2017; Fedele et al., 2018; Huang et al., 2018; Dipierro et al., 2018), structures that signal that disk solids have grown beyond centimeter sizes and possibly into planetary mass objects (e.g., Dong et al., 2015c; Dipierro et al., 2015; Dong et al., 2017a; Bae et al., 2017). These results exclaim that disks are highly evolved and call into question disk mass estimates made under the usual assumption of simple, unevolved, optically thin disks. Given the difficulty of measuring disk masses through proxies such as dust continuum emission, other approaches are welcome.
Alongside these developments, high contrast images of disks made in scattered light also reveal remarkable features. Near-infrared scattered light imaging observations probe the spatial distribution of small grains, approximately micron-sized or smaller, that are well-coupled to the gas (Zhu et al., 2012; Pinilla et al., 2012). These studies have revealed spiral arms in a growing number of disks (Figure 1), both prominent near-symmetric two-arm spirals (e.g., Grady et al., 2013; Benisty et al., 2015) and more flocculent multi-arm spirals on smaller scales and at lower contrast (e.g., Fukagawa et al., 2004; Hashimoto et al., 2011). Spiral arms can be produced by either gravitational instability (e.g., Rice et al., 2003; Lodato & Rice, 2004; Stamatellos & Whitworth, 2008; Kratter et al., 2010; Kratter & Lodato, 2016) or the presence of massive companions (gas giant to stellar masses; e.g., Kley & Nelson, 2012; Zhu et al., 2015; Muñoz & Lai, 2016).
The presence or absence of spiral arms in disks, if induced by gravitational instability, can place a dynamical constraint on disk masses. Gravitational instability occurs when the destabilizing self-gravity of a disk dominates over the restoring forces of gas pressure and differential rotation (Toomre, 1964; Goldreich & Lynden-Bell, 1965), a requirement that roughly translates into under typical conditions (Kratter & Lodato, 2016). Spiral arms induced by gravitational instability are expected to appear nearly symmetric in scattered light imaging, with the number of arms roughly scaling as (Lodato & Rice, 2004, 2005; Cossins et al., 2009; Dong et al., 2015a).
Planetary companions can also drive spiral arms (Goldreich & Tremaine, 1979; Ogilvie & Lubow, 2002). A massive companion (above a few ) generates a set of near-symmetric two-arm spirals interior to its orbit, similar to the morphology of observed two-arm spirals (Dong et al., 2015b, see also Fig. 2a,b), with the companion located at the tip of the primary arm (e.g., Zhu et al., 2015; Fung & Dong, 2015; Bae et al., 2016). Lower mass companions () may generate additional arms interior to their orbits, weaker than the primary and secondary arms in scattered light (e.g., Juhász et al., 2015; Fung & Dong, 2015; Lee, 2016; Bae et al., 2017; Bae & Zhu, 2018, see also Fig. 2d,e). If spiral arms are driven by planets, arm morphologies can provide clues to the location and masses of the planets.
Here we explore these hypotheses for the origin of the spiral arms detected in scattered light by comparing (i) the demographics of arm-bearing disks (disk masses and stellar accretion rates) with those of other young stars and (ii) the incidence rate of arms compared to that of resolved planetary companions to mature stars. Although we begin by considering the detection rates of spiral arms in disks surrounding both T Tauri stars and Herbig stars, we end up focusing more closely on the properties of the higher mass Herbig stars, where the census of scattered light structures is more complete.
In §2 we characterize the occurrence rate of spiral arm structures in scattered light imaging of disks. To explore whether spiral arms could be produced by orbiting companions, we compare in §3 the occurrence rates of spiral arms in disks to that of giant planetary companions to mature stars. In §4 we explore the alternative possibility that spiral arms are driven by gravitational instaibility by examining the masses of disks that show spiral arm structures, as probed by submillimeter continuum emission and stellar accretion rates. In §5 we examine the planet and gravitational instability hypotheses in greater detail before suggesting scenarios that are potentially consistent with our results. We summarize our results in §6, where we also describe future studies that can lend insights into the issues raised here.
2 Sample Selection and Statistics
In near-infrared scattered light imaging of disks, spiral arms have been found in both embedded Class 0/I objects surrounded by infalling envelopes (Canovas et al., 2015; Liu et al., 2016b) and revealed Class II objects (i.e., Herbig and T Tauri stars; Figure 1). While gravitational instability may drive the arms in Class 0/I disks (e.g., Vorobyov & Basu, 2005, 2010; Tobin et al., 2016; Pérez et al., 2016; Dong et al., 2016b; Tomida et al., 2017; Meru et al., 2017), which tend to be massive and are fed by infall from the envelope, the origin of the arms detected in Class II disks is unclear.
Figure 2 shows how in principle spiral arms could serve as signposts of either an orbiting planet or a gravitationally unstable disk. The left column shows observed images of two representative disks: MWC 758, with its prominent near-symmetric two-arm spirals (Fig. 2a); and HD 142527, with multiple small-scale, lower contrast arms (Fig. 2d). The middle and right columns show synthetic observations from the literature, produced in combined hydrodynamic and radiative transfer simulations, which illustrate how morphologically similar spiral structures can occur in disks with orbiting planets (middle column) or when a disk is gravitational unstable (right column). As discussed in §1, both a multi-Jupiter mass giant companion and a gravitationally unstable disk with can produce a set of prominent two-arm spirals (Fig. 2b,c), while lower mass planets () and marginally gravitationally unstable disks with can produce multiple small-scale arms at low contrast (Fig. 2e, f).
To attempt to distinguish between these two scenarios for the origin of spiral structure in disks, we first characterize, in this section, the occurrence rate of spiral arms in scattered light imaging of disks. §2.1 describes the data available and our process of selecting a sample of disks well studied in scattered light that are suitable for our study. The occurrence rate of arms within this sample is described in §2.2. Because the sample of well-studied disks is small in size, in §2.3 we examine the occurrence rate of arms within in a volume-limited sample of Herbig stars, which provides a lower limit on the true occurrence rate.
2.1 Disk Imaging Sample
We collected from the literature a sample of protoplanetary disks that have been spatially resolved in scattered light at optical to NIR wavelengths (Appendix Table A.1.1) and that meet four main criteria. First, the disk is gas-rich (i.e., debris disks are excluded). Second, the disk was observed with an inner working angle , small enough to reveal the inner 100 AU planet forming region (most disks imaged to date are 100–200 pc away). Third, the disk surface was revealed with sufficient signal-to-noise to identify possible structures. Finally, the disk was observed with an angular resolution in order to detect and resolve spiral arms.
The third condition largely restricts the sample to Class II objects without a substantial envelope, as the disk surface of more embedded sources is often not accessible in scattered light. It also excludes disks that are completely flat or shadowed (Dullemond & Dominik, 2004). The last criterion restricts the sample to those observed at -band (3.8 ) or shorter wavelengths, because requires for observations made with m diameter telescopes. Systems that have been directly imaged, both with and without a coronagraphic mask, are included, whereas interferometric observations are not. The resulting sample of 49 objects (Table A.1.1) derives mainly from a few major exoplanet and disk surveys, such as the Subaru-based SEEDS (Tamura, 2009; Uyama et al., 2017) and the VLT-based SHINE surveys, supplemented by studies of smaller samples that used a variety of ground-based instruments and HST. Roughly half of the sources are transitional disks (i.e., disks whose inner region is optically thin in the continuum; Espaillat et al. 2014).
We further removed sources viewed at high inclination () whose scattered light structures may be difficult to assess (AK Sco, T Cha, AA Tau, RY Lup, HH 30, HK Tau, HV Tau C, LkH 263C, and PDS 144N). It is possible to identify spiral arms in disks at such high inclinations (e.g., RY Lup; Langlois et al., 2018); however it is usually a challenge because of the resulting geometric effect (Dong et al., 2016a). We also excluded any remaining Class 0/I sources and sources undergoing accretion outbursts (FU Ori, HL Tau, R Mon, V 1057 Cyg, V1735 Cyg, and Z CMa) in order to probe a restricted evolutionary state and to avoid scattered light contamination from an infalling envelope.
Sources with known stellar companions within 5″ (HD 100453, GG Tau, HD 150193, and T Tau) were also excluded to avoid systems in which a stellar companion induces disk structure. Whereas a massive planet exterior to the arms can generate the observed two-arm spirals, a stellar companion closer than could produce similar spiral structure in a disk with a typical size of 12″; (e.g., as in the case of the HD 100453 disk; Wagner et al. 2015; Dong et al. 2016c; Wagner et al. 2018). The companion to HD 142527, which is located well within the gap in the disk, is commonly interpreted as having too low a mass (; Lacour et al., 2016) and eccentricity to generate the observed spiral arms, so this object is included in our sample (although see Price et al. 2018). Lastly, we removed HD 141569 from the sample, because its low dust mass (on the order of or less; Flaherty et al., 2016; White et al., 2016) makes the system prone to radiation pressure and photoelectric instability, which can also produce spiral arm structures (e.g., richert17).
Finally, we arrive at a sample of 29 “well-studied NIR disks”, whose stellar and disk properties are listed in Table 1. The tabulated values were obtained from and using the Siess et al. (2000) pre-main-sequence evolutionary tracks. Notes on individual sources are provided in Appendix §D. The final sample contains 11 Herbig sources (the first 11 rows in the table) and 18 T Tauri stars. Of the 29 sources, 8 have spiral arms: the MWC 758, SAO 206462, LkH 330, and DZ Cha disks show prominent two-arm spirals (Fig. 1, top), the AB Aur, HD 142527, and HD 100546 disks show multiple small arms, and the V1247 Ori disk has one arm (Fig. 1, bottom).
2.2 Spiral Arm Statistics Among Well-studied NIR Disks
From the results shown in Table 1, we find that the incidence rate of spiral arms in disks is surprisingly high among young well-studied A and B stars (3/7), well-studied FGK stars (5/22), and well-studied disks overall (8/29; Table 3).
We can make a similar accounting of spiral fraction by stellar mass rather than by spectral type. Anticipating our comparison of the spiral arm incidence rate to that of massive companions to mature AB stars (§3), we define a Herbig intermediate mass star (IMS) sample over a broader range of spectral type. A main sequence F0 star has a mass of (e.g., Pecaut & Mamajek, 2013). So we consider as Herbig IMS all Herbig systems with spectral types between F6 and B9, and stellar masses .
Table 3 shows that the spiral fraction is 6/11 among well-studied Herbig IMS and 2/18 among the low mass stars (LMS) that make up the rest of the sample. The incidence rate of two-arm spirals is also high: 2/11 among the well-studied Herbig IMS and 2/18 among the LMS. Although the samples are small, the data can nevertheless lend insight into whether there is a significant difference between the occurrence rates of spiral structure in LMS and Herbig IMS disks. For example, using Fisher’s exact test (a contingency table analysis), we find that there is a 3% probability (two-tailed p-value) that the spiral occurrence rate among Herbig IMS is the same as that among low mass stars. Thus the apparent low occurrence rate of spirals among low mass stars compared to Herbig IMS is statistically significant (see also Avenhaus et al. 2018; Isella & Turner 2018).
There are a couple of biases associated with these results. Firstly, scattered light imaging studies often target sources with interesting known structures (e.g., transitional disks) and sources that appear to show interesting structures at modest signal-to-noise receive more extensive follow up. Secondly, scattered light imaging studies are only sensitive to disk structures that can be seen in scattered light. If a disk’s surface is not sufficiently flared, its spiral structure cannot be detected with this technique.
Despite these difficulties, we can obtain a lower limit on the true spiral fraction of disks by examining the fraction of disks with known spiral arms within a volume-limited sample of comparable young stellar objects. We therefore focus our study on the Herbig IMS population, because a fair fraction of such sources within the local volume have already been surveyed in scattered light. In contrast, only a small fraction of the (lower mass) T Tauri population has been studied, and as a result, a corresponding lower limit on the true spiral fraction for LMS would not be a significant constraint.
2.3 A Volume-limited Sample of Herbig Stars
Excluding V1247 Ori, which is very distant (320 pc), the remaining Herbig IMS in Table 1 are all within 200 pc. We therefore focus on a sample of Herbig IMS within this volume, i.e., Herbig sources within 200 pc that have spectral type F6 or earlier, , and no known stellar companion within .
Table LABEL:tab:herbig compiles a list of sources from the literature meeting these criteria (Walker & Wolstencroft, 1988; The et al., 1994; Malfait et al., 1998; Vieira et al., 2003; Erickson et al., 2011; Chen et al., 2012). Generally, these stars are identified by their association with star forming regions or a reflection nebula and the presence of hydrogen emission lines (particularly H). Because the sample could be useful for studies other than the one carried out here, the list also includes, for completeness, sources that we ignore in our study (indicated in Column 4 of Table LABEL:tab:herbig): sources with stellar companions 03–5″ away (HR 811, V892 Tau, PDS 178, CQ Tau, HD 100453, HR 5999, MWC 863, TY CrA, T CrA), sources with (AK Sco), sources with low, potentially optically thin dust (HD 141569), and sources with decretion disks (51 Oph).
Excluding these sources, there are 24 remaining sources, which we carry forward as our “volume-limited Herbig IMS” sample. Ten of these have been well studied in NIR imaging (i.e., they are in Table 1). Note that with the above prescription for the Herbig IMS sample, we exclude younger sources such as LkH 330 (Table 1) which also has a stellar mass but a later spectral type (G3; Figure 3), These sources are excluded in part because earlier spectral type sources (F5–B9) have been studied more completely in scattered light; younger, more embedded disks are more difficult to study in scattered light due to contamination from the envelope. They are also more numerous and much less completely studied in scattered light. The masses of the later spectral type sources are more uncertain as well.
Within the volume-limited Herbig IMS sample (Table 2), 5 of the 10 well-studied sources display spiral structure (AB Aur, MWC 758, HD 100546, SAO 206462, HD 142527). The true spiral fraction depends on whether the remaining 14 sources that have not been well studied (i.e., are not included in Table 1) have arms or not. Thus, the minimum spiral fraction is 5/24, and the minimum two-arm spiral fraction is 2/24 (Table 4). We conclude that even after correcting for systems that have not been studied well in scattered light, the spiral fraction of Herbig IMS is high. Detailed studies of the additional Herbig IMS within 200 pc would be extremely valuable in firming up the spiral fraction.
3 Comparison with Exoplanet Demographics
The two-arm spirals observed in scattered light can be produced by 5–13 planets located 30–300 AU from the star (Fung & Dong 2015 and Dong & Fung 2017). To explore whether this scenario is tenable, we compare the incidence rate of arms with the incidence rate of planetary companions to mature A and B stars in the corresponding mass and separation range. Planetary companions to mature stars are an advantageous population to study because they are better characterized than are companions to Herbig stars and T Tauri stars (Bowler 2016).
Compiling the results of direct imaging searches for planetary companions in this mass and separation range, Bowler (2016) reported that only 3 mature (single) AB stars have such a companion out of a total sample of 110 stars with spectral types B2 to A9. This result assumes that planetary companions have the properties predicted by “hot start” models (see §5). In comparison, the two-arm spiral fraction among well-studied Herbig IMS is larger (2/11; §2.2). Although the number of detections is small in both cases, there is only a 6% probability of obtaining such discrepant results if the the two rates are the same, according to Fisher’s exact test.
Further observations are needed to explore this possible difference. As noted in §2.3), the two-arm spiral fraction in the volume-limited Herbig IMS sample (Table 4) is at least 2/24. If future observations show that there are no other two-arm spirals within 200 pc than the two already known, the probability that the two rates are the same would be 21% and the difference in the observed rates would be of little statistical significance. However, if two additional two-arm spirals are found in the sample, there would only be a 2% probability that the 4/24 spiral fraction and the Bowler (2016) fraction are the same, and the difference in the rates would be quite significant.
The occurrence rate of companions to mature FGK stars is lower than that for mature AB stars (Bowler 2016). To compare with the FGK companion rate, we can select sources from Table 1 that are “future FGK stars”, i.e., sources with stellar masses between and 1.5 (TW Hya, PDS 70, J1604-2130, RX J1615.3-3255, DoAr 28, V4046 Sgr, GM Aur, LkCa 15, PDS 66, SR 21, IM Lup, DZ Cha). The incidence rate of two-arm spirals among the well-studied “future FGK stars” is 1/12 compared with the 0/155 incidence rate of 5–13 companions to mature FGK stars in the 30–300 AU separation range (Bowler, 2016; Vigan et al., 2017). There is a 7% probability that the two rates are the same, similar to the situation for the higher mass stars. Further observations are needed to quantify the extent to which these rates differ.
With the apparent paucity of massive planetary companions to mature AB stars appearing to question the idea that such planetary companions drive two-arm spirals in Herbig disks, in the next section we explore the alternative possibility that spiral arms are driven by gravitational instability. We return in §5 to the planetary companion hypothesis and discuss ways in which it may be consistent with observations.
4 Disk Masses and Gravitational Instability
To help interpret the origin of the spiral arms detected in scattered light imaging, we have also compiled disk masses and stellar accretion rates for the volume-limited Herbig IMS sample (Table LABEL:tab:herbig). The latter can provide a complementary estimate of disk (gas) mass assuming a typical accretion history for the disk (Hartmann et al., 1998). Tables 1 and LABEL:tab:herbig tabulate the disk dust masses calculated from submillimeter continuum fluxes (Appendix §B). Stellar accretion rates are determined from the veiling of the Balmer discontinuity or hydrogen emission line fluxes; further details are provided in Appendix §C.
Turning first to the dust masses, although they may not be a reliable quantitative measure of disk mass (§1), they might serve as a relative measure: sources with higher disk gas masses may also have higher dust masses. Assuming , Figure 4 shows the ratio of for all sources in the volume-limited Herbig IMS sample that have estimated dust masses. The ratio ranges from . Apart from HD 142527, which has a very large dust mass, the sources with two arms (blue bars) or multiple arms (green bars) are distributed throughout this range and interspersed with other sources, both those known to have no arms (black bars) and those that have not yet been studied in scattered light in detail (gray bars).
There is no obvious difference in the ratio of disks with and without arms. The average ratio is 0.008 for the entire volume-limited Herbig IMS sample. Sources with arms and those known to have no arms both have the same average ratio, 0.02. In other words, scattered light surveys have preferentially studied sources with higher submillimeter continuum fluxes.
One indication that these values are flawed as quantitative measures of disk mass comes from estimating the remaining disk lifetime assuming these disk masses, . Figure 5 shows for sources in the volume-limited Herbig IMS sample for which both measurements are available. If we assume that the remaining disk lifetime is 2 Myr, comparable to the average age of disk-bearing young stars (Hernández et al. 2008; Richert et al. 2018) and a conservative estimate based on the HR diagram (Figure 3), half of the sources have lifetimes Myr, a mere 10% of the average age. The short lifetime is a consequence of the high accretion rates. If these values are correct, half of the Herbigs within 200 pc are in the last 10% of their mass-building phase of life, which seems implausible.
We could instead assume that we are viewing Herbigs on average at middle age, a current age of at least Myr. Parametrizing the decline of with time as (e.g., Hartmann et al., 1998), where is the current age of the star, the total mass that the star accretes at later times is For (Sicilia-Aguilar et al. 2010, Hartmann et al. 1998), . With this estimate, the average , about ten times higher than the disk masses estimated from submillimeter continua. If the stars are older, the implied disk masses are higher.
Figure 6 shows where is estimated as above. The sources with two (blue bars) or multiple arms (green bars) are concentrated in the upper half of the sample, reaching values as large as 0.6 (AB Aur), with about one-half to one-third of the sample above the nominal gravitational instability limit of . The clustering of “arm” sources toward higher / would be consistent with the arms being generated through or enhanced by gravitational instability. It would extremely interesting to measure the scattered light morphology of the unstudied sources (gray bars). If the lower mass disks also show spiral arms, it is unlikely that gravitational instability plays the major role in generating arms.
Figure 7 compares the above submillimeter continuum-based and stellar accretion-based disk masses for the volume-limited Herbig IMS sample as well as the T Tauri stars studied by Andrews & Williams (2007). Both groups of sources have, on average, 3–10 times larger masses estimated from stellar accretion rates than from dust continuum. The discrepancy between the disk masses estimated by these two methods has been previously noted for T Tauri stars by several authors (e.g., Andrews & Williams, 2007; Rosotti et al., 2017). The Herbig IMS studied here show a similar trend.
5 Discussion
Among disks that have been well-studied in scattered light, spiral arm structures are surprisingly common (§2.2), although their origin is unclear. While giant planets and gravitational instability have both been put forward as explanations for the observed spiral structure, neither explanation is readily confirmed in our study. We find that despite the small sample sizes studied to date, we can infer that two-arm spirals occur more frequently among Herbig IMS disks than do massive giant planet companions to mature AB stars, challenging the planet hypothesis (§3). The viability of gravitational instability as an explanation for spiral structure is uncertain, because submillimeter continuum-based disk masses are low. However, as we showed, disk masses may be substantially larger if stellar accretion rates are a guide (§4). In this section, we examine the proposed hypotheses in greater detail before presenting scenarios that are potentially consistent with our results.
Shadows and Stellar Flybys. Spiral arms detected in scattered light have also been modeled as arising from rotating shadows cast by a warped inner disk (e.g., Montesinos et al., 2016; montesinos17) and stellar flybys (e.g., Pfalzner, 2003). These alternative explanations require specific conditions that are unlikely to be satisfied in the majority of cases. The moving shadow scenario is best at explaining grand design two-arm spirals; yet in the only disk with both a clear =2 shadow pattern and a set of two-arm spirals (HD 100453), the disk’s arms are almost certainly induced by the visible stellar companion (Dong et al., 2016c; Wagner et al., 2018). To catch the spirals induced by a stellar flyby, one needs to image the system within a few dynamical times (i.e., years at typical distances) after the closest encounter before the spirals winded up due to differential rotation (Pfalzner, 2003). The short timescales make it unlikely to catch the disk in this situation. Because these two options are very unlikely to be the general mechanisms responsible for observed spiral arms in scattered light, we focus more closely on the gravitational instability and planetary companion hypotheses that have been considered more intently in the recent literature.
Gravitational Instability. Exciting two-arm spirals in a gravitationally unstable disk requires a situation that may occur in Herbig disks, especially if they have recently decoupled from their infalling envelopes. In such systems, spiral shocks transport angular momentum and drive rapid accretion, with (Kratter et al., 2008, 2010; Dong et al., 2015a). Consequently, the disk mass decreases quickly and the two-arm phase is brief (on the order of yr). As the disk mass drops, the disk accretion rate also declines, and the disk structure shifts to a multi-arm morphology (e.g., Rice & Armitage, 2009, Hall et al, in prep.). Eventually the disk is stabilized against gravitational instability and the disk settles down to an even lower accretion rate.
This scenario appears inconsistent with the demographic properties of disks with two-arm spirals. In the above picture, two-arm spirals should occur in systems with the largest . Instead, observed two-arm spiral disks have middle-of-the-road values among the Herbig IMS within 200 pc (Figure 5). Two-arm spirals are also expected to be rare, because this phase lasts for on the order of 1% of the 2 Myr average age of disk-bearing stars once envelope infall have ceased. In contrast, two-arm spirals are found in 2/11 (or 18%) of the well-studied Herbig IMS and 2/24 (or %) of the volume-limited Herbig IMS sample (Table 4). Disks with two-arm spirals are also expected to be evolutionarily young, and to have just emerged from their infalling envelopes. In the HR diagram, disks with two-arm spirals are of preferentially later spectral type than other well-studied Herbig stars, but they are not preferentially younger (Fig. 3).
Although it seems unlikely to explain the two-arm spirals, gravitational instability is a possible explanation for multi-arm spirals. Disks with have multiple arms and are marginally unstable, with disk accretion rates – in the outer disk (e.g., Dong et al., 2015a; Hall et al., 2016). They can remain in this state for a period , or – yr, comparable to the 2 Myr average age of disk-bearing stars. Additional disk accretion mechanisms, such as the magnetorotational instability (Balbus & Hawley, 1992; Gammie, 2001) or magnetized disk winds (e.g., Bai et al., 2016; Bai, 2017), will become more dominant as the gravitational instability-driven accretion rate declines.
The relatively long lifetime of the multi-arm phase of gravitational instability is possibly consistent with the 3/11 (or 27%) incidence rate of multi-arm spirals among well-studied Herbig IMS and 3/24 (or %) incidence rate within the volume-limited Herbig IMS sample (Table 4). All three of the multi-arm disks have large disk masses based on their stellar accretion rates (; Figure 6) as well as stellar accretion rates in the above range 10-8– (Figure 5). Note that the similarity between observed stellar accretion rates and the predicted outer disk accretion rates suggest that gravitational instability-driven accretion in the outer disk could potentially be sustained down to small disk radii and onto the star; further theoretical work is needed to understand the details of the accretion process. Numerical simulations that quantify the time that a disk stays in each -arm state in a realistic environment will be extremely useful to explore this possibility.
Planetary Companions. By studying sources that have been well studied in scattered light, we have focused on older, revealed Herbig stars that are not obscured by an infalling envelope. Thus our sample is biased against gravitational instability, which is more likely to occur in (younger) massive disks, and possibly toward giant planets, which may take a few Myr to form. It is therefore surprising to find that the properties of the sample seem inconsistent with the reported properties of giant planets around mature A stars: two-arm spirals appear to be more common than the giant planets massive enough to drive them.
One possible resolution to this discrepancy is that giant planets are fainter than we think, i.e., current direct imaging searches for planetary companions to mature A stars may underestimate the planetary masses to which they are sensitive. In converting companion fluxes (and detection upper limits) to masses, one can choose between “hot start” (e.g., COND and DUSTY models, Baraffe et al. 2003; Chabrier et al. 2000) and “cold start” evolutionary models (e.g., Fortney et al., 2008; Spiegel & Burrows, 2012). The former, used by most investigators, predicts a higher luminosity for a given star at a given age with a given mass, than the latter. Neither set of models has been observationally confirmed for planetary mass objects at these young ages. Multi- companions, capable of driving observed two-arm spirals, may not be detectable by current surveys if the “cold start” models are appropriate — at 50 Myr, a 3 hot start planet has roughly the same -band luminosity as a 10 cold start planet (Baraffe et al., 2003; Spiegel & Burrows, 2012). Planets that are fainter than typically assumed would also help explain why direct imaging searches for the predicted perturbers in two-arm spiral disks have failed to detect massive giant planets at the flux levels predicted by the hot start models (SAO 206462 and MWC 758; Maire et al., 2017; Reggiani et al., 2018).
As an alternative way to resolve the discrepancy, one might imagine that multi- planets located at 10s to 100 AU from the star may be more common at a few Myr than at the 10–100 Myr ages typically probed by direct imaging studies (e.g., Bowler, 2016), either because planets migrate inward from the original orbital distances via disk-planet interactions, and/or they are scattered out of the system via planet-planet interactions. Both options appear unlikely, however. While a planet could be driven inward by an outer disk located beyond the planet (e.g., Kley & Nelson, 2012), in all systems with two-arm spirals the purported planet is located beyond the edge of the disk. In the planet-planet interaction scenario, multiple giant planets that are initially stabilized by the gas disk (e.g., Dunhill et al., 2013) later undergo planet-planet scattering that removes planets from the system once the gas disk dissipates (e.g., Dong & Dawson, 2016). Systems with two-arm spirals, however, are unlikely to have additional giant planets with similar masses at distances close enough to interact with the purported arm-driving planet, as such planets will drive their own sets of two-arm spirals, which are not seen.
Thus, the most attractive explanation for two-arm spirals in disks is that they are driven by massive giant planetary companions () that are fainter than predicted by hot start evolutionary models.
Planetary companions might also play a role in explaining multi-arm spirals. Numerical simulations have shown that a planet of mass usually drives one to three arms on one side of its orbit that are detectable in NIR imaging observations (Dong & Fung, 2017). In disks with multi-arm spirals (Figure 1), the arms are at similar distances. To drive them with Jovian planets requires more than one planet, positioned over a small range of disk radii, potentially in conflict with theories of giant planet formation.
6 Summary and Future Prospects
Spiral arm structures are surprisingly common in NIR scattered light imaging of protoplanetary disks, especially among Herbig stars. Among the 11 Herbig stars that have been well-studied in scattered light, 6/11 have spiral arms of some kind, and 2/11 have near-symmetric two-arm spirals. Among the 24 single Herbig stars within 200 pc, 10 have been imaged in scattered light. The spiral arm occurrence rate in this volume-limited Herbig intermediate mass star (IMS) sample is 2/24 for two-arm spirals and 5/24 for spirals of all kinds; if some of the remaining 14 disks in the sample turn out to have spiral structures, the fractions will be higher. Although the sample studied to date is small and the occurrence rates of spiral arms poorly determined as a result, the data do have the potential to constrain quantities of fundamental importance for planet formation.
Two-arm spirals appear to be more common among Herbig IMS disks than are directly imaged giant planet companions to mature AB stars as estimated in the literature. This discrepancy is difficult to account for in a simple way given our current understanding of the mechanisms that can create spiral structure. Gravitational instability is unlikely to explain the two-arm spirals detected in class II disks mainly because of the short lifetime of this phase of disk evolution compared with the high fraction of two-arm spirals observed. The stellar accretion rates of Herbig systems with two-arm spirals are also not particularly high compared to other Herbigs. To explain the high occurrence rate of two-arm spirals, we propose that they may be produced by massive giant planets that are fainter than predicted by hot start models. Such planets must occur as companions to 8% of Herbig IMS.
Gravitational instability may drive multi-arm spirals if the disk mass is 10% of the stellar mass. Submillimeter continuum-based disk mass estimates for disks with multi-arm spirals are generally about one order of magnitude below this threshold. However, the high stellar accretion rates of Herbig stars, if sustained over a reasonable fraction of their lifetimes, suggest much larger disk masses. As a result, gravitational instability is a plausible explanation for multi-arm spirals. With the multi-arm phase of gravitational instability persisting longer than the two-arm phase, it is possibly consistent with the 3/11 occurrence rate among well-studied Herbig IMS and the 3/24 occurrence rate in the volume-limited Herbig IMS sample.
Several future studies can lend insights into the issues raised here. Our study is limited by the small sample size of disks that have been well-studied in scattered light. High signal-to-noise scattered light imaging of the remainder of the volume-limited Herbig IMS sample would be extremely valuable in firming up the occurrence rates of spiral features. ALMA observations of the gas and dust emission structure of disks, which do not require illumination by the central star, are a valuable way to develop a more complete census of spiral arms. To distinguish between the various scenarios that could produce the observed spiral structures, it may be useful to compare not only the observed and expected number and symmetry of arms but also the observed and expected surface brightness contrast of spiral features above the rest of the disk.
The current sample is biased toward older sources that lack substantial infall and are therefore less likely to have gravitationally unstable disks. It would be very interesting to search for spiral structure among the younger precursor population (i.e., among GK-type intermediate mass T Tauri stars) either in scattered light or millimeter emission. The time evolution of the occurrence rate of two-arm spirals may shed light on the formation timescale of giant planets at large distances, and those of multi-arm spirals may reveal how disk masses evolve with time.
Acknowledgments
We thank Jaehan Bae, Xuening Bai, Josh Eisner, Cassandra Hall, Jun Hashimoto, Scott Kenyon, Kaitlin Kratter, Adam Kraus and Ken Rice for valuable advice and discussions, and an anonymous referee for a helpful review of the manuscript. We are grateful to Henning Avenhaus, Myriam Benisty, Hector Canovas, Katherine Follette, Antonio Garufi, Jun Hashimoto, and Taichi Uyama for making available the observational images used in Figure 1. This research has made use of the SIMBAD database, operated at CDS, Strasbourg, France. SDB acknowledges NASA Agreements No. NXX15AD94G and No. NNX16AJ81G; and NSF-AST 1517014. JRN acknowledges the stimulating research environment supported by NASA Agreement No. NNX15AD94G to the “Earths in Other Solar Systems” program. SDB gratefully acknowledges the generous hospitality and stimulating scientific environment provided by the National Optical Astronomy Observatory.
References
- Akiyama et al. (2015) Akiyama, E., Muto, T., Kusakabe, N., et al. 2015, ApJ, 802, L17
- Akiyama et al. (2016) Akiyama, E., Hashimoto, J., Liu, H. B., et al. 2016, AJ, 152, 222
- Alcalá et al. (2008) Alcalá, J. M., Spezzi, L., Chapman, N., et al. 2008, ApJ, 676, 427
- ALMA Partnership et al. (2015) ALMA Partnership, Brogan, C. L., Pérez, L. M., et al. 2015, ApJ, 808, L3
- Alonso-Albi et al. (2009) Alonso-Albi, T., Fuente, A., Bachiller, R., et al. 2009, A&A, 497, 117
- Andrews et al. (2013) Andrews, S. M., Rosenfeld, K. A., Kraus, A. L., & Wilner, D. J. 2013, ApJ, 771, 129
- Andrews & Williams (2005) Andrews, S. M., & Williams, J. P. 2005, ApJ, 631, 1134
- Andrews & Williams (2007) —. 2007, ApJ, 671, 1800
- Andrews et al. (2011) Andrews, S. M., Wilner, D. J., Espaillat, C., et al. 2011, ApJ, 732, 42
- Andrews et al. (2016) Andrews, S. M., Wilner, D. J., Zhu, Z., et al. 2016, ApJ, 820, L40
- Antoniucci et al. (2016) Antoniucci, S., Podio, L., Nisini, B., et al. 2016, A&A, 593, L13
- Augereau et al. (2001) Augereau, J. C., Lagrange, A. M., Mouillet, D., & Ménard, F. 2001, A&A, 365, 78
- Avenhaus et al. (2014) Avenhaus, H., Quanz, S. P., Schmid, H. M., et al. 2014, ApJ, 781, 87
- Avenhaus et al. (2017) —. 2017, AJ, 154, 33
- Avenhaus et al. (2018) Avenhaus, H., Quanz, S. P., Garufi, A., et al. 2018, ArXiv e-prints, arXiv:1803.10882
- Bae & Zhu (2018) Bae, J., & Zhu, Z. 2018, ApJ, 859, 118
- Bae et al. (2016) Bae, J., Zhu, Z., & Hartmann, L. 2016, ApJ, 819, 134
- Bae et al. (2017) —. 2017, ApJ, 850, 201
- Bai (2017) Bai, X.-N. 2017, ApJ, 845, 75
- Bai et al. (2016) Bai, X.-N., Ye, J., Goodman, J., & Yuan, F. 2016, ApJ, 818, 152
- Balbus & Hawley (1992) Balbus, S. A., & Hawley, J. F. 1992, ApJ, 400, 610
- Baraffe et al. (2003) Baraffe, I., Chabrier, G., Barman, T. S., Allard, F., & Hauschildt, P. H. 2003, A&A, 402, 701
- Beckwith et al. (1990) Beckwith, S. V. W., Sargent, A. I., Chini, R. S., & Guesten, R. 1990, AJ, 99, 924
- Benisty et al. (2015) Benisty, M., Juhasz, A., Boccaletti, A., et al. 2015, A&A, 578, L6
- Benisty et al. (2017) Benisty, M., Stolker, T., Pohl, A., et al. 2017, A&A, 597, A42
- Bergin et al. (2013) Bergin, E. A., Cleeves, L. I., Gorti, U., et al. 2013, Nature, 493, 644
- Bertrang et al. (2018) Bertrang, G. H.-M., Avenhaus, H., Casassus, S., et al. 2018, MNRAS, 474, 5105
- Beskrovnaya et al. (1999) Beskrovnaya, N. G., Pogodin, M. A., Miroshnichenko, A. S., et al. 1999, A&A, 343, 163
- Beuzit et al. (2008) Beuzit, J.-L., Feldt, M., Dohlen, K., et al. 2008, in Society of Photo-Optical Instrumentation Engineers (SPIE) Conference Series, Vol. 7014, Society of Photo-Optical Instrumentation Engineers (SPIE) Conference Series
- Biller et al. (2015) Biller, B. A., Liu, M. C., Rice, K., et al. 2015, MNRAS, 450, 4446
- Boccaletti et al. (2013) Boccaletti, A., Pantin, E., Lagrange, A.-M., et al. 2013, A&A, 560, A20
- Boehler et al. (2017) Boehler, Y., Weaver, E., Isella, A., et al. 2017, ApJ, 840, 60
- Bowler (2016) Bowler, B. P. 2016, PASP, 128, 102001
- Brittain et al. (2007) Brittain, S. D., Simon, T., Najita, J. R., & Rettig, T. W. 2007, ApJ, 659, 685
- Brown et al. (2012) Brown, J. M., Rosenfeld, K. A., Andrews, S. M., Wilner, D. J., & van Dishoeck, E. F. 2012, ApJ, 758, L30
- Burrows et al. (1996) Burrows, C. J., Stapelfeldt, K. R., Watson, A. M., et al. 1996, ApJ, 473, 437
- Canovas et al. (2013) Canovas, H., Ménard, F., Hales, A., et al. 2013, A&A, 556, A123
- Canovas et al. (2015) Canovas, H., Perez, S., Dougados, C., et al. 2015, A&A, 578, L1
- Canovas et al. (2017) Canovas, H., Hardy, A., Zurlo, A., et al. 2017, A&A, 598, A43
- Canovas et al. (2018) Canovas, H., Montesinos, B., Schreiber, M. R., et al. 2018, A&A, 610, A13
- Carpenter et al. (2005) Carpenter, J. M., Wolf, S., Schreyer, K., Launhardt, R., & Henning, T. 2005, AJ, 129, 1049
- Cauley & Johns-Krull (2014) Cauley, P. W., & Johns-Krull, C. M. 2014, ApJ, 797, 112
- Chabrier et al. (2000) Chabrier, G., Baraffe, I., Allard, F., & Hauschildt, P. 2000, ApJ, 542, 464
- Chen et al. (2012) Chen, C. H., Pecaut, M., Mamajek, E. E., Su, K. Y. L., & Bitner, M. 2012, ApJ, 756, 133
- Chun et al. (2008) Chun, M., Toomey, D., Wahhaj, Z., et al. 2008, in Proc. SPIE, Vol. 7015, Adaptive Optics Systems, 70151V
- Cieza et al. (2016) Cieza, L. A., Casassus, S., Tobin, J., et al. 2016, Nature, 535, 258
- Cieza et al. (2017) Cieza, L. A., Casassus, S., Pérez, S., et al. 2017, ApJ, 851, L23
- Clampin et al. (2003) Clampin, M., Krist, J. E., Ardila, D. R., et al. 2003, AJ, 126, 385
- Cleeves et al. (2016) Cleeves, L. I., Öberg, K. I., Wilner, D. J., et al. 2016, ApJ, 832, 110
- Close et al. (1997) Close, L. M., Roddier, F., Hora, J. L., et al. 1997, ApJ, 489, 210
- Cossins et al. (2009) Cossins, P., Lodato, G., & Clarke, C. J. 2009, MNRAS, 393, 1157
- Cotera et al. (2001) Cotera, A. S., Whitney, B. A., Young, E., et al. 2001, ApJ, 556, 958
- Cox et al. (2013) Cox, A. W., Grady, C. A., Hammel, H. B., et al. 2013, ApJ, 762, 40
- Currie et al. (2015) Currie, T., Cloutier, R., Brittain, S., et al. 2015, ApJ, 814, L27
- Currie et al. (2014) Currie, T., Muto, T., Kudo, T., et al. 2014, ApJ, 796, L30
- Currie et al. (2016) Currie, T., Grady, C. A., Cloutier, R., et al. 2016, ApJ, 819, L26
- Czekala et al. (2015) Czekala, I., Andrews, S. M., Jensen, E. L. N., et al. 2015, ApJ, 806, 154
- D’Alessio et al. (1998) D’Alessio, P., Cantö, J., Calvet, N., & Lizano, S. 1998, ApJ, 500, 411
- de Boer et al. (2016) de Boer, J., Salter, G., Benisty, M., et al. 2016, A&A, 595, A114
- de Gregorio-Monsalvo et al. (2013) de Gregorio-Monsalvo, I., Ménard, F., Dent, W., et al. 2013, A&A, 557, A133
- de Leon et al. (2015) de Leon, J., Takami, M., Karr, J. L., et al. 2015, ApJ, 806, L10
- Debes et al. (2013) Debes, J. H., Jang-Condell, H., Weinberger, A. J., Roberge, A., & Schneider, G. 2013, ApJ, 771, 45
- Debes et al. (2017) Debes, J. H., Poteet, C. A., Jang-Condell, H., et al. 2017, ApJ, 835, 205
- Dipierro et al. (2015) Dipierro, G., Price, D., Laibe, G., et al. 2015, MNRAS, 453, L73
- Dipierro et al. (2018) Dipierro, G., Ricci, L., Pérez, L., et al. 2018, MNRAS, 475, 5296
- Donehew & Brittain (2011) Donehew, B., & Brittain, S. 2011, AJ, 141, 46
- Dong (2015) Dong, R. 2015, ApJ, 810, 6
- Dong & Dawson (2016) Dong, R., & Dawson, R. 2016, ApJ, 825, 77
- Dong & Fung (2017) Dong, R., & Fung, J. 2017, ApJ, 835, 38
- Dong et al. (2016a) Dong, R., Fung, J., & Chiang, E. 2016a, ApJ, 826, 75
- Dong et al. (2015a) Dong, R., Hall, C., Rice, K., & Chiang, E. 2015a, ApJ, 812, L32
- Dong et al. (2017a) Dong, R., Li, S., Chiang, E., & Li, H. 2017a, ApJ, 843, 127
- Dong et al. (2016b) Dong, R., Vorobyov, E., Pavlyuchenkov, Y., Chiang, E., & Liu, H. B. 2016b, ApJ, 823, 141
- Dong et al. (2016c) Dong, R., Zhu, Z., Fung, J., et al. 2016c, ApJ, 816, L12
- Dong et al. (2015b) Dong, R., Zhu, Z., Rafikov, R. R., & Stone, J. M. 2015b, ApJ, 809, L5
- Dong et al. (2015c) Dong, R., Zhu, Z., & Whitney, B. 2015c, ApJ, 809, 93
- Dong et al. (2017b) Dong, R., van der Marel, N., Hashimoto, J., et al. 2017b, ApJ, 836, 201
- Draine (2006) Draine, B. T. 2006, ApJ, 636, 1114
- Ducati (2002) Ducati, J. R. 2002, VizieR Online Data Catalog, 2237
- Duchêne et al. (2004) Duchêne, G., McCabe, C., Ghez, A. M., & Macintosh, B. A. 2004, ApJ, 606, 969
- Dullemond & Dominik (2004) Dullemond, C. P., & Dominik, C. 2004, A&A, 417, 159
- Dunhill et al. (2013) Dunhill, A. C., Alexander, R. D., & Armitage, P. J. 2013, MNRAS, 428, 3072
- Dunkin & Crawford (1998) Dunkin, S. K., & Crawford, I. A. 1998, MNRAS, 298, 275
- Eisner et al. (2016) Eisner, J. A., Bally, J. M., Ginsburg, A., & Sheehan, P. D. 2016, ApJ, 826, 16
- Eisner et al. (2018) Eisner, J. A., Arce, H. G., Ballering, N. P., et al. 2018, ApJ, 860, 77
- Erickson et al. (2011) Erickson, K. L., Wilking, B. A., Meyer, M. R., Robinson, J. G., & Stephenson, L. N. 2011, AJ, 142, 140
- Espaillat et al. (2014) Espaillat, C., Muzerolle, J., Najita, J., et al. 2014, Protostars and Planets VI, 497
- Evans et al. (2017) Evans, M. G., Ilee, J. D., Hartquist, T. W., et al. 2017, MNRAS, 470, 1828
- Facchini et al. (2017) Facchini, S., Birnstiel, T., Bruderer, S., & van Dishoeck, E. F. 2017, A&A, 605, A16
- Fairlamb et al. (2015) Fairlamb, J. R., Oudmaijer, R. D., Mendigutía, I., Ilee, J. D., & van den Ancker, M. E. 2015, MNRAS, 453, 976
- Fairlamb et al. (2017) Fairlamb, J. R., Oudmaijer, R. D., Mendigutia, I., Ilee, J. D., & van den Ancker, M. E. 2017, MNRAS, 464, 4721
- Fedele et al. (2017) Fedele, D., Carney, M., Hogerheijde, M. R., et al. 2017, A&A, 600, A72
- Fedele et al. (2018) Fedele, D., Tazzari, M., Booth, R., et al. 2018, A&A, 610, A24
- Finkenzeller & Mundt (1984) Finkenzeller, U., & Mundt, R. 1984, A&AS, 55, 109
- Flaherty et al. (2016) Flaherty, K. M., Hughes, A. M., Andrews, S. M., et al. 2016, ApJ, 818, 97
- Follette et al. (2013) Follette, K. B., Tamura, M., Hashimoto, J., et al. 2013, ApJ, 767, 10
- Follette et al. (2015) Follette, K. B., Grady, C. A., Swearingen, J. R., et al. 2015, ApJ, 798, 132
- Follette et al. (2017) Follette, K. B., Rameau, J., Dong, R., et al. 2017, AJ, 153, 264
- Folsom et al. (2012) Folsom, C. P., Bagnulo, S., Wade, G. A., et al. 2012, MNRAS, 422, 2072
- Forgan & Rice (2013) Forgan, D., & Rice, K. 2013, MNRAS, 433, 1796
- Fortney et al. (2008) Fortney, J. J., Marley, M. S., Saumon, D., & Lodders, K. 2008, ApJ, 683, 1104
- Fossati et al. (2009) Fossati, L., Ryabchikova, T., Bagnulo, S., et al. 2009, A&A, 503, 945
- Fukagawa et al. (2003) Fukagawa, M., Tamura, M., Itoh, Y., Hayashi, S. S., & Oasa, Y. 2003, ApJ, 590, L49
- Fukagawa et al. (2006) Fukagawa, M., Tamura, M., Itoh, Y., et al. 2006, ApJ, 636, L153
- Fukagawa et al. (2004) Fukagawa, M., Hayashi, M., Tamura, M., et al. 2004, ApJ, 605, L53
- Fung & Dong (2015) Fung, J., & Dong, R. 2015, ApJ, 815, L21
- Gaia Collaboration et al. (2016) Gaia Collaboration, Brown, A. G. A., Vallenari, A., et al. 2016, A&A, 595, A2
- Gammie (2001) Gammie, C. F. 2001, ApJ, 553, 174
- Garcia Lopez et al. (2006) Garcia Lopez, R., Natta, A., Testi, L., & Habart, E. 2006, A&A, 459, 837
- Garufi et al. (2014) Garufi, A., Quanz, S. P., Schmid, H. M., et al. 2014, A&A, 568, A40
- Garufi et al. (2013) Garufi, A., Quanz, S. P., Avenhaus, H., et al. 2013, A&A, 560, A105
- Garufi et al. (2016) Garufi, A., Quanz, S. P., Schmid, H. M., et al. 2016, A&A, 588, A8
- Garufi et al. (2017) Garufi, A., Meeus, G., Benisty, M., et al. 2017, A&A, 603, A21
- Ginski et al. (2016) Ginski, C., Stolker, T., Pinilla, P., et al. 2016, A&A, 595, A112
- Goldreich & Lynden-Bell (1965) Goldreich, P., & Lynden-Bell, D. 1965, MNRAS, 130, 97
- Goldreich & Tremaine (1979) Goldreich, P., & Tremaine, S. 1979, ApJ, 233, 857
- Grady et al. (2001) Grady, C. A., Polomski, E. F., Henning, T., et al. 2001, AJ, 122, 3396
- Grady et al. (2007) Grady, C. A., Schneider, G., Hamaguchi, K., et al. 2007, ApJ, 665, 1391
- Grady et al. (2009) Grady, C. A., Schneider, G., Sitko, M. L., et al. 2009, ApJ, 699, 1822
- Grady et al. (2010) Grady, C. A., Hamaguchi, K., Schneider, G., et al. 2010, ApJ, 719, 1565
- Grady et al. (2013) Grady, C. A., Muto, T., Hashimoto, J., et al. 2013, ApJ, 762, 48
- Greene & Meyer (1995) Greene, T. P., & Meyer, M. R. 1995, ApJ, 450, 233
- Guimarães et al. (2006) Guimarães, M. M., Alencar, S. H. P., Corradi, W. J. B., & Vieira, S. L. A. 2006, A&A, 457, 581
- Hall et al. (2016) Hall, C., Forgan, D., Rice, K., et al. 2016, MNRAS, 458, 306
- Hamidouche (2010) Hamidouche, M. 2010, ApJ, 722, 204
- Hartmann et al. (1998) Hartmann, L., Calvet, N., Gullbring, E., & D’Alessio, P. 1998, ApJ, 495, 385
- Hashimoto et al. (2011) Hashimoto, J., Tamura, M., Muto, T., et al. 2011, ApJ, 729, L17
- Hashimoto et al. (2012) Hashimoto, J., Dong, R., Kudo, T., et al. 2012, ApJ, 758, L19
- Hashimoto et al. (2015) Hashimoto, J., Tsukagoshi, T., Brown, J. M., et al. 2015, ApJ, 799, 43
- Hayashi (1981) Hayashi, C. 1981, Progress of Theoretical Physics Supplement, 70, 35
- Henning et al. (1994) Henning, T., Launhardt, R., Steinacker, J., & Thamm, E. 1994, A&A, 291, 546
- Hernández et al. (2004) Hernández, J., Calvet, N., Briceño, C., Hartmann, L., & Berlind, P. 2004, AJ, 127, 1682
- Hernández et al. (2005) Hernández, J., Calvet, N., Hartmann, L., et al. 2005, AJ, 129, 856
- Hernández et al. (2008) Hernández, J., Hartmann, L., Calvet, N., et al. 2008, ApJ, 686, 1195
- Høg et al. (2000) Høg, E., Fabricius, C., Makarov, V. V., et al. 2000, A&A, 355, L27
- Honda et al. (2009) Honda, M., Inoue, A. K., Fukagawa, M., et al. 2009, ApJ, 690, L110
- Houk & Cowley (1975) Houk, N., & Cowley, A. P. 1975, University of Michigan Catalogue of two-dimensional spectral types for the HD stars. Volume I. Declinations -90 to -53 degree
- Huang et al. (2018) Huang, J., Andrews, S. M., Cleeves, L. I., et al. 2018, ApJ, 852, 122
- Isella et al. (2009) Isella, A., Carpenter, J. M., & Sargent, A. I. 2009, ApJ, 701, 260
- Isella & Turner (2018) Isella, A., & Turner, N. J. 2018, ApJ, 860, 27
- Isella et al. (2016) Isella, A., Guidi, G., Testi, L., et al. 2016, Physical Review Letters, 117, 251101
- Itoh et al. (2002) Itoh, Y., Tamura, M., Hayashi, S. S., et al. 2002, PASJ, 54, 963
- Itoh et al. (2014) Itoh, Y., Oasa, Y., Kudo, T., et al. 2014, Research in Astronomy and Astrophysics, 14, 1438
- Jamialahmadi et al. (2015) Jamialahmadi, N., Berio, P., Meilland, A., et al. 2015, A&A, 579, A81
- Janson et al. (2016) Janson, M., Thalmann, C., Boccaletti, A., et al. 2016, ApJ, 816, L1
- Jayawardhana et al. (2002) Jayawardhana, R., Luhman, K. L., D’Alessio, P., & Stauffer, J. R. 2002, ApJ, 571, L51
- Juhász et al. (2015) Juhász, A., Benisty, M., Pohl, A., et al. 2015, MNRAS, 451, 1147
- Kama et al. (2015) Kama, M., Folsom, C. P., & Pinilla, P. 2015, A&A, 582, L10
- Kasper et al. (2016) Kasper, M., Santhakumari, K. K. R., Herbst, T. M., & Köhler, R. 2016, A&A, 593, A50
- Kley & Nelson (2012) Kley, W., & Nelson, R. P. 2012, ARA&A, 50, 211
- Konishi et al. (2016) Konishi, M., Grady, C. A., Schneider, G., et al. 2016, ApJ, 818, L23
- Kooistra et al. (2017) Kooistra, R., Kamp, I., Fukagawa, M., et al. 2017, A&A, 597, A132
- Kratter & Lodato (2016) Kratter, K., & Lodato, G. 2016, ARA&A, 54, 271
- Kratter et al. (2008) Kratter, K. M., Matzner, C. D., & Krumholz, M. R. 2008, ApJ, 681, 375
- Kratter et al. (2010) Kratter, K. M., Matzner, C. D., Krumholz, M. R., & Klein, R. I. 2010, ApJ, 708, 1585
- Kraus et al. (2013) Kraus, S., Ireland, M. J., Sitko, M. L., et al. 2013, ApJ, 768, 80
- Kraus et al. (2017) Kraus, S., Kreplin, A., Fukugawa, M., et al. 2017, ApJ, 848, L11
- Krist et al. (2000) Krist, J. E., Stapelfeldt, K. R., Ménard, F., Padgett, D. L., & Burrows, C. J. 2000, ApJ, 538, 793
- Krist et al. (2002) Krist, J. E., Stapelfeldt, K. R., & Watson, A. M. 2002, ApJ, 570, 785
- Krist et al. (2005) Krist, J. E., Stapelfeldt, K. R., Golimowski, D. A., et al. 2005, AJ, 130, 2778
- Kudo et al. (2008) Kudo, T., Tamura, M., Kitamura, Y., et al. 2008, ApJ, 673, L67
- Kusakabe et al. (2012) Kusakabe, N., Grady, C. A., Sitko, M. L., et al. 2012, ApJ, 753, 153
- Lacour et al. (2016) Lacour, S., Biller, B., Cheetham, A., et al. 2016, A&A, 590, A90
- Langlois et al. (2018) Langlois, M., Pohl, A., Lagrange, A.-M., et al. 2018, A&A, 614, A88
- Lee (2016) Lee, W.-K. 2016, ApJ, 832, 166
- Lenzen et al. (2003) Lenzen, R., Hartung, M., Brandner, W., et al. 2003, in Proc. SPIE, Vol. 4841, Instrument Design and Performance for Optical/Infrared Ground-based Telescopes, ed. M. Iye & A. F. M. Moorwood, 944–952
- Ligi et al. (2018) Ligi, R., Vigan, A., Gratton, R., et al. 2018, MNRAS, 473, 1774
- Liu et al. (2016a) Liu, H. B., Galván-Madrid, R., Vorobyov, E. I., et al. 2016a, ApJ, 816, L29
- Liu et al. (2016b) Liu, H. B., Takami, M., Kudo, T., et al. 2016b, Science Advances, 2, e1500875
- Lodato & Rice (2004) Lodato, G., & Rice, W. K. M. 2004, MNRAS, 351, 630
- Lodato & Rice (2005) —. 2005, MNRAS, 358, 1489
- Long et al. (2017) Long, Z. C., Fernandes, R. B., Sitko, M., et al. 2017, ApJ, 838, 62
- Loomis et al. (2017) Loomis, R. A., Öberg, K. I., Andrews, S. M., & MacGregor, M. A. 2017, ApJ, 840, 23
- Lucas et al. (2004) Lucas, P. W., Fukagawa, M., Tamura, M., et al. 2004, MNRAS, 352, 1347
- Macintosh et al. (2008) Macintosh, B. A., Graham, J. R., Palmer, D. W., et al. 2008, in Society of Photo-Optical Instrumentation Engineers (SPIE) Conference Series, Vol. 7015, Society of Photo-Optical Instrumentation Engineers (SPIE) Conference Series
- Maire et al. (2017) Maire, A.-L., Stolker, T., Messina, S., et al. 2017, A&A, 601, A134
- Malfait et al. (1998) Malfait, K., Bogaert, E., & Waelkens, C. 1998, A&A, 331, 211
- Mandy & Martin (1993) Mandy, M. E., & Martin, P. G. 1993, ApJS, 86, 199
- Manoj et al. (2006) Manoj, P., Bhatt, H. C., Maheswar, G., & Muneer, S. 2006, ApJ, 653, 657
- Mathis (1990) Mathis, J. S. 1990, ARA&A, 28, 37
- Mathis et al. (1977) Mathis, J. S., Rumpl, W., & Nordsieck, K. H. 1977, ApJ, 217, 425
- Mawet et al. (2017) Mawet, D., Choquet, É., Absil, O., et al. 2017, AJ, 153, 44
- Mayama et al. (2012) Mayama, S., Hashimoto, J., Muto, T., et al. 2012, ApJ, 760, L26
- McCabe et al. (2002) McCabe, C., Duchêne, G., & Ghez, A. M. 2002, ApJ, 575, 974
- McClure et al. (2016) McClure, M. K., Bergin, E. A., Cleeves, L. I., et al. 2016, ApJ, 831, 167
- Mendigutía et al. (2017a) Mendigutía, I., Oudmaijer, R. D., Mourard, D., & Muzerolle, J. 2017a, MNRAS, 464, 1984
- Mendigutía et al. (2017b) Mendigutía, I., Oudmaijer, R. D., Garufi, A., et al. 2017b, A&A, 608, A104
- Meru et al. (2017) Meru, F., Juhász, A., Ilee, J. D., et al. 2017, ApJ, 839, L24
- Momose et al. (2010) Momose, M., Ohashi, N., Kudo, T., Tamura, M., & Kitamura, Y. 2010, ApJ, 712, 397
- Momose et al. (2015) Momose, M., Morita, A., Fukagawa, M., et al. 2015, PASJ, 67, 83
- Monnier et al. (2017) Monnier, J. D., Harries, T. J., Aarnio, A., et al. 2017, ApJ, 838, 20
- Montesinos et al. (2016) Montesinos, M., Perez, S., Casassus, S., et al. 2016, ApJ, 823, L8
- Morzinski et al. (2014) Morzinski, K. M., Close, L. M., Males, J. R., et al. 2014, in Proc. SPIE, Vol. 9148, Adaptive Optics Systems IV, 914804
- Mouillet et al. (2001) Mouillet, D., Lagrange, A. M., Augereau, J. C., & Ménard, F. 2001, A&A, 372, L61
- Muñoz & Lai (2016) Muñoz, D. J., & Lai, D. 2016, ApJ, 827, 43
- Murakawa et al. (2008) Murakawa, K., Oya, S., Pyo, T.-S., & Ishii, M. 2008, A&A, 492, 731
- Murphy & Paunzen (2017) Murphy, S. J., & Paunzen, E. 2017, MNRAS, 466, 546
- Muto et al. (2012) Muto, T., Grady, C. A., Hashimoto, J., et al. 2012, ApJ, 748, L22
- Muzerolle et al. (2004) Muzerolle, J., D’Alessio, P., Calvet, N., & Hartmann, L. 2004, ApJ, 617, 406
- Najita & Kenyon (2014) Najita, J. R., & Kenyon, S. J. 2014, MNRAS, 445, 3315
- Öberg et al. (2015) Öberg, K. I., Guzmán, V. V., Furuya, K., et al. 2015, Nature, 520, 198
- Ogilvie & Lubow (2002) Ogilvie, G. I., & Lubow, S. H. 2002, MNRAS, 330, 950
- Oh et al. (2016a) Oh, D., Hashimoto, J., Tamura, M., et al. 2016a, PASJ, 68, L3
- Oh et al. (2016b) Oh, D., Hashimoto, J., Carson, J. C., et al. 2016b, ApJ, 831, L7
- Ohta et al. (2016) Ohta, Y., Fukagawa, M., Sitko, M. L., et al. 2016, PASJ, 68, 53
- Pascucci et al. (2016) Pascucci, I., Testi, L., Herczeg, G. J., et al. 2016, ApJ, 831, 125
- Pecaut & Mamajek (2013) Pecaut, M. J., & Mamajek, E. E. 2013, ApJS, 208, 9
- Pérez et al. (2016) Pérez, L. M., Carpenter, J. M., Andrews, S. M., et al. 2016, Science, 353, 1519
- Perrin et al. (2006) Perrin, M. D., Duchêne, G., Kalas, P., & Graham, J. R. 2006, ApJ, 645, 1272
- Perrin et al. (2009) Perrin, M. D., Schneider, G., Duchene, G., et al. 2009, ApJ, 707, L132
- Perrot et al. (2016) Perrot, C., Boccaletti, A., Pantin, E., et al. 2016, A&A, 590, L7
- Pfalzner (2003) Pfalzner, S. 2003, ApJ, 592, 986
- Pinilla et al. (2012) Pinilla, P., Birnstiel, T., Ricci, L., et al. 2012, A&A, 538, A114
- Pinilla et al. (2015) Pinilla, P., de Boer, J., Benisty, M., et al. 2015, A&A, 584, L4
- Pinte et al. (2008) Pinte, C., Padgett, D. L., Ménard, F., et al. 2008, A&A, 489, 633
- Pohl et al. (2017a) Pohl, A., Sissa, E., Langlois, M., et al. 2017a, A&A, 605, A34
- Pohl et al. (2017b) Pohl, A., Benisty, M., Pinilla, P., et al. 2017b, ApJ, 850, 52
- Price et al. (2018) Price, D. J., Cuello, N., Pinte, C., et al. 2018, MNRAS, 477, 1270
- Quanz et al. (2013) Quanz, S. P., Avenhaus, H., Buenzli, E., et al. 2013, ApJ, 766, L2
- Quanz et al. (2012) Quanz, S. P., Birkmann, S. M., Apai, D., Wolf, S., & Henning, T. 2012, A&A, 538, A92
- Quanz et al. (2011) Quanz, S. P., Schmid, H. M., Geissler, K., et al. 2011, ApJ, 738, 23
- Rameau et al. (2012) Rameau, J., Chauvin, G., Lagrange, A.-M., et al. 2012, A&A, 546, A24
- Rameau et al. (2017) Rameau, J., Follette, K. B., Pueyo, L., et al. 2017, AJ, 153, 244
- Rapson et al. (2015a) Rapson, V. A., Kastner, J. H., Andrews, S. M., et al. 2015a, ApJ, 803, L10
- Rapson et al. (2015b) Rapson, V. A., Kastner, J. H., Millar-Blanchaer, M. A., & Dong, R. 2015b, ApJ, 815, L26
- Reggiani et al. (2018) Reggiani, M., Christiaens, V., Absil, O., et al. 2018, A&A, 611, A74
- Ren et al. (2018) Ren, B., Dong, R., Esposito, T. M., et al. 2018, ApJ, 857, L9
- Rice & Armitage (2009) Rice, W. K. M., & Armitage, P. J. 2009, MNRAS, 396, 2228
- Rice et al. (2003) Rice, W. K. M., Armitage, P. J., Bate, M. R., & Bonnell, I. A. 2003, MNRAS, 339, 1025
- Rich et al. (2015) Rich, E. A., Wisniewski, J. P., Mayama, S., et al. 2015, AJ, 150, 86
- Richert et al. (2018) Richert, A. J. W., Getman, K. V., Feigelson, E. D., et al. 2018, MNRAS, 477, 5191
- Rodgers (2001) Rodgers, B. M. 2001, PhD thesis, UNIVERSITY OF WASHINGTON
- Rodigas et al. (2014) Rodigas, T. J., Follette, K. B., Weinberger, A., Close, L., & Hines, D. C. 2014, ApJ, 791, L37
- Rosenfeld et al. (2013) Rosenfeld, K. A., Andrews, S. M., Wilner, D. J., Kastner, J. H., & McClure, M. K. 2013, ApJ, 775, 136
- Rosotti et al. (2017) Rosotti, G. P., Clarke, C. J., Manara, C. F., & Facchini, S. 2017, MNRAS, 468, 1631
- Sandell et al. (2011) Sandell, G., Weintraub, D. A., & Hamidouche, M. 2011, ApJ, 727, 26
- Sartori et al. (2010) Sartori, M. J., Gregorio-Hetem, J., Rodrigues, C. V., Hetem, Jr., A., & Batalha, C. 2010, AJ, 139, 27
- Schneider et al. (2014) Schneider, G., Grady, C. A., Hines, D. C., et al. 2014, AJ, 148, 59
- Sicilia-Aguilar et al. (2010) Sicilia-Aguilar, A., Henning, T., & Hartmann, L. W. 2010, ApJ, 710, 597
- Siess et al. (2000) Siess, L., Dufour, E., & Forestini, M. 2000, A&A, 358, 593
- Silber et al. (2000) Silber, J., Gledhill, T., Duchêne, G., & Ménard, F. 2000, ApJ, 536, L89
- Spezzi et al. (2008) Spezzi, L., Alcalá, J. M., Covino, E., et al. 2008, ApJ, 680, 1295
- Spiegel & Burrows (2012) Spiegel, D. S., & Burrows, A. 2012, ApJ, 745, 174
- Stamatellos & Whitworth (2008) Stamatellos, D., & Whitworth, A. P. 2008, A&A, 480, 879
- Stapelfeldt et al. (1998) Stapelfeldt, K. R., Krist, J. E., Ménard, F., et al. 1998, ApJ, 502, L65
- Stapelfeldt et al. (2003) Stapelfeldt, K. R., Ménard, F., Watson, A. M., et al. 2003, ApJ, 589, 410
- Stapelfeldt et al. (1999) Stapelfeldt, K. R., Watson, A. M., Krist, J. E., et al. 1999, ApJ, 516, L95
- Stolker et al. (2016) Stolker, T., Dominik, C., Avenhaus, H., et al. 2016, A&A, 595, A113
- Stolker et al. (2017) Stolker, T., Sitko, M., Lazareff, B., et al. 2017, ApJ, 849, 143
- Takami et al. (2013) Takami, M., Karr, J. L., Hashimoto, J., et al. 2013, ApJ, 772, 145
- Tamura (2009) Tamura, M. 2009, in American Institute of Physics Conference Series, Vol. 1158, American Institute of Physics Conference Series, ed. T. Usuda, M. Tamura, & M. Ishii, 11–16
- Tamura et al. (2000) Tamura, M., Suto, H., Itoh, Y., et al. 2000, in Proc. SPIE, Vol. 4008, Optical and IR Telescope Instrumentation and Detectors, ed. M. Iye & A. F. Moorwood, 1153–1161
- Tamura et al. (2006) Tamura, M., Hodapp, K., Takami, H., et al. 2006, in Proc. SPIE, Vol. 6269, Society of Photo-Optical Instrumentation Engineers (SPIE) Conference Series, 62690V
- Tang et al. (2012) Tang, Y.-W., Guilloteau, S., Piétu, V., et al. 2012, A&A, 547, A84
- Tang et al. (2017) Tang, Y.-W., Guilloteau, S., Dutrey, A., et al. 2017, ApJ, 840, 32
- Tanii et al. (2012) Tanii, R., Itoh, Y., Kudo, T., et al. 2012, PASJ, 64, 124
- Thalmann et al. (2010) Thalmann, C., Grady, C. A., Goto, M., et al. 2010, ApJ, 718, L87
- Thalmann et al. (2014) Thalmann, C., Mulders, G. D., Hodapp, K., et al. 2014, A&A, 566, A51
- Thalmann et al. (2015) Thalmann, C., Mulders, G. D., Janson, M., et al. 2015, ApJ, 808, L41
- Thalmann et al. (2016) Thalmann, C., Janson, M., Garufi, A., et al. 2016, ApJ, 828, L17
- The et al. (1994) The, P. S., de Winter, D., & Perez, M. R. 1994, A&AS, 104, 315
- Thi et al. (2013) Thi, W. F., Ménard, F., Meeus, G., et al. 2013, A&A, 557, A111
- Tobin et al. (2016) Tobin, J. J., Kratter, K. M., Persson, M. V., et al. 2016, Nature, 538, 483
- Tomida et al. (2017) Tomida, K., Machida, M. N., Hosokawa, T., Sakurai, Y., & Lin, C. H. 2017, ApJ, 835, L11
- Toomre (1964) Toomre, A. 1964, ApJ, 139, 1217
- Tsukagoshi et al. (2014) Tsukagoshi, T., Momose, M., Hashimoto, J., et al. 2014, ApJ, 783, 90
- Uyama et al. (2017) Uyama, T., Hashimoto, J., Kuzuhara, M., et al. 2017, AJ, 153, 106
- Uyama et al. (2018) Uyama, T., Hashimoto, J., Muto, T., et al. 2018, ArXiv e-prints, arXiv:1804.05934
- Valdes et al. (2004) Valdes, F., Gupta, R., Rose, J. A., Singh, H. P., & Bell, D. J. 2004, ApJS, 152, 251
- Valenti et al. (2003) Valenti, J. A., Fallon, A. A., & Johns-Krull, C. M. 2003, ApJS, 147, 305
- van Boekel et al. (2017) van Boekel, R., Henning, T., Menu, J., et al. 2017, ApJ, 837, 132
- van den Ancker et al. (1996) van den Ancker, M. E., The, P. S., & de Winter, D. 1996, A&A, 309, 809
- van der Marel et al. (2016) van der Marel, N., Verhaar, B. W., van Terwisga, S., et al. 2016, A&A, 592, A126
- van der Marel et al. (2013) van der Marel, N., van Dishoeck, E. F., Bruderer, S., et al. 2013, Science, 340, 1199
- Vieira et al. (2003) Vieira, S. L. A., Corradi, W. J. B., Alencar, S. H. P., et al. 2003, AJ, 126, 2971
- Vigan et al. (2017) Vigan, A., Bonavita, M., Biller, B., et al. 2017, A&A, 603, A3
- Vorobyov & Basu (2005) Vorobyov, E. I., & Basu, S. 2005, ApJ, 633, L137
- Vorobyov & Basu (2010) —. 2010, ApJ, 719, 1896
- Wagner et al. (2015) Wagner, K., Apai, D., Kasper, M., & Robberto, M. 2015, ApJ, 813, L2
- Wagner et al. (2018) Wagner, K., Dong, R., Sheehan, P., et al. 2018, ApJ, 854, 130
- Wahhaj et al. (2015) Wahhaj, Z., Cieza, L. A., Mawet, D., et al. 2015, A&A, 581, A24
- Walker & Wolstencroft (1988) Walker, H. J., & Wolstencroft, R. D. 1988, PASP, 100, 1509
- Walsh et al. (2016) Walsh, C., Juhász, A., Meeus, G., et al. 2016, ApJ, 831, 200
- Walsh et al. (2014) Walsh, C., Juhász, A., Pinilla, P., et al. 2014, ApJ, 791, L6
- Watson & Stapelfeldt (2004) Watson, A. M., & Stapelfeldt, K. R. 2004, ApJ, 602, 860
- Weinberger et al. (1999) Weinberger, A. J., Becklin, E. E., Schneider, G., et al. 1999, ApJ, 525, L53
- Weinberger et al. (2002) —. 2002, ApJ, 566, 409
- White et al. (2016) White, J. A., Boley, A. C., Hughes, A. M., et al. 2016, ApJ, 829, 6
- Williams & Best (2014) Williams, J. P., & Best, W. M. J. 2014, ApJ, 788, 59
- Wolff et al. (2016) Wolff, S. G., Perrin, M., Millar-Blanchaer, M. A., et al. 2016, ApJ, 818, L15
- Yang et al. (2017) Yang, Y., Hashimoto, J., Hayashi, S. S., et al. 2017, AJ, 153, 7
- Zacharias et al. (2012) Zacharias, N., Finch, C. T., Girard, T. M., et al. 2012, VizieR Online Data Catalog, 1322
- Zhang et al. (2014) Zhang, K., Isella, A., Carpenter, J. M., & Blake, G. A. 2014, ApJ, 791, 42
- Zhu et al. (2015) Zhu, Z., Dong, R., Stone, J. M., & Rafikov, R. R. 2015, ApJ, 813, 88
- Zhu et al. (2012) Zhu, Z., Nelson, R. P., Dong, R., Espaillat, C., & Hartmann, L. 2012, ApJ, 755, 6
| # | Object | Spiral | SpT | D | ||||||||
|---|---|---|---|---|---|---|---|---|---|---|---|---|
| K | pc | mJy | AU | 1% | ||||||||
| (1) | (2) | (3) | (4) | (5) | (6) | (7) | (8) | (9) | (10) | (11) | (12) | (13) |
| 3 | AB Aur | Multiple | 43.81 | 9380 | B9.511 | 15316 | 2.50 | 3091 | 890 | 23030 | 50 | 0.6 |
| 4 | MWC 480 | None | 19.61 | 8330 | A5 | 14216 | 2.04 | 33117 | 1167 | 170 | 95 | 1.4 |
| 6 | MWC 758 | 2 | 8.52 | 7600 | A812 | 15116 | 1.68 | 1802 | 880 | 151 | 36 | 0.7 |
| … | V1247 Ori | One Arm | 15.83 | 7880 | F013 | 32016 | 1.91 | 30018 | 870 | 190 | 252 | 4.0 |
| 10 | HD 97048 | None | 36.13 | 10500 | A0 | 17916 | 2.50 | 223019 | 867 | 403 | 737 | 8.8 |
| 13 | HD 100546 | Multiple | 24.73 | 9750 | B914 | 10916 | 2.30 | 124020 | 867 | 230 | 118 | 1.5 |
| 17 | SAO 206462 | 2 | 8.83 | 6375 | F4 | 15616 | 1.70 | 6202 | 880 | 156 | 136 | 2.4 |
| 21 | HD 142527 | Multiple | 9.93 | 6500 | F6 | 15616 | 1.70 | 331021 | 880 | 300 | 1126 | 19.9 |
| 26 | IRS 48 | None | 20.44 | 9530 | A0 | 120 | 2.25 | 1806 | 850 | 6031 | 10 | 0.1 |
| 33 | HD 163296 | None | 23.63 | 9250 | A211 | 11916 | 2.18 | 182022 | 850 | 250 | 210 | 2.9 |
| 34 | HD 169142 | None | 6.15 | 6700 | F3 | 11716 | 1.51 | 23223 | 1288 | 100 | 60 | 1.2 |
| … | LkHa 330 | 2 | 12.86 | 5830 | G3 | 250 | 2.12 | 2102 | 880 | 170 | 110 | 1.6 |
| … | FN Tau | None | 0.57 | 3240 | M5 | 140 | 0.30 | 3724 | 882 | … | 19 | 1.9 |
| … | RY Tau | None | 23.11 | 5080 | K1 | 17716 | 3.30 | 4691 | 890 | 20032 | 116 | 1.1 |
| … | UX Tau | None | 2.01 | 4900 | G8 | 15816 | 1.60 | 1502 | 880 | 85 | 37 | 0.7 |
| … | LkCa 15 | None | 1.06 | 4730 | K5 | 140 | 1.27 | 4102 | 880 | 182 | 191 | 4.5 |
| … | GM Aur | None | 1.21 | 4730 | K3 | 140 | 1.16 | 6402 | 880 | 120 | 193 | 5.0 |
| … | SU Aur | None | 10.71 | 5520 | G8 | 14216 | 2.25 | 711 | 890 | … | 12 | 0.2 |
| … | TW Hya | None | 0.46 | 4210 | M2 | 6016 | 1.00 | 150025 | 867 | 65 | 75 | 2.2 |
| … | DZ Cha | 2 | 0.68 | 3770 | M0 | 110 | 0.51 | 748 | 517 | … | 6 | 0.4 |
| … | PDS 66 | None | 1.46 | 5080 | K1 | 9916 | 1.30 | 20726 | 1200 | … | 73 | 1.7 |
| … | PDS 70 | None | 1.29 | 4140 | K515 | 140 | 0.83 | 3827 | 1300 | 100 | 26 | 0.9 |
| … | IM Lupi | None | 0.910 | 3900 | M0 | 16116 | 0.60 | 59010 | 875 | 300 | 614 | 30.7 |
| … | J1604-2130 | None | 0.66 | 4350 | K2 | 145 | 1.10 | 2262 | 880 | 14533 | 116 | 3.2 |
| … | Sz 91 | None | 0.36 | 3720 | M0.5 | 200 | 0.48 | 4228 | 860 | 160 | 60 | 3.7 |
| … | RX J1615.3-3255 | None | 1.32 | 4350 | K5 | 185 | 1.10 | 4302 | 880 | 185 | 317 | 8.6 |
| … | DoAr 28 | None | 0.76 | 4370 | K5 | 139 | 1.12 | 6929 | 1300 | … | 77 | 2.1 |
| … | SR 21 | None | 6.56 | 5830 | G3 | 120 | 1.67 | 4002 | 880 | 84 | 38 | 0.7 |
| … | V4046 Sgr | None | 0.76 | 4350 | K5 | 73 | 1.10 | 7706 | 850 | 7334 | 49 | 1.3 |
| # | Object | Spiral | Included? | SpT | D | |||||||||||||
|---|---|---|---|---|---|---|---|---|---|---|---|---|---|---|---|---|---|---|
| K | pc | mJy | AU | , Lit. | , Lit. | , Lit. | ||||||||||||
| (1) | (2) | (3) | (4) | (5) | (6) | (7) | (8) | (9) | (10) | (11) | (12) | (13) | (14) | (15) | (16) | (17) | (18) | (19) |
| 1 | HR811 | … | No | B735 | 87.140 | 14000 | 12016 | 4.00 | 3.00 | … | … | … | … | … | … | -1.49 | 0.6052 | -7.02 |
| 2 | V892 Tau | … | No | A014 | 39.841 | 11220 | 160 | 2.75 | 2.02 | 63043 | 850 | 10053 | 62 | … | … | -1.44 | 0.6554 | -6.98 |
| 3 | AB Aur | Multiple | Yes | B9.511 | 43.81 | 9380 | 15316 | 2.50 | 2.53 | 3091 | 890 | 230 | 50 | … | -2.68 | … | 1.0855 | -6.41 |
| 4 | MWC 480 | None | Yes | A51 | 19.61 | 8330 | 14216 | 2.04 | 2.09 | 33117 | 1167 | 170 | 95 | … | -3.00 | … | 0.6555 | -6.84 |
| 5 | PDS 178 | … | No | A2/A736 | 23.442 | 8910 | 150 | 2.20 | 1.96 | 2044 | 1200 | … | 7 | … | … | -1.78 | 0.3156 | -7.23 |
| 6 | MWC 758 | 2 | Yes | A837 | 8.52 | 7600 | 15116 | 1.68 | 1.68 | 1802 | 880 | 151 | 36 | … | -3.15 | … | 0.4555 | -7.05 |
| 7 | CQ Tau | … | No | F59 | 10.741 | 6760 | 16016 | 1.71 | 2.35 | 14344 | 1300 | … | 90 | … | -4.08 | … | -0.6155 | -7.97 |
| 8 | PDS201 | … | Yes | A737 | 9.540 | 7850 | 16816 | 1.76 | 1.76 | … | … | … | … | … | … | -1.95 | 0.1457 | -7.36 |
| 9 | HD56895 | … | Yes | F035 | 11.740 | 7500 | 16716 | 1.80 | 1.92 | … | … | … | … | … | … | … | … | … |
| 10 | HD 97048 | None | Yes | A014 | 36.23 | 10500 | 17916 | 2.50 | 1.85 | 223019 | 867 | 403 | 736 | … | -2.81 | … | 0.8658 | -6.77 |
| 11 | HIP 54557 | … | Yes | B935 | 20.940 | 10700 | 18416 | 2.61 | 1.95 | … | … | … | -3.35 | … | 0.1159 | -7.51 | ||
| 12 | HD 100453 | … | No | A938 | 6.03 | 7250 | 10316 | 1.54 | 1.79 | 18246 | 1300 | … | 58 | … | … | -2.35 | -0.2658 | -7.69 |
| 13 | HD 100546 | Multiple | Yes | B937 | 24.73 | 9750 | 10916 | 2.30 | 2.58 | 124020 | 867 | 230 | 118 | 0.56 | … | … | 0.663 | -6.78 |
| 14 | HD104237 | … | Yes | A014 | 20.93 | 8000 | 10416 | 1.97 | 2.28 | 6645 | 1300 | … | 14 | 0.7 | … | … | 0.613 | -6.82 |
| 15 | PDS 141 | … | Yes | F039 | 19.039 | 7200 | 180 | 1.92 | 2.73 | 147047 | 1200 | … | 796 | … | … | -1.15 | 0.9439 | -6.40 |
| 16 | PDS389 | … | Yes | A337 | 8.937 | 8710 | 175 | 1.96 | 1.87 | … | … | … | … | … | … | -1.84 | 0.2560 | -7.27 |
| 17 | SAO 206462 | 2 | Yes | F414 | 8.83 | 6375 | 15616 | 1.70 | 2.54 | 6202 | 880 | 156 | 136 | -0.04 | … | … | 0.053 | -7.27 |
| 18 | PDS 395 | … | Yes | A837 | 5.83 | 7750 | 13116 | 1.74 | 1.71 | 24244 | 1300 | … | 129 | -0.1 | … | … | -0.163 | -7.66 |
| 19 | HD141569 | … | No | A037 | 18.83 | 9750 | 11116 | 2.26 | 2.58 | 1348 | 870 | 60 | 1 | -0.05 | … | … | -0.063 | -7.50 |
| 20 | PDS 76 | … | Yes | A837 | 9.83 | 7500 | 15016 | 1.78 | 1.78 | 31343 | 850 | … | 65 | … | -3.63 | … | -0.2258 | -7.72 |
| 21 | HD 142527 | Multiple | Yes | F635 | 9.93 | 6500 | 15616 | 1.70 | 2.52 | 331021 | 880 | 300 | 1126 | -0.09 | … | … | 0.013 | -7.32 |
| 22 | PDS 78 | … | Yes | A837 | 11.03 | 7500 | 16016 | 1.80 | 1.93 | 3744 | 1300 | … | 23 | 0.02 | … | … | 0.023 | -7.44 |
| 23 | HR 5999 | … | No | A714 | 59.63 | 8500 | 16316 | 2.53 | 3.09 | 6043 | 850 | … | 8 | 1.1 | … | … | 1.123 | -6.29 |
| 24 | PDS 80 | … | Yes | A837 | 8.23 | 8000 | 14916 | 1.76 | 1.75 | … | … | … | … | … | … | -2.34 | -0.2558 | -7.75 |
| 25 | HIP80425 | … | Yes | A138 | 15.940 | 9200 | 15216 | 2.39 | 2.17 | … | … | … | … | … | … | … | … | … |
| 26 | IRS 48 | None | Yes | A04 | 20.44 | 9530 | 120 | 2.25 | 2.52 | 100049 | 441 | 60 | 12 | … | -3.35 | … | 0.114 | -7.34 |
| 27 | WLY 1-53 | … | Yes | A74 | 17.44 | 7850 | 130 | 1.91 | 2.13 | … | … | … | … | … | -3.67 | … | -0.3261 | -7.76 |
| 28 | HD148352 | … | Yes | F24 | 16.24 | 6890 | 130 | 1.90 | 2.70 | … | … | … | … | … | … | … | … | … |
| 29 | HIP81474 | … | Yes | B9.535 | 78.140 | 10400 | 14916 | 2.73 | 2.78 | … | … | … | … | … | -3.04 | … | 0.5059 | -6.98 |
| 30 | MWC863 | … | No | B9.535 | 23.83 | 9000 | 145 | 2.20 | 1.94 | 10143 | 850 | … | 14 | 0.1 | … | … | 0.273 | -7.28 |
| 31 | AK Sco | … | No | F515 | 4.73 | 6250 | 14316 | 1.43 | 1.72 | 3350 | 1300 | 140 | 18 | … | -2.60 | … | 1.4558 | -5.96 |
| 32 | 51 Oph | … | No | A235 | 147.940 | 9700 | 12416 | 3.20 | 3.75 | 551 | 1200 | … | 1 | … | -1.99 | … | 1.8759 | -5.56 |
| 33 | HD 163296 | None | Yes | A211 | 23.43 | 9250 | 11916 | 2.18 | 1.84 | 182022 | 850 | 250 | 210 | 0.08 | … | … | 0.223 | -7.35 |
| 34 | HD 169142 | None | Yes | F35 | 6.05 | 6700 | 11716 | 1.51 | 1.90 | 23223 | 1288 | 100 | 60 | … | -3.08 | … | 0.4559 | -6.95 |
| 35 | TY CrA | … | No | B914 | 37.240 | 10700 | 130 | 2.61 | 1.95 | … | … | … | … | … | -3.78 | … | -0.4662 | -8.08 |
| 36 | T CrA | … | No | F014 | 1.640 | 7200 | 130 | 1.54 | 1.78 | … | … | … | … | … | -3.94 | … | -0.6662 | -8.09 |
References in Tables 1 and LABEL:tab:herbig. 111Andrews et al. (2013) 222Andrews et al. (2011) 333Fairlamb et al. (2015) 444Erickson et al. (2011) 555Murphy & Paunzen (2017) 666van der Marel et al. (2016) 777Kudo et al. (2008) 888Canovas et al. (2018) 999Stellar temperature estimated from the spectral type using Pecaut & Mamajek (2013); luminosity calculated from the photometry reported in SIMBAD. 101010Cleeves et al. (2016) 111111Valenti et al. (2003) 121212Beskrovnaya et al. (1999) 131313Kraus et al. (2013) 141414The et al. (1994) 151515SIMBAD 161616Gaia Collaboration et al. (2016) 171717Öberg et al. (2015) 181818Kraus et al. (2017) 191919Walsh et al. (2016) 202020Walsh et al. (2014) 212121Boehler et al. (2017) 222222de Gregorio-Monsalvo et al. (2013) 232323Fedele et al. (2017) 242424Momose et al. (2010) 252525Andrews et al. (2016) 262626Carpenter et al. (2005) 272727Hashimoto et al. (2015) 282828Zhang et al. (2014) 292929Rich et al. (2015) 303030Tang et al. (2012) 313131Brown et al. (2012) 323232Isella et al. (2009) 333333Dong et al. (2017b) 343434Rosenfeld et al. (2013) 353535Malfait et al. (1998) 363636Walker & Wolstencroft (1988) 373737Vieira et al. (2003) 383838Chen et al. (2012) 393939Spezzi et al. (2008) 404040This work; see Appendix D for details. 414141Hernández et al. (2005) 424242Manoj et al. (2006) 434343Sandell et al. (2011) 444444Alonso-Albi et al. (2009) 454545Henning et al. (1994) 464646Menard et al. in prep. 474747Alcalá et al. (2008) 484848White et al. (2016) 494949van der Marel et al. (2013) 505050Czekala et al. (2015) 515151Thi et al. (2013) 525252Valdes et al. (2004) 535353Hamidouche (2010) 545454Hernández et al. (2004) 555555Donehew & Brittain (2011) 565656Dunkin & Crawford (1998) 575757van den Ancker et al. (1996) 585858Fairlamb et al. (2017) 595959Garcia Lopez et al. (2006) 606060Sartori et al. (2010) 616161Greene & Meyer (1995) 626262Finkenzeller & Mundt (1984)
| All Stars | AB Stars | FGK Stars | Herbig IMS | |
|---|---|---|---|---|
| Two arms | 4/29 | 1/7 | 3/22 | 2/11 |
| Multiple arms | 3/29 | 2/7 | 1/22 | 3/11 |
| One arm | 1/29 | 1/22 | 1/11 | |
| All arm types | 8/29 | 3/7 | 5/22 | 6/11 |
| All Types of Arms | Two Arms | Multiple Arms | |
|---|---|---|---|
| Sources with arms | 5 | 2 | 3 |
| Arm fraction, well-studied disks | 5/10 | 2/10 | 3/10 |
| Arm fraction, all disks | 5/24 | 2/24 | 3/24 |
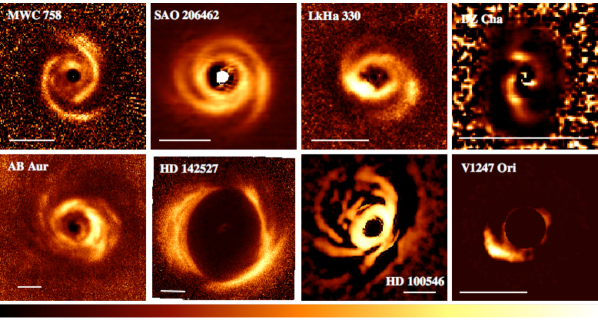
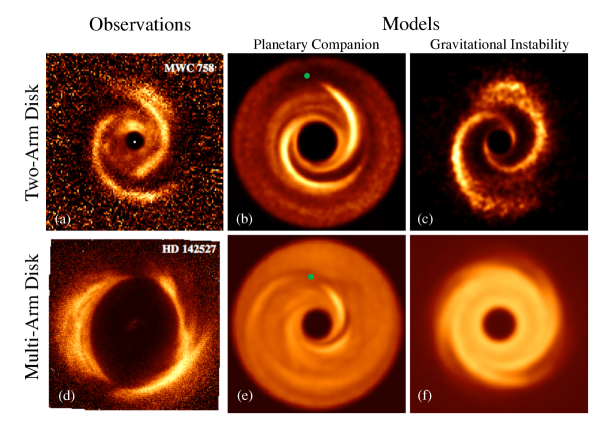
Submillimeter Continuum-Based Disk Masses
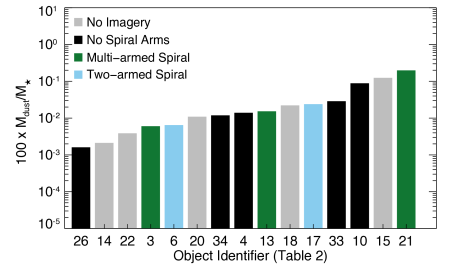
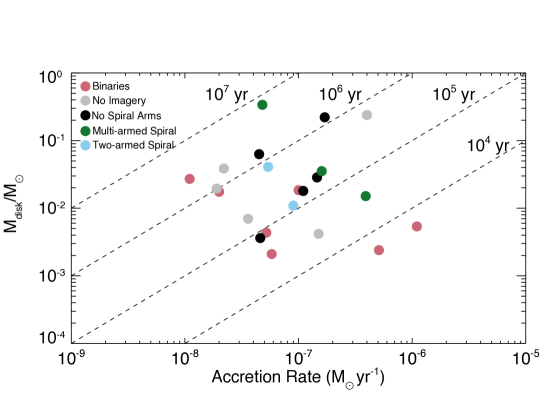
Accretion Rate-Based Disk Masses
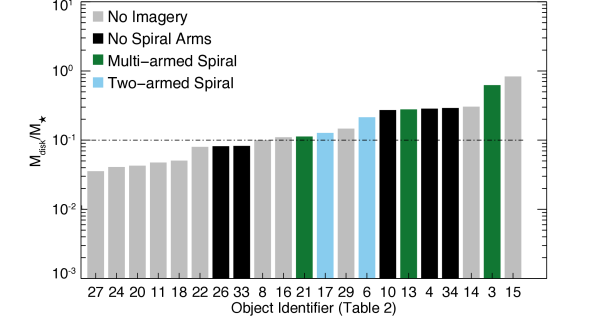
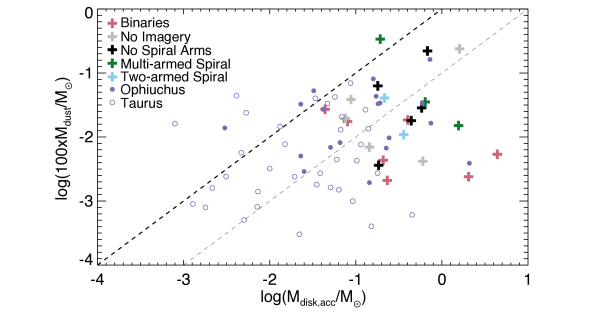
Appendix A Scattered Light Disk Sample
| Target | Instrument | Wavelength | Intensity | Mode | Reference |
|---|---|---|---|---|---|
| (1) | (2) | (3) | (4) | (5) | (6) |
| AA Tau | HST / STIS | optical | total | Coro | Cox et al. (2013) |
| AB Aur | Subaru / CIAO | total | Coro | Fukagawa et al. (2004) | |
| … | HST / NICMOS | 1.1, 2 | pol, total | Coro | Perrin et al. (2009) |
| … | Subaru / HiCIAO | pol | Coro | Hashimoto et al. (2011) | |
| AK Sco | VLT / SPHERE | , , | total | Coro | Janson et al. (2016) |
| DoAr 28 | Subaru / HiCIAO | pol | DI | Rich et al. (2015) | |
| DZ Cha | VLT / SPHERE | pol | DICoro | Canovas et al. (2018) | |
| FN Tau | Subaru / CIAO | total | Coro | Kudo et al. (2008) | |
| GG Tau | HST / NICMOS | 1um | pol | DI | Silber et al. (2000) |
| … | HST / WFPC2 | optical | total | DI | Krist et al. (2002) |
| … | HST / NICMOS | 1.1 to 2 | total | DI | McCabe et al. (2002) |
| … | Subaru / CIAO | total | Coro | Itoh et al. (2002) | |
| … | Keck / NIRC2 | total | DI | Duchêne et al. (2004) | |
| … | HST / ACS | optical | total | DI | Krist et al. (2005) |
| … | Subaru / HiCIAO | pol | Coro | Itoh et al. (2014) | |
| … | Subaru / HiCIAO | pol | DI | Yang et al. (2017) | |
| GM Aur | Subaru / HiCIAO | pol | DI | Oh et al. (2016b) | |
| HD 100453 | VLT / SPHERE | , , , | total | DI | Wagner et al. (2015) |
| … | VLT / SPHERE | optical, | pol | DICoro | Benisty et al. (2017) |
| … | Gemini / GPI | , , | pol | DI | Long et al. (2017) |
| HD 100546 | HST / STIS | 1.1 to 2 | total | Coro | Grady et al. (2001) |
| … | HST / NICMOS2 | total | Coro | Augereau et al. (2001) | |
| … | VLT / NACO | , | pol | DI | Quanz et al. (2011) |
| … | Gemini / NICI | total | Coro | Boccaletti et al. (2013) | |
| … | VLT / NACO | , , | pol | DI | Avenhaus et al. (2014) |
| … | Gemini / NICI | , | total | DI | Currie et al. (2014) |
| … | Gemini / GPI | pol, total | DICoro | Currie et al. (2015) | |
| … | VLT / SPHERE | optical, , | pol, total | DICoro | Garufi et al. (2016) |
| … | Gemini / GPI, Magellan / MagAO | optical, | total | DICoro | Rameau et al. (2017) |
| … | Gemini / GPI, Magellan / MagAO | optical, , | pol, total | Coro | Follette et al. (2017) |
| HD 141569 | HST / NICMOS | 1.1 | total | Coro | Weinberger et al. (1999) |
| … | HST / STIS | optical | total | Coro | Mouillet et al. (2001) |
| … | HST / ACS | optical | total | Coro | Clampin et al. (2003) |
| … | Gemini / NICI | total | Coro | Biller et al. (2015) | |
| … | HST / STIS | optical | total | Coro | Konishi et al. (2016) |
| … | Keck / NIRC2 | total | DI | Currie et al. (2016) | |
| … | VLT / SPHERE | , , , | total | Coro | Perrot et al. (2016) |
| HD 142527 | Subaru / CIAO | , | total | Coro | Fukagawa et al. (2006) |
| … | Subaru / CIAO | 3, | total | DICoro | Honda et al. (2009) |
| … | VLT / NACO | total | DI | Rameau et al. (2012) | |
| … | VLT / NACO | , | pol | DI | Canovas et al. (2013) |
| … | Gemini / GPI | pol | DI | Rodigas et al. (2014) | |
| … | VLT / NACO | , | pol | DI | Avenhaus et al. (2014) |
| … | VLT / SPHERE | optical | pol | DI | Mendigutía et al. (2017b) |
| … | VLT / SPHERE | optical | pol | DI | Avenhaus et al. (2017) |
| HD 150193 | Subaru / CIAO | total | Coro | Fukagawa et al. (2003) | |
| HD 163296 | VLT / NACO | , | pol | DI | Garufi et al. (2014) |
| … | Gemini / GPI | pol | Coro | Monnier et al. (2017) | |
| … | VLT / NACO | pol | DI | Garufi et al. (2017) | |
| HD 169142 | HST / NICMOS | 1.1 | total | Coro | Grady et al. (2007) |
| … | VLT / NACO | pol | DI | Quanz et al. (2013) | |
| … | Subaru / HiCIAO | pol | Coro | Momose et al. (2015) | |
| … | VLT / SPHERE | optical, , , | pol | Coro | Pohl et al. (2017b) |
| … | Gemini / GPI | pol | Coro | Monnier et al. (2017) | |
| … | VLT / SPHERE | , , , | pol, total | DICoro | Ligi et al. (2018) |
| … | VLT / SPHERE | optical | pol | DI | Bertrang et al. (2018) |
| HD 97048 | VLT / NACO | , | pol | DI | Quanz et al. (2012) |
| … | VLT / SPHERE | , | pol, total | Coro | Ginski et al. (2016) |
| IM Lupi | HST / WFPC2 / NICMOS | optical, | total | DICoro | Pinte et al. (2008) |
| IRS 48 | Subaru / HiCIAO | , | pol | DI | Follette et al. (2015) |
| J1604-2130 | Subaru / HiCIAO | pol | DI | Mayama et al. (2012) | |
| … | VLT / SPHERE | optical | pol | DI | Pinilla et al. (2015) |
| … | VLT / SPHERE | , , , | total | Coro | Canovas et al. (2017) |
| LkCa 15 | Subaru / HiCIAO | , | total | DI | Thalmann et al. (2010) |
| … | Gemini / NIRI | total | DI | Thalmann et al. (2014) | |
| … | VLT / SPHERE | optical | pol | DI | Thalmann et al. (2015) |
| … | Subaru / HiCIAO | pol | DI | Oh et al. (2016a) | |
| … | VLT / SPHERE | pol | DICoro | Thalmann et al. (2016) | |
| LkH 330 | Subaru / HiCIAO | pol | DI | Akiyama et al. (2016) | |
| … | Subaru / HiCIAO | , | pol | DI | Uyama et al. (2018) |
| MWC 480 | HST / NICMOS | 1.1, 1.6 | total | Coro | Grady et al. (2010) |
| … | Subaru / HiCIAO | pol | Coro | Kusakabe et al. (2012) | |
| MWC 758 | Subaru / CIAO | pol | DICoro | Grady et al. (2013) | |
| … | VLT / SPHERE | pol | Coro | Benisty et al. (2015) | |
| … | Keck / NIRC2 | total | Coro | Reggiani et al. (2018) | |
| … | Keck / NIRC2 | total | Coro | Ren et al. (2018) | |
| PDS 66 | HST / STIS | 1.1 | total | Coro | Schneider et al. (2014) |
| … | Gemini / GPI | , | pol | Coro | Wolff et al. (2016) |
| PDS 70 | Subaru / HiCIAO | pol | DI | Hashimoto et al. (2012) | |
| RX J1615.3-3255 | Subaru / HiCIAO | pol | DI | Kooistra et al. (2017) | |
| … | VLT / SPHERE | optical, , , | pol, total | DICoro | de Boer et al. (2016) |
| RY Lup | VLT / SPHERE | , , | pol, total | DICoro | Langlois et al. (2018) |
| RY Tau | Subaru / HiCIAO | pol | Coro | Takami et al. (2013) | |
| SAO 206462 | HST / NICMOS | optical, 1.1, 1.6 | total | DICoro | Grady et al. (2009) |
| … | Subaru / HiCIAO | pol | DI | Muto et al. (2012) | |
| … | VLT / NACO | , | pol | DI | Garufi et al. (2013) |
| … | Gemini / GPI | total | Coro | Wahhaj et al. (2015) | |
| … | VLT / SPHERE | optical, , | pol | DICoro | Stolker et al. (2016) |
| … | VLT / SPHERE | , , | pol | Coro | Stolker et al. (2017) |
| … | VLT / SPHERE | , , , | total | Coro | Maire et al. (2017) |
| SR 21 | Subaru / HiCIAO | pol | DI | Follette et al. (2013) | |
| SU Aur | Subaru / HiCIAO | pol | DI | de Leon et al. (2015) | |
| Sz 91 | Subaru / HiCIAO | pol | DI | Tsukagoshi et al. (2014) | |
| T Cha | VLT / SPHERE | optical, , , | pol, total | Coro | Pohl et al. (2017a) |
| T Tau | VLT / SPHERE | , | total | Coro | Kasper et al. (2016) |
| TW Hya | HST / WFPC2 | optical | total | DI | Krist et al. (2000) |
| … | HST / NICMOS | 1.1, 1.6 | total | Coro | Weinberger et al. (2002) |
| … | HST / STIS | optical, 1.1-2.2 | total | Coro | Debes et al. (2013) |
| … | Subaru / HiCIAO | pol | DI | Akiyama et al. (2015) | |
| … | Gemini / GPI | , | pol | Coro | Rapson et al. (2015b) |
| … | VLT / SPHERE | optical, , | pol | DICoro | van Boekel et al. (2017) |
| … | HST / STIS | optical | total | Coro | Debes et al. (2017) |
| UX Tau | Subaru / HiCIAO | pol | Coro | Tanii et al. (2012) | |
| V1247 Ori | Subaru / HiCIAO | pol | Coro | Ohta et al. (2016) | |
| V4046 Sgr | Gemini / GPI | , | pol | Coro | Rapson et al. (2015a) |
| Edge On Sources (Central Source Invisible) | |||||
| HH 30 | HST / WFPC2 | optical | total | DI | Burrows et al. (1996) |
| … | HST / WFPC2 | optical | total | DI | Stapelfeldt et al. (1999) |
| … | HST / NICMOS | 1-2 | total | DI | Cotera et al. (2001) |
| … | HST / WFPC2 | optical | total | DI | Watson & Stapelfeldt (2004) |
| HK Tau | HST / WFPC2 | optical | total | DI | Stapelfeldt et al. (1998) |
| HV Tau C | HST / WFPC2 | optical | total | DI | Stapelfeldt et al. (2003) |
| LkH 263C | Gemini / Hokupa | total | DI | Jayawardhana et al. (2002) | |
| PDS 144 N | Keck / NIRC2 | , , | total | DI | Perrin et al. (2006) |
| Partially Embedded / Class 0 / Class I Sources | |||||
| FU Ori | Subaru / HiCIAO | pol | Coro | Liu et al. (2016a) | |
| HL Tau | Subaru / CIAO | , , | pol | DI | Lucas et al. (2004) |
| … | Subaru / CIAO | , , | pol | DI | Murakawa et al. (2008) |
| R Mon | HST / WFPC2 | , , | pol, total | DI | Close et al. (1997) |
| V1057 Cyg | Subaru / HiCIAO | pol | Coro | Liu et al. (2016a) | |
| V1735 Cyg | Subaru / HiCIAO | pol | Coro | Liu et al. (2016a) | |
| Z CMa | VLT / SPHERE | , | pol | DI | Canovas et al. (2015) |
| … | VLT / SPHERE | optical | total | DI | Antoniucci et al. (2016) |
| … | Subaru / HiCIAO | pol | Coro | Liu et al. (2016a) | |
Note. — Column (2): the instrument used in each observation, including STIS, NICMOS, ACS, and WFPC2 on HST, CIAO (Tamura et al., 2000) and HiCIAO (Tamura et al., 2006) on Subaru, NICI (Chun et al., 2008) and GPI (Macintosh et al., 2008) on Gemini, NACO (Lenzen et al., 2003) and SPHERE (Beuzit et al., 2008) on VLT, NIRC2 on Keck, and MagAO on Magellan (Morzinski et al., 2014). Column (4): “pol” – polarized intensity; “total” – total intensity. Column (5): observing mode; “Coro” – coronagraphic imaging; “DI” – direct imaging with no coronagraph. See §2 for details.
Appendix B Disk Mass Measurements
The direct measurement of the mass of an accretion disk around a young star is almost impossible. Most of the disk mass is comprised of molecular hydrogen which lacks a dipole moment and whose lowest energy emission line has an upper state energy level of 510 K (Mandy & Martin, 1993). Thus emission lines from this molecule only trace relatively warm gas. Additionally, disks are very optically thick. For a disk that is 1% of the minimum mass solar nebula, the surface density at 1 au is 20 g cm-2 (Hayashi, 1981). For a solar abundance and Mathis et al. (1977) dust distribution, the disk is optically thick at the mid-infrared wavelengths at which molecular hydrogen emits. Thus only the optically thin atmosphere can be observed. HD is a promising gas tracer owing to its lower upper energy state, far infrared emission lines, and allowed dipole transitions (Bergin et al., 2013; McClure et al., 2016), however, the conversion to a total gas mass is still model dependent. Numerous other gas tracers have been explored for measuring disk masses, but these values are also model dependent and have not been independently validated (e.g., CO; Williams & Best, 2014).
Because of the difficulty in measuring gas in disks, the most common avenue to estimate is to convert the observed continuum flux density, , at a submillimeter frequency , to the dust (solids) mass, , then scale by a constant gas-to-dust mass ratio , often assumed to be 100:1, to obtain the gas disk mass, :
| (B1) |
where is the distance to the source, is Planck function at the dust temperature , and is the dust opacity. Unfortunately, the midplane temperature of the dust has not been measured directly, the opacity of the dust is poorly constrained (Draine, 2006), massive disks may be optically thick in mm continuum observations (e.g., Evans et al. 2017), and the gas to dust ratio in the disk has not been robustly measured (cf. Forgan & Rice 2013, Eisner et al. 2016, and Eisner et al. 2018). With these caveats in mind, we have calculated an estimate of the disk mass following this approach.
We provide a submillimeter flux-based estimate (Eqn B1) for the targets listed in Tables 1 and LABEL:tab:herbig in the following steps. First, we obtain the submillimeter flux density of the sources from literature (Columns 8 and 10 in Tables 1 and LABEL:tab:herbig, respectively). We adopt measurements at whenever possible. For all “Well studied NIR disks” we are able to find flux density measurements at wavelengths within a factor of 2 of 880. Next, we convert all submillimeter flux density measurements to the flux density at 880 , assuming a spectral index (Andrews et al., 2013). For the dust opacity at 880 , we adopt cm2 g-1 (e.g., Beckwith et al., 1990).
For the dust temperature , Andrews & Williams (2005) advocated K for T Tauri disks, and Henning et al. (1994) advocated 50 K for Herbigs. Sandell et al. (2011) performed simple model fitting to the SED of a sample of Herbig disks and found 3070 K. Andrews et al. (2013) pointed out the dependence on the stellar luminosity , and suggested scaling as . Pascucci et al. (2016) suggested that the size of the dust disk should also be taken into consideration when estimating .
Here, we introduce another correction factor on based on the outer radius of the disk in submillimeter continuum observations, (Column 12 in Table LABEL:tab:herbig), as where the dust is emitting is also important — a dust ring further from the star is colder than a dust ring closer in, everything else being equal. We scale as
| (B2) |
The factor of 0.5 in is an approximate correction factor meant to identify the radius where the dust temperature is the global average. This is to account for the fact that dust at different radii has different temperature. If the surface density follows a radial profile and the disk extends from to , is the half-mass radius, i.e., the radius inside which half of the disk mass is enclosed. Equation B2 gives the specific temperature at , not , in a disk; this temperature is considered as a proxy for the average dust temperature in a disk whose outer edge is at . For unresolved submillimeter sources, we adopted the average in resolved sources: 191 AU for Herbig disks and 144 AU for T Tauri disks. This relation is calibrated against a model for HD 163296 (Facchini et al., 2017), and reproduces the midplane temperature produced by several radiative transfer models of both T Tauri and Herbig disks in the literature to within 40% (D’Alessio et al., 1998; Dullemond & Dominik, 2004; Dong, 2015; Andrews et al., 2016).
Another simple scaling for estimating the disk mass comes from the stellar accretion rate (Hartmann et al., 1998). The stellar accretion rate declines roughly as ; thus the mass remaining in the disk is . Because stellar accretion rates are time variable by a factor of 3, the mass estimate of an individual disk is uncertain by at least this factor. However, for an unbiased ensemble of disks, the mean mass of the disks is a reasonable estimate. For targets in our volume-limited Herbig IMS sample (Table LABEL:tab:herbig), we conservatively estimate to be at least 2 Myr based on the HR diagram (Figure 3).
Appendix C Accretion Rate of Herbig Stars in Table LABEL:tab:herbig
Measuring the accretion rate on to Herbig Ae/Be (HAeBe) stars is complicated by the fact that the stellar photosphere is bright at ultraviolet wavelengths. Thus the contrast between the accretion luminosity and stellar photosphere is low (e.g., Muzerolle et al., 2004). To address this challenge, several groups have calibrated the veiling of the Balmer jump against various emission line diagnostics for stars with the greatest ultraviolet contrast. In an X-Shooter survey of 91 Herbig Ae/Be stars, Fairlamb et al. (2015, 2017) have calibrated the luminosity of 32 emission lines against the accretion luminosity as inferred from the veiling of the Balmer jump.
We recalculated the accretion rates for all sources to obtain a self-consistent set of values. We adopted the accretion luminosity for our sources from the measurement of the Balmer discontinuity when this measurement was available as it is the most direct measure of stellar accretion. When the Balmer discontinuity was not available, we used the luminosity of Br or H (, ) to calculate the accretion luminosity (Fairlamb et al., 2017, Table 2):
| (C1) | |||
| (C2) |
We prioritized Br over H because it is less sensitive to corrections for both reddening and photospheric absorption.
There are two caveats to keep in mind concerning the measurement of the stellar accretion rate of HAeBes. Firstly, it is not exactly clear how HAeBes accrete. While young A/B stars do not have the convective envelopes believed to play a key role in sustaining the kG magnetic fields observed among their later type counterparts, there is some evidence of magnetospheric accretion (Guimarães et al., 2006; Cauley & Johns-Krull, 2014). If magnetospheric accretion controls the star/disk interface, it is likely through higher order field components. However, the conversion of the veiling of the Balmer discontinuity to an accretion luminosity relies on an assumption about the energy in the accretion column () and the filling factor (; Muzerolle et al. 2004). Neither is well constrained directly for HAeBes. Adopting values that reproduce the observations for T Tauris stars may not be appropriate for these higher mass analogs. Secondly, early type stars with metal poor photospheres, in particular the Boo stars, show a UV excess (Murphy & Paunzen, 2017). Folsom et al. (2012) and Kama et al. (2015) found a relatively high fraction of HAeBes in their samples (up to 50%) showing the Boo pattern to varying degrees. If this effect is common among the targets in our sample, it is possible that have been systematically overestimated. Future work to account for the uncertainty in and , as well as the effect of the photospheric abundance, will improve our understanding of the stellar accretion rate of these systems.
The luminosities collected from the literature were rescaled using the distances available from Gaia Collaboration et al. (2016) when they were available. Conversion of equivalent width measurements of the HI lines to line luminosities requires correction for the veiled equivalent width of photospheric absorption,
| (C3) |
where is the equivalent width of the emission line, is the equivalent width of the photospheric line, is the equivalent width of the circumstellar emission, and is the excess broadband emission above the stellar photosphere (Rodgers, 2001). The equivalent widths of the photospheric features were taken from Fairlamb et al. (2017) when available. For stars not included in their study, stars with matching temperatures and gravities were used to infer the photospheric equivalent width. The veiling in the K-band was determined by the dereddened color excess, . The intrinsic colors were taken from Pecaut & Mamajek (2013). For the sources where H was used, the extinction at 6563 was inferred from , =5, and the reddening law presented in Mathis (1990).
The stellar accretion rate is proportional the accretion luminosity so that,
| (C4) |
where is the stellar radius and is the stellar mass. The stellar parameters were taken from the Siess et al. (2000) pre-main sequence evolutionary tracks and tabulated in Table LABEL:tab:herbig.
Appendix D Comment on Individual Systems
Stars for which the determination of the stellar parameters were not straight forward are discussed in detail. We also comment on the scattered light imaging observations of the AB Aur and HD 100546 disks.
AB Aur
HR 811
This star was included in a survey of the SED of Herbig Ae/Be stars by Malfait et al. (1998). The SED only reveals an infrared excess longward of 20 leading them to conclude that this is a Vega-type system. Folsom et al. (2012) included this source in their survey of abundances among Herbig Ae/Be stars, noted the lack of strong optical emission lines, and found that the star had a solar abundance pattern (see also Fossati et al. 2009). We infer the luminosity for this source from the published photometry (Høg et al., 2000) adopting the distance from Gaia Collaboration et al. (2016) and arrive at = 87. This value for the luminosity places the star below the early-MS (127 ), thus we adopt the stellar mass and radius for a star of this temperature on the zero age main sequence (ZAMS).
V892 Tau
There is not parallax measurement for this heavily extinguished source, thus we adopt the average distance to Taurus (Vieira et al., 2003). We adopted the effective temperature (T K). and luminosity (=40 ) from Hernández et al. (2004), and found that the star is slightly below the ZAMS (49 ). Given the uncertainty in the distance and reddening correction, this is consistent with a location on the ZAMS, and the mass and radius we adopt for this star reflect that position.
MWC 758
To calculate the accretion rate of this source, we adopted the observed equivalent width of Br, stellar temperature, and luminosity reported in the literature (Donehew & Brittain, 2011; Beskrovnaya et al., 1999; Andrews et al., 2011, respectively). We rescaled the luminosity reported by Andrews et al. (2011) from the distance adopted in that work (200 pc) to the updated distance provided by Gaia Collaboration et al. (2016) (151 pc).
PDS 201
HD 56895
HD 97048
We adopt the effective temperature determined by Fairlamb et al. (2015) and rescale the luminosity using the distance provided by Gaia Collaboration et al. (2016). We find =36 which falls below the zero age main sequence (ZAMS) for a temperature of 10,500 K for the Siess evolutionary tracks. We assume the temperature is the more reliable parameter, so we scale the luminosity so that the star falls on the ZAMS. We adopt =2.5 and =1.8.
HIP 54557
We infer the luminosity for this source from the published photometry (Høg et al., 2000) adopting the distance from Gaia Collaboration et al. (2016) and arrive at = 20.9. This source is under luminous by a factor of two. The spectral type was taken from Houk & Cowley (1975). They assign a quality flag of 2 (one a 1-4 scale where 1 is the best). This rating indicates that “the spectra may be slightly under or over-exposed, or slightly overlapped”. It is not clear what uncertainty is appropriate for the inferred stellar temperature. To remain consistent with our other targets, we adopt the stellar mass and radius for a source on the ZAMS.
HD 100546
We adopt the effective temperature determined by Fairlamb et al. (2015) and rescale the stellar luminosity using the updated distance provided by Gaia Collaboration et al. (2016). We find =25 which falls below the ZAMS for a temperature of 9,750 K for the Siess evolutionary tracks. We assume the temperature is the more reliable parameter, so we scale the luminosity so that the star falls on the ZAMS. We adopt =2.3 and =2.6. Follette et al. (2017) showed that processing a total intensity image of a modestly inclined disk with a small number of spiral arms with Angular Differential Imaging (ADI) techniques may increase the number of arms by breaking them into pieces. The arms seen in the HD 100546 disk may be susceptible to this effect.
PDS 389
There is no parallax measurement reported for this source, so we adopt the distance used by Vieira et al. (2003) based on its cluster membership (d=175 pc). We find =9 which falls below the ZAMS (14 ) for a star with this effective temperature (8700 K). The reddening for this source is significant (B-V=1.87; Vieira et al. 2003), and uncertainty in the reddening correction likely accounts for our underestimate. We adopt the stellar mass and radius for a source on the ZAMS.
PDS 395
HD 141569
Historically, HD 141569 has been included among Herbig Ae/Be stars (e.g., The et al., 1994). It shows H I emission lines, has an extended disk in scattered light (e.g., Weinberger et al., 1999), and a MIR excess (e.g., Malfait et al., 1998). However this IR excess is with a factor of a few of Pic (Clampin et al., 2003) indicating that it may straddle the transition from gas rich accretion disk to debris disk (e.g., Mawet et al., 2017). This makes the stellar accretion rate inferred from the H emission, surprising (Mendigutía et al., 2017a). One solution to this puzzle is comes from the fact that HD 141569 is rotating near its break up velocity and the H I emission is double peaked (Brittain et al., 2007). This situation is consistent with a picture of the H I emission arising from a decretion disk rather than accretion disk. Because the dust disk around the star is optically thin, stellar radiation may sculpt the morphology of the dust leading to the observed rings and spiral structure (e.g., richert17). Thus, we exclude this star from our sample.
PDS 80
HIP 80452
We infer the stellar temperature from the reported spectral type and the luminosity from reported photometry (Høg et al., 2000). The reddening indicates that this source lies behind 1 mag of extinction. We find =16 which is 16 % below the ZAMS. This discrepancy is likely due to uncertainty in the conversion from a color excess to extinction measure. We adopt the stellar parameters for a star on the ZAMS.
IRS 48
For the effective temperature and stellar luminosity adopted for this source, we find that it falls far below the ZAMS. The extinction towards this source is quite high, (AV=11.5; Brown et al. 2012), so the uncertainty in the extinction correction dominates the uncertainty in the stellar luminosity. We assume the the effective temperature is correct and adopt the stellar mass and radius that places this star on the ZAMS.
HIP 81474
51 Oph
We infer the luminosity for this source from the published photometry (Ducati, 2002) adopting the distance from Gaia Collaboration et al. (2016) and arrive at = 147.9. 51 Oph is a rapidly rotating A0 star (Jamialahmadi et al., 2015) with a minimal FIR excess (Thi et al., 2013). It is not clear whether this small excess is due to a very flat and thus cold disk or a very compact ( au disk; Thi et al. 2013). Interferometric observations of 51 Oph indicate that the photosphere is highly flattened due to the large rotational velocity of the star and that H arises from a geometrically thin Keplerian disk. As it is possible that this star is a post-Main Sequence object with a decretion disk rather than accretion disk, we exclude it from our sample.
HD 163296
HD 169142
The spectral type designation of this source has ranged from B9-mid-F in the literature. This is a face-on star rotating near its break-up velocity (Grady et al. 2007) resulting in a significant deformation of the star and resultant temperature gradient from the stellar pole to the equatorial region of the star. As part of their study of Boo stars, Murphy & Paunzen (2017) find T=6700322 K and log /=0.780.03. We adopt these values to estimate the stellar mass and radius from the Siess et al. (2000) evolutionary tracks.
TY CrA
This is a heavily extinguished B9 star (AV=1.9-3.0; Ducati 2002). The star falls 14% below the ZAMS which can be accounted for by uncertainty in the reddening correction. We adopt the stellar parameters for a star of this temperature on the ZAMS.
T CrA
There is no parallax measurement of this source, so we adopt the distance to this star forming region (130 pc; Vieira et al. 2003). The spectral type is adopted from The et al. (1994). The uncertainty in the spectral type and luminosity is uncertain. Additionally, the proper reddening correction is uncertain. The star is highly variable, thus we select the photometry for which the B and V were acquired contemporaneously (Zacharias et al., 2012) and arrive at B-V=0.975. For a spectral type of F0, this implies E(B-V)=0.66. The extinction ranges from 2.1 - 3.3 for =3.1-5.0. For a temperature of 7200 K, the stellar luminosity is underestimated by a factor of 4. The origin of this discrepancy is unclear, though it is likely due to underestimating the extinction to the source. We adopt the stellar parameters for this star assuming that it falls on the ZAMS.
Appendix E Coordinates of Sources
| # | Object | RA | Dec |
|---|---|---|---|
| 1 | HR811 | 02 44 07.35 | -13 51 31.31 |
| … | LkH 330 | 03 45 48.28 | +32 24 11.87 |
| … | FN Tau | 04 14 14.59 | +28 27 58.06 |
| 2 | V892 Tau | 04 18 40.62 | +28 19 15.51 |
| … | RY Tau | 04 21 57.41 | +28 26 35.54 |
| … | UX Tau | 04 30 04.00 | +18 13 49.44 |
| … | LkCa 15 | 04 39 17.80 | +22 21 03.48 |
| … | GM Aur | 04 55 10.98 | +30 21 59.54 |
| 3 | AB Aur | 04 55 45.85 | +30 33 04.29 |
| … | SU Aur | 04 55 59.39 | +30 34 01.50 |
| 4 | MWC 480 | 04 58 46.27 | +29 50 36.99 |
| 5 | PDS 178 | 05 24 01.17 | +24 57 37.58 |
| 6 | MWC 758 | 05 30 27.53 | +25 19 57.08 |
| 7 | CQ Tau | 05 35 58.47 | +24 44 54.09 |
| … | V1247 Ori | 05 38 05.25 | -01 15 21.70 |
| 8 | PDS 201 | 05 44 18.79 | +00 08 40.40 |
| 9 | HD 56895 | 07 18 31.79 | -11 11 34.94 |
| … | TW Hya | 11 01 51.91 | -34 42 17.03 |
| 10 | HD 97048 | 11 08 03.31 | -77 39 17.49 |
| 11 | HIP 54557 | 11 09 50.02 | -76 36 47.72 |
| 12 | HD 100453 | 11 33 05.58 | -54 19 28.55 |
| 13 | HD 100546 | 11 33 25.44 | -70 11 41.24 |
| … | DZ Cha | 11 49 31.84 | -78 51 01 1 |
| 14 | HD 104237 | 12 00 05.09 | -78 11 34.57 |
| 15 | PDS 141 | 12 53 17.22 | -77 07 10.61 |
| … | PDS 66 | 13 22 07.54 | -69 38 12.22 |
| … | PDS 70 | 14 08 10.15 | -41 23 52.5 |
| 16 | PDS 389 | 15 14 47.05 | -62 16 59.73 |
| 17 | SAO 206462 | 15 15 48.45 | -37 09 16.04 |
| 18 | PDS 395 | 15 40 46.38 | -42 29 53.54 |
| 19 | HD 141569 | 15 49 57.75 | -03 55 16.34 |
| … | IM Lupi | 15 56 09.18 | -37 56 06.12 |
| 20 | PDS 76 | 15 56 40.02 | -22 01 40.00 |
| 21 | HD 142527 A | 15 56 41.89 | -42 19 23.27 |
| … | J1604-2130 | 16 04 21.66 | -21 30 28.4 |
| 22 | PDS 78 | 16 06 57.95 | -27 43 09.79 |
| … | Sz 91 | 16 07 11.59 | -39 03 47.54 |
| 23 | HR 5999 | 16 08 34.29 | -39 06 18.33 |
| 24 | PDS 80 | 16 13 11.59 | -22 29 06.62 |
| … | RX J1615.3-3255 | 16 15 20.23 | -32 55 05.10 |
| 25 | HIP 80425 | 16 24 59.15 | -25 21 17.98 |
| … | DoAr 28 | 16 26 47.42 | -23 14 52.2 |
| … | SR 21 | 16 27 10.28 | -24 19 12.74 |
| 26 | IRS 48 | 16 27 37.19 | -24 30 35.03 |
| 27 | WLY 1-53 | 16 27 49.87 | -24 25 40.2 |
| 28 | HD 148352 | 16 28 25.16 | -24 45 01.00 |
| 29 | HIP 81474 | 16 38 28.65 | -18 13 13.71 |
| 30 | MWC 863 | 16 40 17.92 | -23 53 45.18 |
| 31 | AK Sco | 16 54 44.85 | -36 53 18.56 |
| 32 | 51 Oph | 17 31 24.95 | -23 57 45.51 |
| 33 | HD 163296 | 17 56 21.29 | -21 57 21.87 |
| … | V4046 Sgr | 18 14 10.47 | -32 47 34.50 |
| 34 | HD 169142 | 18 24 29.78 | -29 46 49.33 |
| 35 | TY CrA | 19 01 40.83 | -36 52 33.88 |
| 36 | T CrA | 19 01 58.79 | -36 57 49.93 |