Impact of the Galactic Disk and Large Magellanic Cloud on the Trajectories of Hypervelocity Stars Ejected from the Galactic Center
Abstract
We consider how the gravity of the Galactic disk and the Large Magellanic Cloud (LMC) modifies the radial motions of hypervelocity stars (HVSs) ejected from the Galactic Center. For typical HVSs ejected towards low (high) Galactic latitudes, the disk bends trajectories by up to 30∘ (3∘ to 10∘). For many lines-of-sight through the Galaxy, the LMC produces similar and sometimes larger deflections. Bound HVSs suffer larger deflections than unbound HVSs. Gravitational focusing by the LMC also generates a factor of two overdensity along the line-of-sight towards the LMC. With large enough samples, observations can detect the non-radial orbits and the overdensity of HVSs towards the LMC. For any Galactic potential model, the Galactic rest-frame tangential velocity provides an excellent way to detect unbound and nearly bound HVSs within 10 kpc of the Sun. Similarly, the rest-frame radial velocity isolates unbound HVSs beyond 10–15 kpc from the Sun. Among samples of unbound HVSs, measurements of the radial and tangential velocity serve to distinguish Galactic Center ejections from other types of high velocity stars.
1 INTRODUCTION
Over the past decade, observations have revealed stars with space velocities sufficient to escape the Galaxy (Brown et al., 2005; Edelmann et al., 2005; Hirsch et al., 2005; Brown et al., 2006a, b, 2007; Kollmeier & Gould, 2007; Heber et al., 2008; Kollmeier et al., 2009; Tillich et al., 2009; Brown et al., 2009; Irrgang et al., 2010; Li et al., 2012; Brown et al., 2012; Pereira et al., 2012; Brown et al., 2014; Zheng et al., 2014; Zhong et al., 2014; Hawkins et al., 2015; Brown et al., 2015; Brown, 2015; Geier et al., 2015; Li et al., 2015; Vickers et al., 2015; Ziegerer et al., 2015; Favia et al., 2015; Zhang et al., 2016; Ziegerer et al., 2017; Lennon et al., 2017; Huang et al., 2017; Marchetti et al., 2018b; Hattori et al., 2018a; Shen et al., 2018; Raddi et al., 2018; Hawkins & Wyse, 2018; Li et al., 2018). Many are apparently normal main sequence stars; some are hot subdwarfs or white dwarfs. In the simplest examples, the radial velocity exceeds the local escape velocity. For other stars, a combination of radial velocity and proper motion provides evidence for a high total velocity.
Currently popular ejection mechanisms for these stars include (i) tidal disruption of a binary by the supermassive black hole (SMBH) in the Galactic Center or ejection of a single star by a black hole binary somewhere in the Galaxy (e.g., Hills, 1988; Yu & Tremaine, 2003; Baumgardt et al., 2006; Bromley et al., 2006; Kenyon et al., 2008; Perets, 2009; Zhang et al., 2010; Bromley et al., 2012; Zhang et al., 2013; Dremova et al., 2014; Kenyon et al., 2014; Rossi et al., 2017; Marchetti et al., 2018a; Wang et al., 2018), (ii) close interactions among massive stars in a dense star cluster (e.g., Poveda et al., 1967; Leonard, 1991; Bromley et al., 2009; Pflamm-Altenburg & Kroupa, 2010; Perets & Subr, 2012; Kenyon et al., 2014; Tauris, 2015; Ryu et al., 2017), and (iii) ejection of the low mass companion in a close binary during the supernova explosion of a massive primary star (e.g., Blaauw, 1961; De Donder et al., 1997; Portegies Zwart, 2000; Bromley et al., 2009; Wang & Han, 2009; Pflamm-Altenburg & Kroupa, 2010; Eldridge et al., 2011; Napiwotzki & Silva, 2012; Kenyon et al., 2014; Geier et al., 2015; Tauris, 2015; Renzo et al., 2018). Disrupted dwarf galaxies (Abadi et al., 2009), interacting galaxies (Piffl et al., 2014), and star clusters disrupted by an SMBH (Capuzzo-Dolcetta & Fragione, 2015; Fragione & Capuzzo-Dolcetta, 2016) may also contribute to the population of high velocity stars.
Aside from serving as possible probes of the mass and 3D gravitational potential of the Milky Way (MW; e.g., Gnedin et al., 2005; Bromley et al., 2006; Yu & Madau, 2007; Kenyon et al., 2008; Brown et al., 2010; Gnedin et al., 2010; Rossi et al., 2017; Fragione & Loeb, 2017), high velocity stars in the Galactic halo can also constrain the physical properties of the LMC and other local group galaxies (e.g., Laporte et al., 2017, 2018). As one example, Boubert & Evans (2016) and Boubert et al. (2017) demonstrate that high velocity stars ejected from the LMC might contribute to the population of high velocity stars observed in the thick disk and the halo of the Milky Way.
Here, we consider the impact of the gravitational potentials of the Galactic disk and the LMC on the space distribution of 3 hypervelocity stars (HVSs) ejected from the Galactic Center (GC). For HVSs with small ejection angles relative to the Galactic midplane ( 30∘), the gravity of the disk bends trajectories by up to 30∘ with respect to a purely radial trajectory. Bound HVSs suffer larger deflections than unbound HVSs. When HVSs are ejected towards the Galactic pole, they maintain somewhat more radial trajectories. Aside from generating similar deflections, the gravity of the LMC produces a factor of two overdensity of ejected stars along the line-of-sight towards the LMC.
With large enough samples, the non-radial orbits and the overdensity of ejected stars along specific lines-of-sight through the Galaxy are observable. In particular, the Galactic rest-frame tangential velocity provides an excellent way to detect unbound and nearly bound stars within 10 kpc of the Sun. Similarly, the rest-frame radial velocity isolates unbound stars at larger distances.
We begin with a discussion of the theoretical background (§2) and numerical procedures (§3). After describing results quantifying the changing trajectories of HVSs (§4), we develop several observational diagnostics for the shape of the potential (§5), identify robust tools to isolate unbound HVSs from other high velocity stars (§6), and discuss the implications of the analysis for future Galactic surveys (§7). We conclude with a brief summary (8).
2 BACKGROUND
When a binary system crosses the tidal radius of an SMBH, it becomes unbound (Hills, 1988). One component takes up an eccentric orbit around the SMBH; to conserve energy, the other is ejected at high velocity (see also Gould & Quillen, 2003; Gualandris et al., 2005; Ginsburg & Loeb, 2006; Sari et al., 2010). Hills suggested calling the ejecta HVSs. For HVSs that escape the SMBH, the ejection velocity depends on the physical properties of the binary and the SMBH and the distance of closest approach (e.g., Hills, 1988; Gould & Quillen, 2003; Gualandris et al., 2005; Bromley et al., 2006; Ginsburg & Loeb, 2006; Sari et al., 2010). If the source of binaries is isotropic, the outward flow of HVSs is also isotropic (Bromley et al., 2006; Kenyon et al., 2008, 2014; Rossi et al., 2014, 2017). An anisotropic source of binaries or a BH binary companion to the SMBH generate anisotropies in the outflow (Yu & Tremaine, 2003; Levin, 2006; Sesana et al., 2006; Lu et al., 2007; Sesana et al., 2007; O’Leary & Loeb, 2008; Perets, 2009; Sesana et al., 2009; Lu et al., 2010; Zubovas et al., 2013; Subr & Haas, 2016; Coughlin et al., 2018).
After HVSs travel a distance 10–20 pc, the potential of the Galactic bulge acts as a high pass filter which prevents lower velocity stars from reaching the Galactic halo at distances 20 kpc from the GC (Kenyon et al., 2008, 2014). For a standard Galactic potential model (see below), HVSs that reach 10–100 kpc require minimum ejection velocities 800–925 . Many of these ejected stars remain bound to the Galaxy (Bromley et al., 2006; Kenyon et al., 2008). Unbound HVSs require 925 (Kenyon et al., 2008).
When the Galactic potential is limited to a spherical bulge and a spherical halo, the radial distribution of HVSs about the GC is spherically symmetric (Bromley et al., 2006; Yu & Madau, 2007; Kenyon et al., 2008, 2014; Rossi et al., 2014, 2017). The purely radial trajectories of HVSs then provide a unique way to distinguish them from bulge, disk, and halo stars on more circular orbits around the GC (see also Hattori et al., 2018b). Introducing a plausible amount of structure in the potential (e.g., a binary SMBH, mis-aligned circumnuclear disks in the GC, the Galactic bar, the Galactic disk, or a triaxial bulge or halo) eliminates spherical symmetry and may create observable asymmetries in the 3D distribution of HVSs (Gnedin et al., 2005; Sesana et al., 2006; Yu & Madau, 2007; Sesana et al., 2009; Subr & Haas, 2016; Fragione et al., 2017; Hamers & Perets, 2017).
With a mass of roughly 10% of the mass of the Galaxy, the LMC changes the trajectories of HVSs. Consider a single HVS ejected from the GC toward a fixed LMC located at = 50 kpc. When the HVS has 35 kpc, the gravitational acceleration on the star from the LMC is roughly half the acceleration due to the Galaxy. Compared to a system with no LMC, this HVS decelerates more slowly relative to the GC, maintains a higher radial velocity, and travels farther out into the Galaxy. Compared to a Galaxy with no LMC, a Galaxy with the LMC then has fewer HVSs at 30–50 kpc. If a star passes through the LMC and is at 65 kpc, the radial acceleration from the LMC is comparable to the radial acceleration from the Galaxy. This extra deceleration causes an enhancement in the population of HVSs at 60–100 kpc relative to a Galaxy with no LMC.
HVSs ejected away from the LMC feel the extra acceleration from the LMC throughout their journey through the Galaxy. Per unit time, these stars must then reach smaller distances from the GC than their counterparts ejected towards the LMC. The overall population of HVSs then has a larger space density away from the LMC than towards the LMC. Our goal is to learn whether the variation in HVS space density throughout the Galaxy is detectable with current observational tools.
Despite its somewhat lower mass, the Galactic disk can also bend the trajectories of stars ejected from the GC (Gnedin et al., 2005; Yu & Madau, 2007). Stars flowing radially outward at low Galactic latitude feel a larger acceleration from the disk than those at higher latitudes. Thus, HVSs at lower latitudes have a larger non-radial component of their motion than HVSs at higher latitudes. Numerical simulations of the space motions of HVSs will allow us to predict the non-radial motions of HVSs as a function of initial ejection velocity and Galactic latitude.
3 NUMERICAL CALCULATIONS
To explore the space motions of HVSs in a combined MW+LMC potential, we consider a set of numerical calculations. As in previous papers (Bromley et al., 2006; Kenyon et al., 2008; Bromley et al., 2009; Kenyon et al., 2014), we follow the dynamical evolution of an ensemble of HVSs throughout their main sequence lifetimes. Snapshots yield predictions for the 3D distributions of space density, proper motion, and radial velocity. With typical 100–500 Myr travel times through the Galaxy, finite stellar lifetimes produce measurable differences in these observables for stars with a range of masses.
For stars with main sequence lifetime , we generate initial position and velocity vectors, an ejection time , and an observation time , with . For a flight time , we integrate the orbit of each star in the MW+LMC potential and record the final position and velocity vectors at . For an adopted position and velocity for the Sun, we derive a catalog of predicted observables (distance), (radial velocity), (tangential velocity), (proper motion in Galactic longitude), and (proper motion in Galactic latitude).
3.1 Gravitational Potential of the Milky Way
As in Kenyon et al. (2014), we work in coordinate systems with an origin at the Galactic Center (see Table 1). Stars have cartesian positions and velocities . The distance from the GC to the star is ; the space velocity of the star relative to the GC is . The angle of the position vector of the star relative to the axis is (the GC longitude); the angle relative to the – plane is (the GC latitude). With , we also specify stellar positions and velocities in spherical or cylindrical systems.
To measure dynamical properties in heliocentric coordinates, we adopt a cartesian position and velocity for the Sun, where = 8 kpc is the distance of the Sun from the GC (e.g., Bovy et al., 2012) and = 235 is the space velocity of the Sun relative to the GC (e.g., Hogg et al., 2005; Bovy et al., 2012; Reid et al., 2014; Reid & Dame, 2016; Russeil et al., 2017). Stars have distances and relative velocities . The galactic longitude of the star is the angle – measured counter-clockwise in the plane – from a line connecting the Sun to the GC, . The galactic latitude measures the height of the star above the galactic plane, . For , and .
In this heliocentric system, the radial velocity of an HVS is:
| (1) |
The tangential velocity follows from the relative velocity, . In the GC frame, the radial velocity is
| (2) |
The tangential velocity is then . For our discussion, we consider velocities in the GC frame. In an observational program, requires accurate measurements of both the proper motion and distance.
We adopt a three component model for the Galactic potential (Kenyon et al., 2008, 2014) with parameters listed in Table 2:
| (3) |
where
| (4) |
is the potential of the bulge,
| (5) |
is the potential of the disk, and
| (6) |
is the potential of the halo (e.g., Hernquist, 1990; Miyamoto & Nagai, 1975; Navarro et al., 1997).
For the bulge and halo, we set , , = 105 pc, and = 20 kpc (Table 2). These parameters match measurements of the mass and velocity dispersion inside 1 kpc and outside 50 kpc (see §2.2 of Kenyon et al., 2008, 2014) and are consistent with various independent measures of the mass of the Galaxy (e.g., Watkins et al., 2010; Gnedin et al., 2010; Boylan-Kolchin et al., 2013; Piffl et al., 2014; Peñarrubia et al., 2016; McMillan, 2017; Patel et al., 2017b, 2018; Gaia Collaboration et al., 2018; Watkins et al., 2018; Posti & Helmi, 2018; Monari et al., 2018).
In some applications, the potential of the halo is expressed in terms of the virial mass and the concentration parameter (e.g., Navarro et al., 1997; Zentner & Bullock, 2003; Gómez et al., 2015; Bullock & Boylan-Kolchin, 2017, and references therein). For a virial radius , . Specifying and is then equivalent to setting and . Mass models for the Milky Way typically have 10–15 (e.g., Dehnen et al., 2006; Boylan-Kolchin et al., 2013; Patel et al., 2017a; Monari et al., 2018), yielding .
To match the adopted 235 circular velocity of the Sun, we adopt parameters for the disk potential: , = 2750 pc, and = 300 pc. The complete set of parameters for the bulge, disk, and halo yields a flat rotation curve from 3–50 kpc.
Although the formal escape velocity for the halo is unbounded, we adopt a convenient definition based on the outward velocity required for a star to reach = 250 kpc with zero velocity. To place this reference point in context, a halo potential with a concentration parameter = 12.5 has a virial radius = 250 kpc for the adopted = 20 kpc. We derive numerically by tracking the position and speed of particles dropped into the MW from rest at = 250 kpc. For the adopted MW potential, the escape velocity in the plane is roughly 1 larger than the escape velocity along the -axis. We ignore this difference.
Following Gómez et al. (2015), we assume a spherical potential for the LMC:
| (7) |
where , = 15 kpc, and is the distance from the center of the LMC. The adopted mass and scale length are roughly in the middle of the range measured/proposed in the literature (e.g., van der Marel et al., 2002; Gómez et al., 2015; Peñarrubia et al., 2016; Patel et al., 2017b). Viewed from the Galactic Center, the LMC scale length subtends an angle 167 at a distance = 50 kpc.
Adding in the central SMBH, the total potential is
| (8) |
where is the mass of the central black hole. Although 10% to 20% lower than current best values (e.g., Boehle et al., 2016; Gillessen et al., 2017; Eckart et al., 2017), this value maintains consistency with previous studies (Bromley et al., 2006; Kenyon et al., 2008, 2014). Adopting a larger value has little impact on the results.
With our adopted and , the total acceleration from the Galaxy always dominates the acceleration from the LMC. Thus, there is no equivalent to a ‘Hill sphere,’ a volume where the gravity of the LMC overcomes the gravity of the MW111Equivalently, a particle with velocity = 0 placed at = 0 falls into the GC after 9.8 Gyr. Increasing or reducing allows the LMC to have a region where its gravity dominates.. For stars ejected at an angle relative to the line-of-centers, however, the LMC produces an acceleration tangential to the velocity vector. When = 50 kpc, 0∘ 25∘, and 35–65 kpc, the LMC acceleration is a significant fraction of the deceleration from the MW. In this regime, trajectories are gravitationally focused and bend around the LMC. In §4.2, we quantify this gravitational focusing.
When stars pass ‘through’ the LMC, we ignore the possibility that ejected stars collide with gas or stars within the LMC. The trajectories of HVSs follow paths dictated solely by the potential of the MW and the potential of the LMC.
3.2 Initial Conditions
To select and for HVSs, we rely on published calculations. In our approach, a single SMBH at the Galactic Center disrupts close binary systems with semimajor axes between and (Hills, 1988; Kenyon et al., 2008; Sari et al., 2010; Rossi et al., 2014). Our choice of the minimum semimajor axis minimizes the probability of a collision between the two binary components during the encounter with the black hole (Ginsburg & Loeb, 2007; Kenyon et al., 2008). Setting the maximum semimajor axis 4 AU limits the number of low velocity ejections which cannot travel more than 10–100 pc from the Galactic Center. To select stars capable of reaching 10 kpc from the GC, we also set a minimum ejection velocity = 750 (Kenyon et al., 2008). Choosing smaller and larger precludes moderate velocity ejections that barely reach the Galactic halo and remain bound to the Galaxy.
These choices for and are consistent with expectations for ensembles of close binaries within 1–2 pc of the SMBH. For the selection procedure outlined below, results with = 750 and a somewhat smaller between 0.6 AU and 4 AU are fairly similar to those with = 750 and = 4 AU. In the dense stellar system within a few pc of the GC (e.g., Tremaine et al., 2002; Genzel et al., 2003), binaries with equal mass components and = 0.6 AU (4 AU) evaporate in roughly 2 Gyr (250 Myr) (Perets, 2009). Defining where is the mass of the binary and is the stellar velocity dispersion, Fragione & Sari (2018) divide binaries into ‘soft’ () and ‘hard’ (). For the measured 60 at a distance of 1–2 pc from the GC (Tremaine et al., 2002), . As implied by the calculations of Perets (2009), the adopted upper limit on coupled with the lower limit on is consistent with binaries that are hard enough to survive for up to 1 Gyr in the vicinity of the GC.
Numerical simulations of binary encounters with a single black hole demonstrate that the probability of an ejection velocity is a gaussian,
| (9) |
where the average ejection velocity is
| (10) |
and 0.2 (Bromley et al., 2006). Here () is the mass of the primary (secondary) star and is the mass of the central black hole. The normalization factor depends on , the distance of closest approach to the black hole:
| (11) | |||||
where
| (12) |
and
| (13) |
This factor also sets the probability for an ejection, :
| (14) |
for . For , ; the binary does not get close enough to the black hole for an ejection and .
To establish initial conditions, we select each HVS from a random distribution of , , and . The binaries have semimajor axes uniformly distributed in log (e.g., Abt, 1983; Duquennoy & Mayor, 1991; Heacox, 1998; Ducati et al., 2011; dos Santos et al., 2017). For binaries with = , the maximum distance of closest approach is . We adopt a minimum distance of closest approach = 1 AU. Within this range, the probability of any grows linearly with . Choosing two random deviates thus yields and ; , , and follow from eqs. (10–14). Selecting a third random deviate from a gaussian distribution yields the ejection velocity. Two additional random deviates drawn from a uniform distribution spanning the main sequence lifetime of the star fix and . To see whether this combination of parameters results in an ejection, we select a sixth random deviate, . When , , and , the star is ejected from the GC. Otherwise, we select new random numbers. We place each ejected star at a random location on a sphere with a radius of 1.4 pc centered on the Galactic Center and assign velocity components appropriate for a radial trajectory from the Galactic Center. These stars have initial Galactic longitude , Galactic latitude , GC longitude , and GC latitude .
3.3 Numerical Technique
To integrate the motion of each ejected star through the MW+LMC potential, we use an adaptive fourth-order integrator with Richardson extrapolation (e.g., Press et al., 1992; Bromley & Kenyon, 2006; Bromley et al., 2009). Starting from an initial position with velocity , the code integrates the full three-dimensional orbit through the Galaxy, allowing us to track position and velocity as a function of time. We integrate the orbit for a time , smaller than the main sequence lifetime of the ejected star. This procedure allows us to integrate millions of orbits fairly rapidly. Several tests demonstrate that our approach yields typical errors of 0.01% in position and velocity after 1–10 Gyr of evolution. At , stars have positions , equivalently or , and velocities .
To enable comparisons with other studies, we quote results for several simple calculations (Table 3). In these tests, massless particles released at rest fall toward the GC from several locations along the -axis (HVx models) or the -axis (HVz models). The Table lists the time to reach several distances between the starting point and the GC. Time scales to fall in along the -axis are 0.5–1.5 yr shorter than those along the -axis. Velocities at = 1 pc and = 100 kpc are independent of the initial position. At 8 kpc, the velocity of particles falling through the disk is somewhat larger than for infall perpendicular to the disk. At the 1 level, velocities from the numerical calculations agree with the analytic result , where is the gravitational potential at = and is the potential at . Calculations with these starting velocities at 1 pc (or 1 pc) achieve the appropriate maximum distance from the GC on the listed infall time scales.
4 RESULTS: HVS TRAJECTORIES
4.1 The Galactic Disk
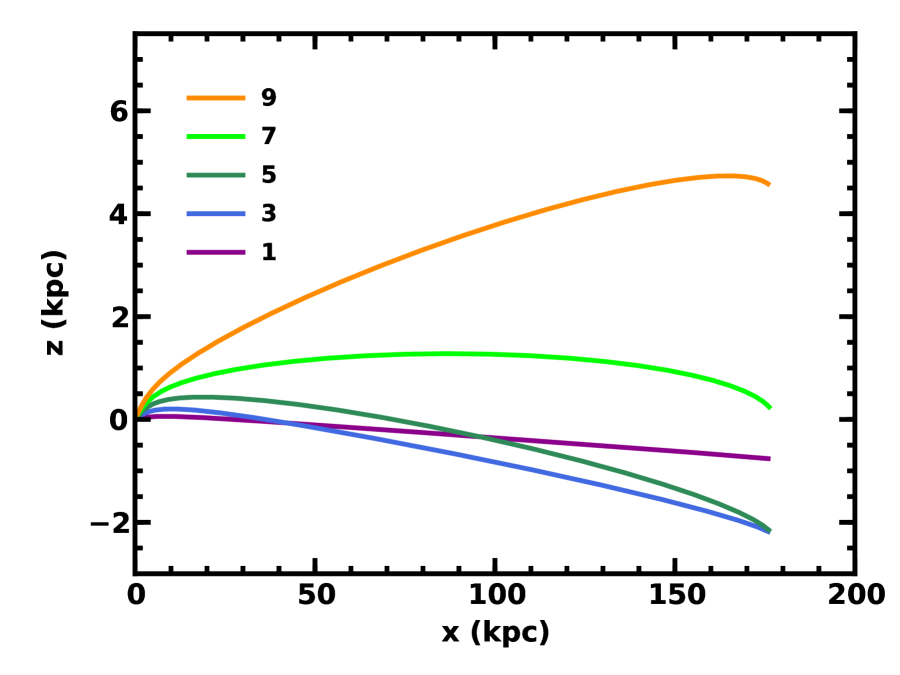
To illustrate the deflection of HVS trajectories by the Galactic disk, we consider stars with = 900 traveling in the plane for = 1 Gyr (for other examples, see Gnedin et al., 2005; Yu & Madau, 2007). When the initial angle relative to the plane is = 1∘, stars reach a maximum height above the -axis of 60 pc at 8400 pc ( 13 Myr). Acceleration from the disk then pulls the star through the midplane ( = 0) at 52–53 Myr when 27–28 kpc. Although is then only 2 , the disk potential is too weak to pull the star back towards the disk (see Fig. 1 of Kenyon et al., 2008). The star continues to move farther below the disk midplane, reaching pc ( 025) when 175 kpc and 1 Gyr.
Stars ejected at somewhat larger angles end up farther below the disk midplane after 1 Gyr (Fig. 1, blue and green curves). When 3∘–5∘, stars feel a larger gravitational force from the disk. Despite their larger initial , stars with larger decelerate more rapidly and have as they pass through the midplane. After 1 Gyr, these stars almost reach the halo, pc ( 065).
As the initial angle of ejection grows, it is harder and harder for the disk to pull the star across the disk midplane (Fig. 1, lime and orange curves). In these examples, the initial is too large for the disk gravity to overcome completely. Although the stars reach a peak distance and then begin to fall back toward the disk, they remain above the midplane at = 1 Gyr.
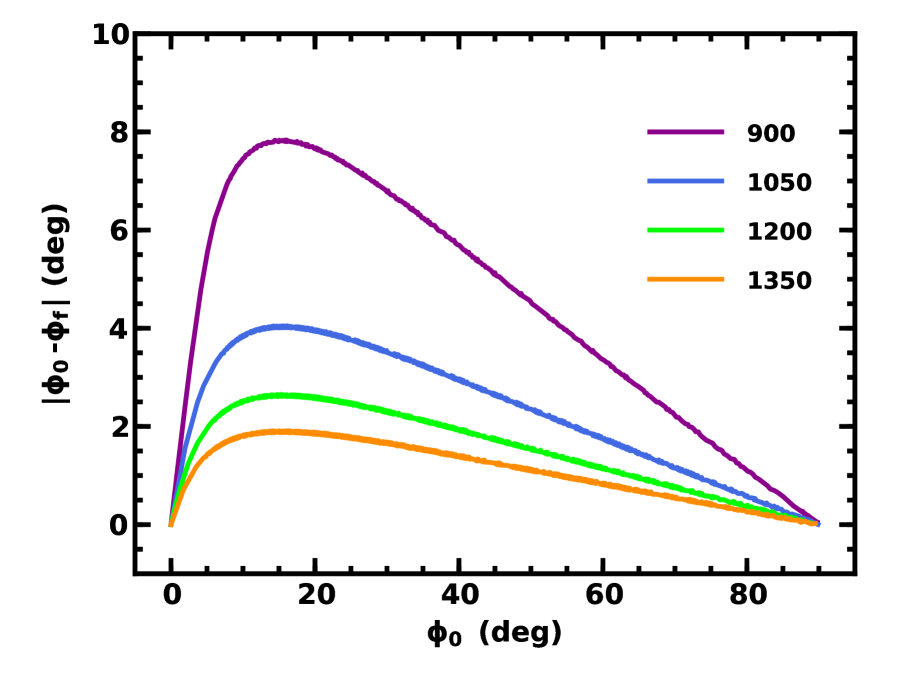
Among all HVSs, larger ejection velocities lead to smaller deflections (Fig. 2). When = 900 and = 600 Myr (purple curve), the difference between the initial and final values for the GC latitude, , grows from zero at = 0∘ to nearly 8∘ at 15∘. Although the deflection then decreases at larger , it is still significant – roughly 1∘ – for ejections towards the Galactic pole ( 89∘). For stars with larger , the maximum deflection decreases to roughly 4∘ for = 1050 . It is 25 for = 1200 and 19 for = 1350 . Despite the variation in the maximum deflection with initial velocity , the form of the – relation is independent of , with the peak deflection always at 15∘.
The magnitude of the deflection is sensitive to the disk parameters, , , and . For modest changes in , the maximum scales approximately with disk mass. Larger (smaller) disk masses result in larger (smaller) deflections, with no shift in the for maximum deflection. The two scale factors – and – control the amplitude and shape of the – curve. Smaller (larger) and enable larger (smaller) . Larger () shifts the maximum to smaller (larger) .
For fixed , it is easier to generate larger deflections with modest changes in and than it is to produce smaller deflections. With , for example, setting = 2250 pc (3250 pc) results in a maximum deflection of 10∘ (7∘) instead of the 8∘ for our nominal = 2750 pc. Similarly, adopting = 450 pc (150 pc) yields a maximum 7∘ (10∘) instead of 8∘ for = 300 pc.
Systematic deflection of HVS trajectories by the disk has a clear observational consequence. Without deflection, the fraction of all HVSs detected in a survey is proportional to the sky coverage; e.g., surveying 50% of the sky should yield 50% of all HVSs. Because HVSs with somewhat larger than 30∘ end up with somewhat smaller than 30∘, deflection reduces the ability of halo surveys to recover HVSs. This reduction depends on the initial ejection velocity. In these examples, the fraction of stars with 30∘ ranges from 54% for = 1200 to 57% for = 1050 to 60% for = 900 . The impact for unbound HVSs with 925–950 is smaller than for bound HVSs with 900–925 .
To explore these issues in more detail, we consider intermediate mass stars (3 , B spectral type, = 350 Myr) with random ejection parameters as outlined in §3.2. The sample includes bound stars which barely make it out of the bulge and unbound stars ejected from the Galaxy. Aside from the larger lower velocity limit, = 750 instead of = 600 , this set of calculations is identical to those in Kenyon et al. (2014). Outcomes are also similar. Although the higher minimum precludes bound stars with maximum = 1–8 kpc, statistics for stars with 10 kpc are nearly identical to those in Kenyon et al. (2014).
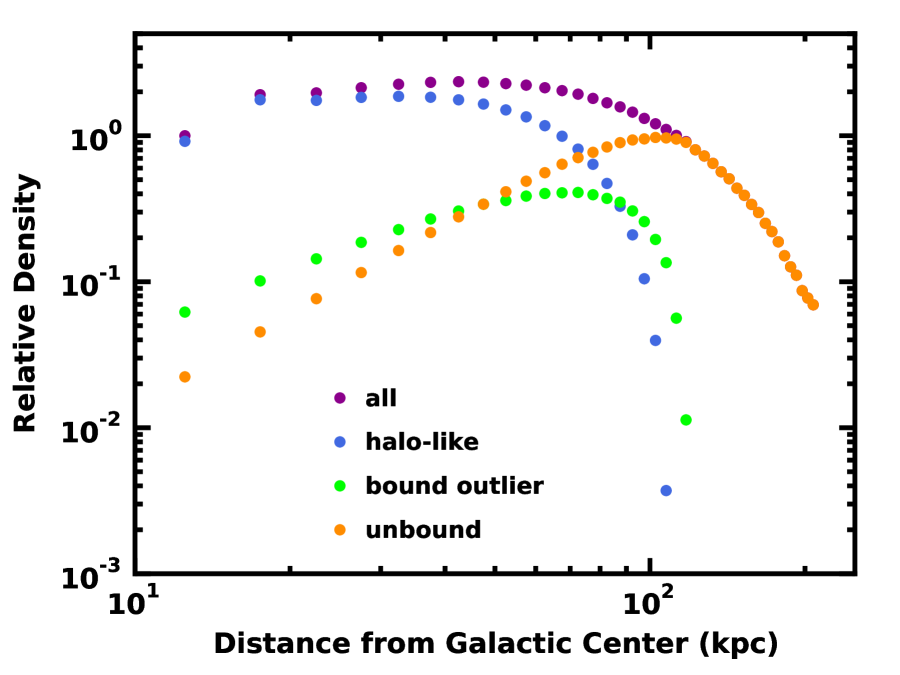
To establish the importance of bound and unbound stars in this sample, we derive the variation of the space density with distance from the GC (see also Bromley et al., 2006). For a set of radial bins, , we define a space density, , where is the number of stars in a bin extending from to . Setting = 5 kpc yields a reasonable number of stars per bin. Within the full sample, ‘halo-like’ stars have a space velocity smaller than 75% of the local escape velocity ; ‘bound outliers’ have . ‘Unbound’ stars have velocities relative to the GC that exceed the local escape velocity. Table 4 summarizes the fraction of these three types of stars as a function of .
Our choice for the boundary between halo-like stars and bound outliers is motivated by radial velocity surveys of the halo (e.g., Battaglia et al., 2005; Smith et al., 2007; Brown et al., 2008; Xue et al., 2008; Brown et al., 2010; Kafle et al., 2012; Brown et al., 2014; Loebman et al., 2014; King et al., 2015; Cohen et al., 2017). Within these surveys, the radial velocity distribution consists of a gaussian component and a small set of outliers. The outliers have velocities roughly 2–3 times larger than the half-width of the gaussian component. For typical surveys, unambiguous outliers have velocities exceeding roughly 75% of the local escape velocity.
At 70 kpc, bound stars dominate the population (Fig. 3). Nearly all of the bound stars have 0.75; these stars have positions and velocities similar to those of the indigenous population in the Galactic halo (e.g., Brown et al., 2006a, b, 2007; Kenyon et al., 2014). Roughly 20% have space velocities large enough ( 0.75) to be identified as outliers in a halo radial velocity survey but they are still bound to the Galaxy. Only a small fraction of the ejected stars at these distances (2% at 10–20 kpc, 6% at 20–40 kpc, and 21% at 40–80 kpc; Table 4) are unbound.
The variation of with for the bound stars depends on the stellar lifetime and the initial ejection velocity from the GC (Bromley et al., 2006; Kenyon et al., 2008, 2014). Bound HVSs ejected with = 900 take 100 Myr to reach = 45 kpc and another 100 Myr to approach = 77 kpc. In an ensemble of HVSs ejected from the GC at random times, a 100 Myr travel time is a modest fraction of the main sequence lifetime, = 350 Myr. Nearly all bound HVSs can travel to 50 kpc; the density is then roughly constant with . Beyond 50 kpc, the travel time becomes a larger and larger fraction of ; the density then begins to drop because the stars die. For HVSs ejected with = 900 as zero-age main sequence stars, the maximum distance from the Galactic Center is roughly 110 kpc. At this point, the density of bound stars is zero.
When 80 kpc ( 125 kpc), most (all) stars are unbound. Unbound stars ejected at high velocities, 1100 , reach 100 kpc (125 kpc) on time scales, 100 Myr (175 Myr). On these time scales, it is fairly easy for a B-type main sequence star to travel 100–110 kpc from the Galactic Center; however, it is much more challenging to reach distances much beyond 150 kpc. Thus, the density gradually rises until 100–120 kpc and then begins to fall due to the finite stellar lifetime. Although stars ejected at the largest velocities, 1500 , are still on the main sequence at 200–300 kpc, these stars are rare. At these distances, the density of B-type HVSs is negligible.
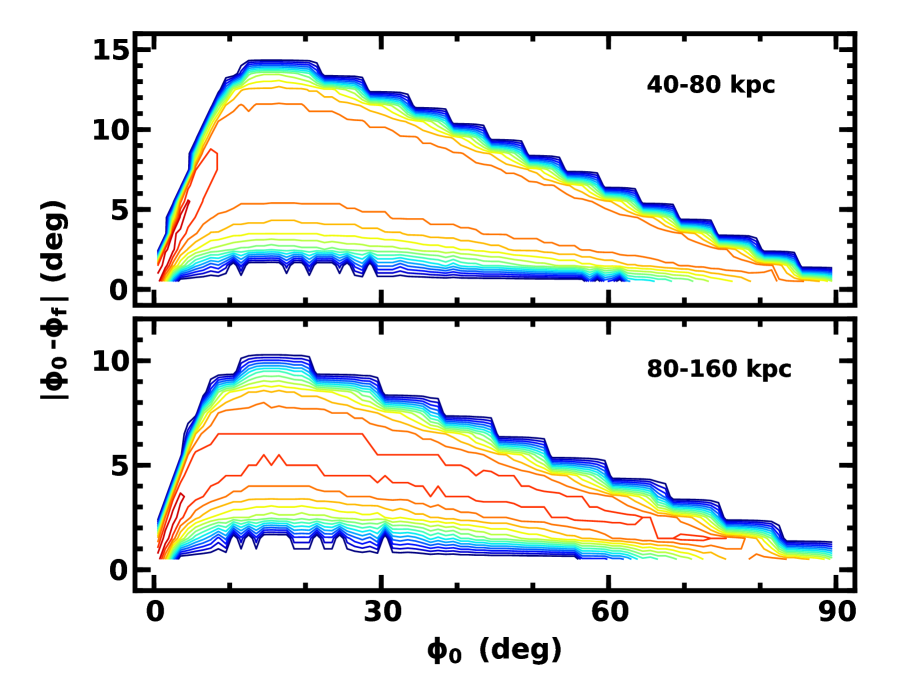
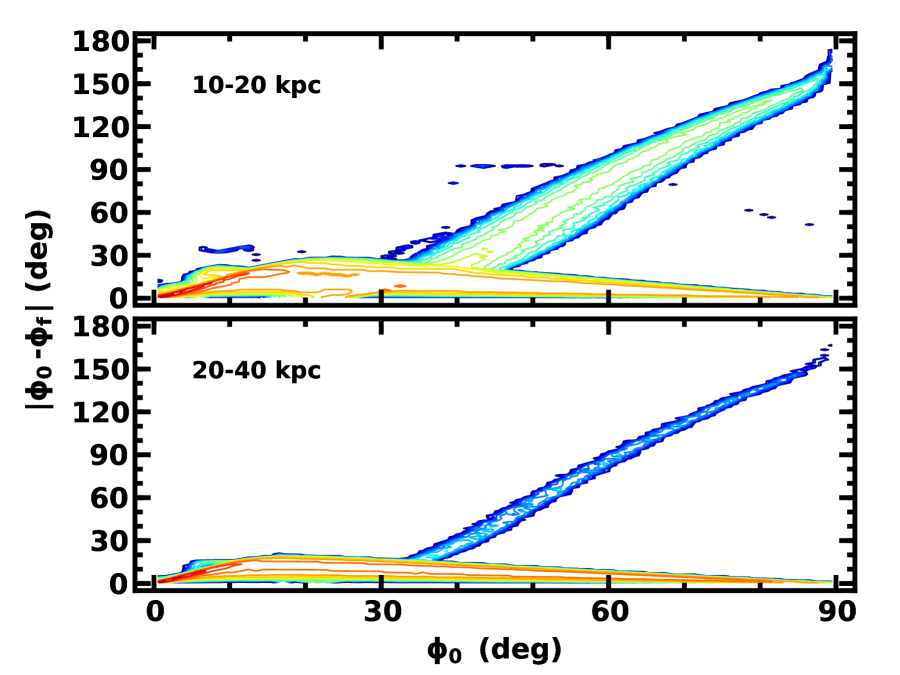
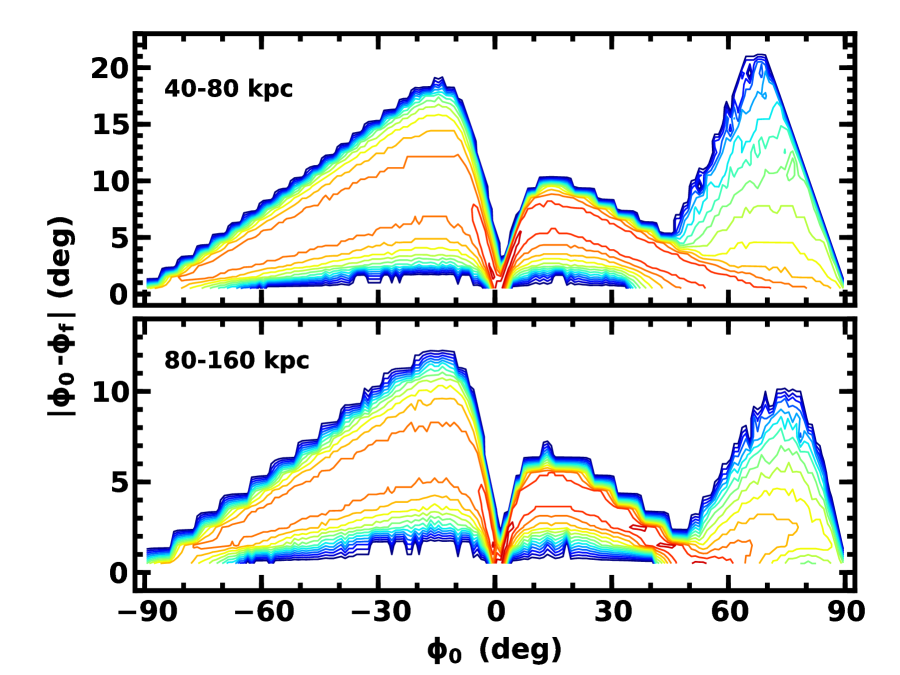
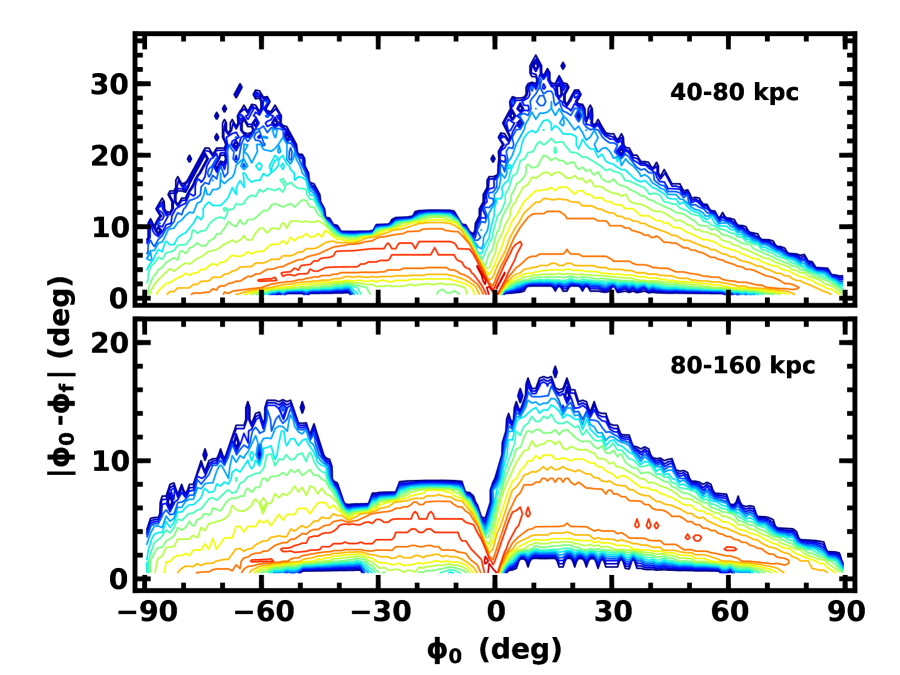
Despite the smaller set of bound stars in a sample at 80–160 kpc, there is a dramatic variation in with and (Figs. 4–5; see also Yu & Madau 2007). At these distances, the highest velocity stars with = 1400–1500 feel a modest deceleration from the disk and have 1∘. For lower velocity stars, typical deflections range from 5∘ ( 30∘) to 05 ( 70∘; Fig. 4, lower panel). Maximum deflections are roughly twice the typical deflections. Within the full set of stars, 57% have 30∘, illustrating the dramatic impact of gravitational focusing by the disk.
Among less distant stars with = 40–80 kpc, the range of is roughly 50% larger (Fig. 4, upper panel). Compared to the 80–160 kpc group, unbound stars at these distances have somewhat smaller initial velocities and therefore experience somewhat larger overall deflections. However, most stars with the largest are bound; with 850–900 , they spend more time at smaller and undergo much larger deflections. As a result, more stars in this sample have 30∘ (60%).
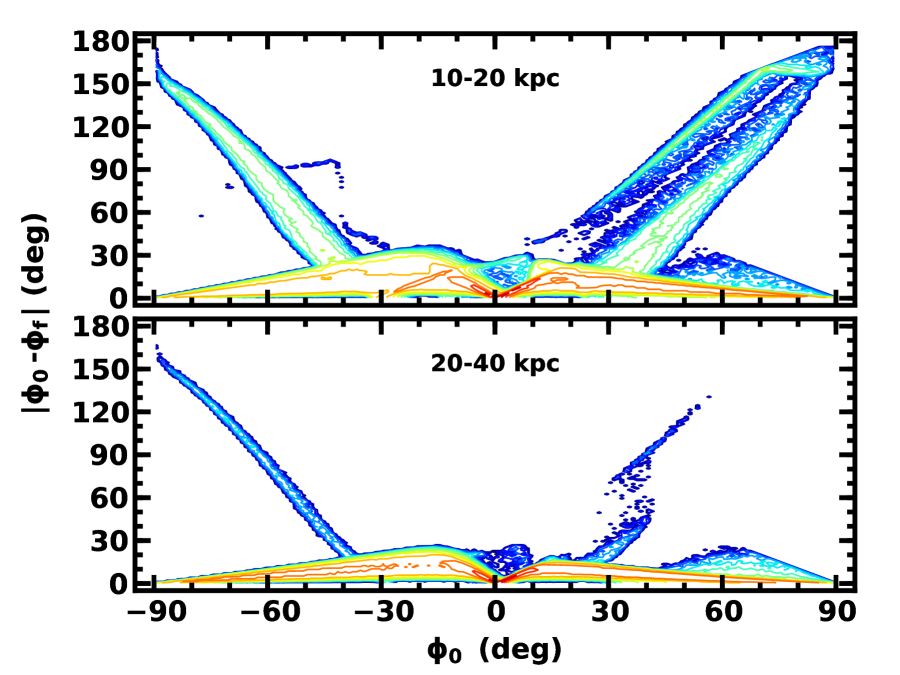
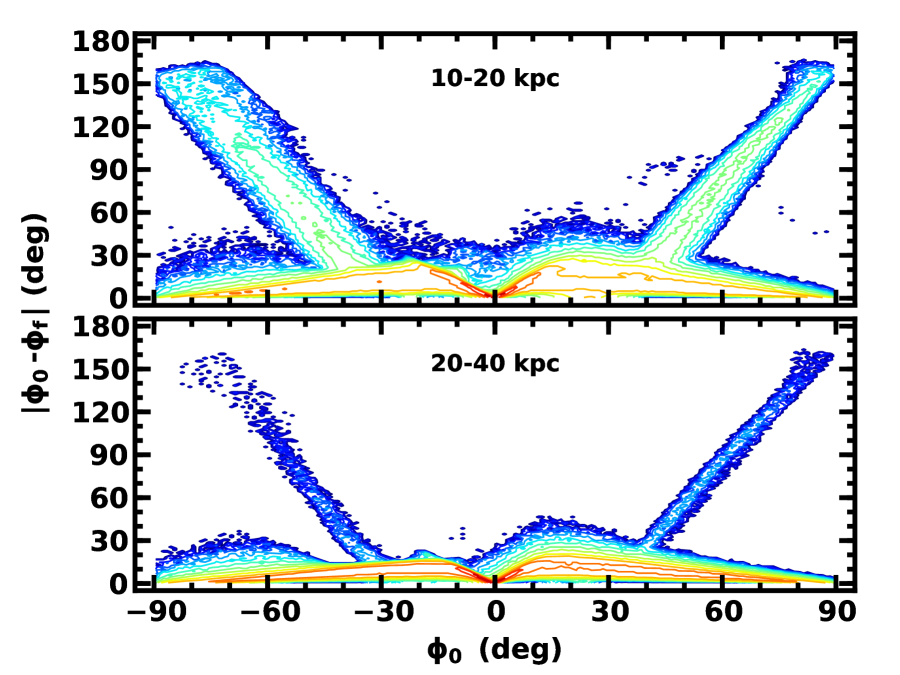
For stars with = 10–40 kpc, the variation of with is more complicated (Fig. 5). In this distance range, nearly all of the stars are bound (94%; Table 4 and Fig. 3). Among the bound stars, roughly 90% have halo-like space velocities. On their first pass out through the Galaxy, these stars endure somewhat larger deflections than higher velocity stars at larger . The maximum is roughly 20∘ for stars with = 20–40 kpc and 15∘; stars with = 10–20 kpc experience a maximum of 30∘ at 20∘ to 30∘. As in Fig. 4, the maximum is smaller for stars with 10∘ and 30∘; the typical is half the maximum.
Some bound stars with 30∘ and = 10–40 kpc travel out from the Galactic Center, reach apogalacticon, and head back towards the Galactic disk. If they live long enough to pass through the midplane of the disk, they end up on the opposite side of the disk relative to their starting point and have . This group produces the concentrations of stars extending from (, ) (35∘, 30∘) to (, ) (90∘, 150∘) in each panel of Fig. 5. Stars with smaller that reach smaller maximum are more likely to live long enough to pass through the disk plane than higher velocity stars at larger . Thus, there are more stars with very large at 10–20 kpc than at 20–40 kpc.
When bound stars follow purely radial orbits, they simply retrace their path after reaching apogalacticon. Within a real MW, however, the disk deflects trajectories for stars on their way out of the Galactic Center and continues to deflect them as they try to return to the Galactic Center (Fig. 1). In this situation, stars follow very non-radial orbits where the total deflection is roughly proportional to : with 2.5 and = ∘ for = 40∘ to 90∘.
We next consider the impact of the LMC on the trajectories of HVSs. With a mass almost twice the mass of the Galactic disk, the LMC should generate larger deflections than the disk. To quantify changes to HVS trajectories, we consider simple models with a stationary LMC and then examine results for an LMC on a more realistic orbit relative to the Galactic Center.
4.2 Toy LMC Models
As a first exploration of the impact of the LMC on HVSs ejected from the GC, we consider a simple potential model where an LMC analog lies along the z-axis at a distance of 49.01 kpc from the GC and 49.66 kpc from the Sun. Compared to a system with no LMC, the extra mass in the MW+LMC potential changes and for HVSs ejected from the GC. After showing how the LMC modifies for HVSs ejected along the -axis, we follow the structure of the previous subsection and quantify how the gravity of the LMC modifies the radial trajectories of individual stars ejected from the GC. We then examine the range of possible deflections for ensembles of HVSs selected with the standard prescription outlined in §3.2.
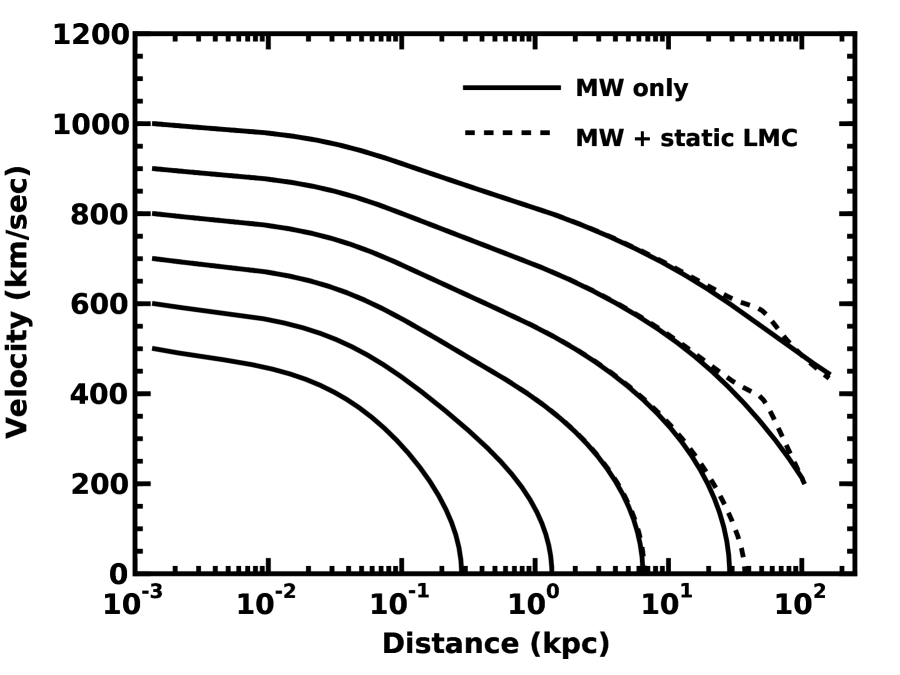
Fig. 6 compares for calculations with (dashed lines) and without (solid lines) an LMC on the -axis. In a pure MW potential, stars ejected with 775 towards the LMC have maximum 10 kpc (see also Kenyon et al., 2008). As grows, ejected stars reach larger . Although the LMC produces negligible changes to for low velocity ejections which never reach the LMC, there are clear changes in for high velocity ejections. When 800 , stars traveling toward the LMC achieve larger distances ( 40 kpc) than those trying to escape from a pure MW potential ( 30 kpc). When the ejection velocity is larger ( 900–1000 ), the LMC acceleration produces a clear ‘bump’ in the track centered on the distance of the LMC from the Galactic Center ( 49 kpc).
In this example, HVSs ejected towards the LMC reach larger distances than HVSs ejected into a potential with no LMC. When = 900 , HVSs ejected along the -axis reach = 105 kpc after 300 Myr of travel time. With no LMC, stars reach only 101 kpc. The smaller deceleration before the star reaches the LMC compensates for the larger deceleration after the star passes through the LMC. Despite the larger , HVSs traveling through the LMC have 200 at 300 Myr compared to 212 for HVSs ejected into a pure MW potential. Although the LMC helps HVSs ejected along the -axis reach larger distances, these HVSs have 10% smaller velocities.
Although changing results in negligible differences in , the amplitude of the bump in the track responds to the adopted . More (less) massive LMC analogs yield larger (smaller) bumps. In a system where the LMC has twice (half) the nominal mass, an HVS ejected with = 900 along the -axis reaches a distance of 107 kpc (103 kpc) with a velocity of 185 (205 ) after a 300 Myr travel time. For ejections along the -axis, = 900 yields = (100 kpc, 202 ) for the light LMC analog, (97 kpc, 192 ) for the nominal LMC analog, and (94 kpc, 172 ) for the heavy LMC analog,
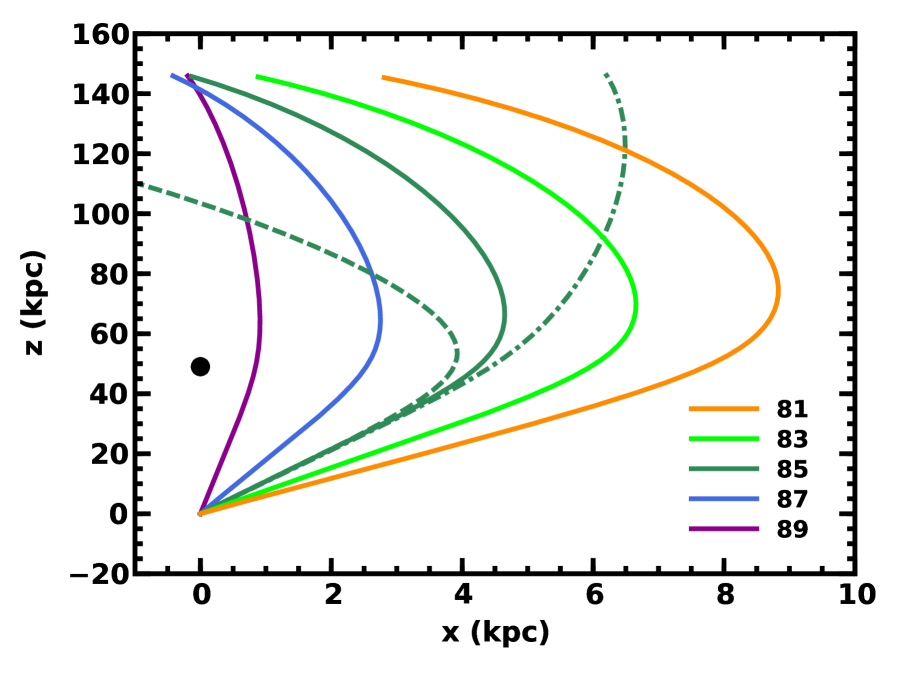
Fig. 7 illustrates trajectories for HVSs ejected with = 900 at various angles relative to the Galactic plane. When = 90∘, the axisymmetric potential of the disk and the LMC simply speed up or slow down an HVS without changing its overall path (Fig. 6). For smaller ejection angles, however, the LMC deflects stars more than the disk does (Fig. 1). Over a travel time of 600 Myr, stars with 89∘ reach a maximum 910 pc at 64 kpc and then bend back towards the -axis, reaching pc at 146 kpc. Stars with smaller achieve larger maximum distances from the -axis before bending around the LMC. The maximum distance and the distance for this maximum increase with decreasing .
Doubling (halving) the LMC mass increases (decreases) deflections (Fig. 7). Over the first 90–100 Myr, HVS trajectories are fairly independent of the mass of the LMC. After 100 Myr, the heavier LMC analog sharply bends the path of an HVS towards the -axis (Fig. 7, dark green dashed line). With the lighter LMC analog, the trajectory is much more radial (Fig. 7, dark green dot-dashed line). Despite the different magnitude of the deflections in this example, the overall speed of an HVS at 200 Myr is nearly identical: 267 (light LMC), 270 (nominal LMC), 268 (heavy LMC). Somewhat counterintuitively, an HVS traveling past the heavy LMC travels a larger distance (85 kpc) than in the gravity well of the nominal LMC (81 kpc) or the light LMC (80 kpc).
The variation of with ejection angle and LMC mass is a signature of gravitational focusing by the LMC. All stars ejected at some angle () relative to the -axis feel an acceleration towards the -axis. When is small, the acceleration in the plane is also small. At large , the Galactic potential dominates. In both regimes, focusing is negligible. For 15∘–25∘, acceleration from the LMC at 35–65 kpc is large enough to bend trajectories by 5∘–10∘. At these angles, the acceleration at 35–50 kpc exceeds the deceleration at 50–65 kpc. Compared to stars with 15∘ or 25∘, these stars end up with slightly larger velocities after passing by the LMC. Because the deceleration from the Galaxy is independent of , the stars maintain their larger velocities as they continue to speed through the halo.
The amplitude of the ‘bump’ in in Fig. 6 and the deflections of trajectories in Fig. 7 are also functions of the ejection velocity from the GC. With the gravitational focusing factor , the magnitude of the bump or deflection responds more to changes in than to changes in . For our nominal , ensembles of stars with = 1200 and various ejection angles have nearly identical after a travel time of 300 Myr. Deflections from purely radial trajectories are minimal. Halving or doubling the mass of the LMC has a fairly minimal impact on the trajectories for these high velocity stars. However, halving (doubling) leads to much smaller (larger) deflections (Fig. 2).
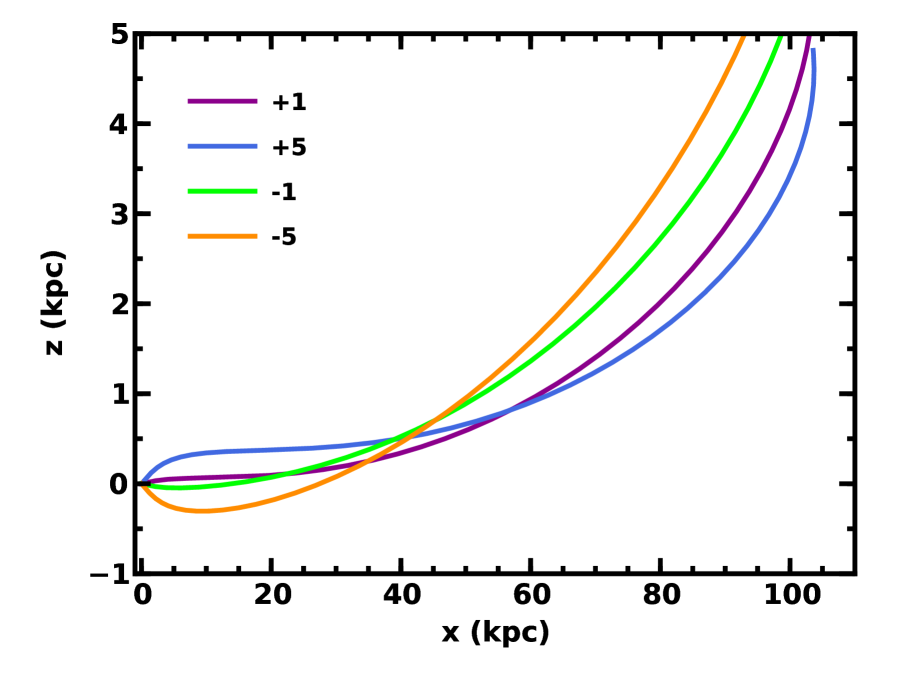
Aside from these obvious gravitational focusing effects, the LMC potential also bends the trajectories of HVSs ejected into the Galactic plane (Fig. 8). For stars with 1∘–5∘, the disk gravity works to deflect stars back toward the midplane as in Fig. 1. By the time stars reach = 40 kpc, the gravity of the more distant LMC overcomes the weaker disk gravity and pulls stars away from the plane and into the halo.
When stars are ejected with = 1∘ to 5∘, the impact of the LMC is more pronounced. At small , the disk gravity pulls stars towards the midplane; the z-component of the velocity changes sign from negative to positive. After stars cross the midplane, the gravity of the disk is too weak compared to the LMC to pull them back. The gravity from the LMC continues to pull stars farther and farther above the midplane. Because these stars already have a positive , they overtake HVSs ejected with 0. The trajectories of stars with ∘ are therefore bent more than those of stars with ∘.
For HVSs ejected with a range of , the distance reached after a fixed time depends on and . Stars ejected towards the fixed LMC ( 60∘) with = 900 achieve 1% to 5% larger distances after a 300 Myr travel time. Stars ejected away from the LMC ( ∘) end up at 4% smaller distances. Stars ejected approximately into the plane (∘ 60∘) are mainly slowed by the extra gravity from the LMC and have 2% to 3% smaller maximum distances than stars ejected into a pure MW potential.
Independent of , HVSs in a MW+LMC potential have smaller space velocities. For = 900 kms, speeds after 300 Myr range from 95% ( 75∘) to 90% ( ∘) of HVS speeds in the pure MW potential. The maximum final speeds occur for HVSs that pass within 1-2 LMC scale lengths of the LMC center.
HVS ejected with larger (smaller) have a smaller (larger) impact on their distances and speeds after 300 Myr traveling through the Galaxy. High (low) velocity stars spend less (more) time near the LMC and thus experience smaller (larger) overall deceleration. For HVSs capable of escaping the Galaxy ( 1000 ), final distances and speeds are only somewhat less with the LMC than without the LMC. Bound stars with 900 have much smaller distances and velocities, with trajectories modified significantly by the LMC (Figs. 7–8).
To quantify the impact of the LMC on HVSs trajectories in more detail, we consider a second sample of stars ejected from the Galactic Center with a stationary LMC analog positioned on the -axis at a distance of 49.66 kpc from the Sun. Once again, the predicted is a strong function of and (Fig. 9). When an LMC analog lies along the -axis, there are three peaks in the – relation: (i) at ∘, where stars ejected with a negative are pulled toward the midplane by the LMC and the Galactic disk, (ii) at 15∘, where the gravity from the disk counters the gravity from the LMC, and (iii) at 75∘, where the LMC gravity focuses stars around it.
With our adopted LMC mass, the three peaks have very different maximum deflections. In a pure MW potential, the two peaks at ∘ are symmetric: stars ejected with positive or negative are equally drawn to the disk midplane. Adding in the LMC potential creates an asymmetry. Stars ejected with negative are pulled towards the disk midplane by the LMC and the disk. For stars with positive , the gravity of the LMC counters the gravity of the disk. When 60∘, stars with negative have larger than those with positive .
Stars ejected along the -axis ( 60∘) experience much larger deflections from the gravity of the LMC than from the gravity of the disk. Among these stars, the disk gravity decelerates stars and produces a modest deflection (Fig. 2). All of these stars, however, pass within 2 of the LMC and are focused towards the -axis. The amount of focusing depends on : stars with large (small) spend less (more) time near the LMC and have smaller (larger) .
As in examples for the pure MW potential, the typical is a strong function of . Stars with the largest reach the largest and experience the smallest deflections (Fig. 9, lower panel). Compared with HVSs in a pure MW potential, HVSs in the MW+LMC potential with 80 kpc and ∘ (∘) have larger (smaller) . Most of these stars are unbound; aside from deflecting stars above the plane, the LMC has little impact on their escape from the Galaxy.
High velocity HVSs ejected towards the LMC ( 60∘) fall into two groups. Nearly all of these stars are unbound (Fig. 3). The LMC deflects these stars by a few deg, as indicated by the red contour in the lower right corner of the panel. A few stars are bound; before falling back towards the GC, the LMC bends their trajectories by as much as 10∘.
Lower velocity stars that reach = 40–80 kpc have systematically larger (Fig. 9, upper panel). For nearly all of these stars, the typical is roughly 50% larger than for higher velocity stars at 80–160 kpc. However, the shape of the – relation is mostly unchanged, with two peaks at = ∘ and ∘, and a third peak at a somewhat larger ∘ instead of ∘.
Stars at much smaller experience a variety of deflections (Fig. 10). Compared to results for a pure MW potential (Fig. 5), the overall shape of the – relation is fairly similar: (i) most stars have modest deflections, (ii) there are clear peaks in at ∘, and (iii) some bound stars with large undergo very large as they try to return to the GC.
Among stars at 20–40 kpc, the LMC generates several new features in the – relation (Fig. 10, lower panel). Although a substantial ‘tail’ of bound stars with large at large remains for ∘, there is a much weaker feature at 30∘. Stars with large accelerate towards the LMC and are focused towards it. With somewhat larger velocities (due to their smaller deceleration), fewer stars return towards the GC with the same maximum deflections as their counterparts with ∘. Instead, the trajectories of these stars bend towards the LMC by 20∘ to 30∘, producing an additional peak in the – relation at 60∘.
Because the gravity of the LMC deflects HVSs with small (Fig. 8), there is another group of stars with 0∘ and 20∘ to 30∘. In a pure MW potential, stars ejected into the plane feel little gravity from the disk and are undeflected. With an LMC along the -axis, these stars are deflected towards the LMC and make it into the halo at 20–40 kpc.
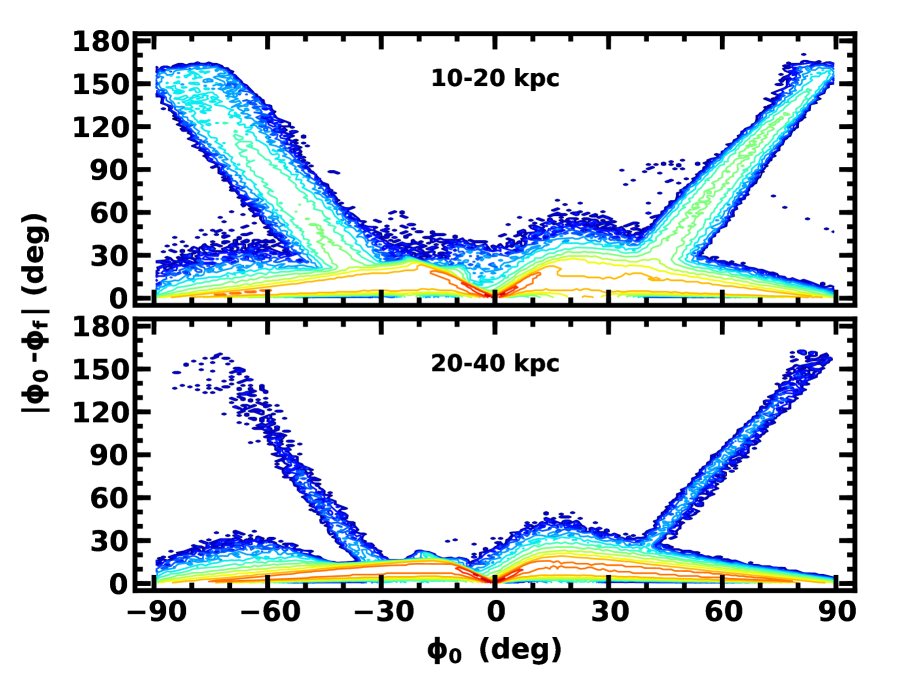
Overall, the LMC has a modest impact on bound stars at 10–20 kpc (Fig. 10, upper panel). Most stars have modest deflections. The – relation has (i) the standard peaks of 30∘ at ∘ and 20∘ at ∘, (ii) tails at 30∘ with large , and (iii) small subsets of bound stars with 20∘ to 30∘ at 0∘ and at 60∘. Compared to the pure MW model, the tail at 30∘ has a much broader morphology and is more chaotic. With the LMC along the -axis, bound stars traveling toward the Galactic pole are pulled towards the LMC, producing a different set of deflections compared to the pure MW potential.
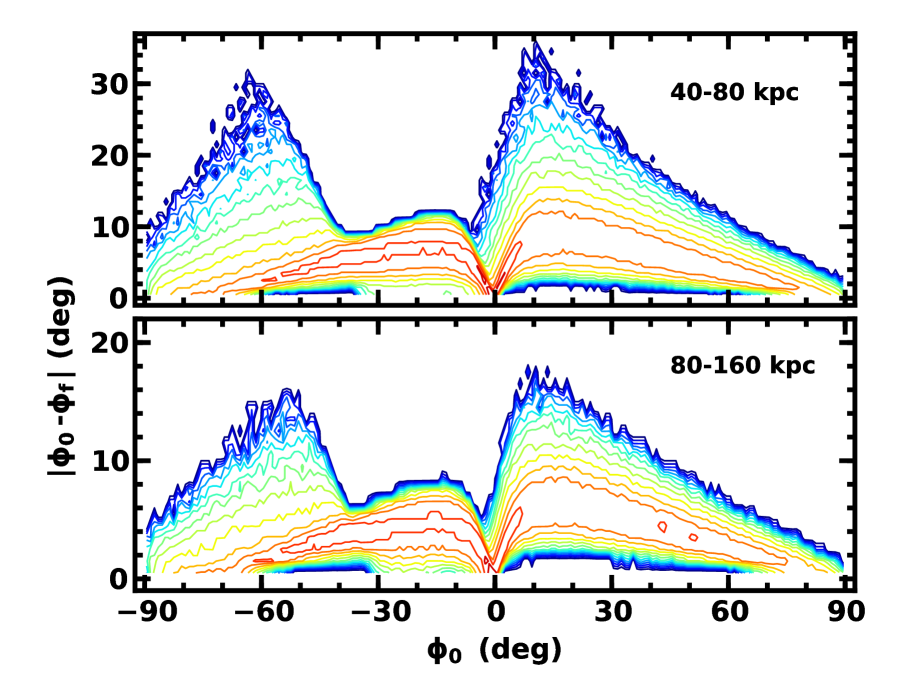
Ejecting a sample of HVSs into a potential with a fixed LMC at its current position yields fairly similar – relations. Among unbound stars at 80–160 kpc, an LMC with = 49.66 kpc at = = creates somewhat larger extreme deflections, with peaks at ∘, ∘, and ∘ (Fig. 11, lower panel). Stars injected into the Galactic plane have typical 4∘ to 8∘. Compared to a calculation with the LMC on the -axis, these deflections are either a degree or two smaller (∘) or a degree or two larger (∘). Stars ejected into the Galactic pole either have small ( 60∘) or large ( ∘).
An LMC in the southern hemisphere has a more dramatic impact on stars at smaller distances, 40–80 kpc (Fig. 11, upper panel). Bound stars ejected just above the disk midplane ( 10∘) and into the southern Galactic halo (∘) then have large 30∘. These deflections are roughly 50% larger than in a system with the LMC along the -axis. Unbound stars injected with ∘ ∘ typically have modest 5–10∘. HVS traveling above the plane ( 0) are deflected more than HVSs below the plane. Those with much larger have much smaller 1∘ to 2∘.
Bound stars with lower have even larger deflections. At 20–40 kpc (Fig. 12, lower panel), stars typically have 10∘ to 20∘ at low and a few deg at large . However, groups of bound stars have large for all . As in previous examples, bound stars that travel out through the galaxy, turn around, and head back towards the GC often have 90∘ to 150∘. This group grows considerably among stars with = 10–20 kpc.
4.3 Full LMC Model
Although the toy models illustrate how a stationary LMC impacts the trajectories of HVSs, the real LMC travels many kpc during the 100+ Myr flight time for stars ejected from the GC into the Galactic halo. To consider the impact of a more realistic LMC, we add a moving LMC into our potential model. Starting with an LMC at its current position, we calculate the acceleration of the LMC (MW) due to the MW (LMC). Relative to a fixed center-of-mass, we then integrate the orbits of the LMC and the MW backwards in time using the same procedure as for HVSs ejected from the GC. After an evolutionary time of 10 Gyr, we adopt the endpoint of the ‘backwards’ integration as the starting point for a second integration, where we allow the LMC and the MW to fall back towards the center-of-mass. The differences between the endpoint of this second integration and the current LMC position are smaller than 0.05 kpc in each cartesian position coordinate and less than 0.05 in each cartesian velocity. Although we could achieve higher accuracy with shorter timesteps, this agreement is satisfactory.
In this exercise, the masses, gravitational potentials, and other structural parameters of the LMC and MW are fixed in time222Although the Local Group is embedded in diffuse gas, observational and theoretical analyses suggest a total mass comparable to the Galactic disk and a typical accretion rate of 1–10 (e.g., Nuza et al., 2014; Lehner et al., 2015; Richter et al., 2017, and references therein). Tidal stripping likely reduces the mass of the LMC over time (e.g., Fox et al., 2013, 2014). During the 200–300 Myr of a typical simulation, the mass added to the MW or lost by the LMC makes a negligible contribution to the potential of either galaxy.. To treat dynamical friction by the MW on the LMC, we follow previous studies and adopt a simple formula (e.g., Besla et al., 2007; Gómez et al., 2015; Jethwa et al., 2016):
| (15) |
where is the mass density of the MW at the position of the LMC, is the Coulomb logarithm, is the velocity distribution function, and is the velocity of the LMC relative to GC.
Typically, this acceleration from dynamical friction is 10% to 15% of the acceleration from the MW on the LMC. Our approach ignores the factor of 100 smaller acceleration from dynamical friction on the MW by the LMC.
It is standard to approximate the integral in eq. 15 by
| (16) |
where and is the one-dimensional velocity dispersion of the MW halo (Gómez et al., 2015; Jethwa et al., 2016). For an NFW profile, and can be expressed as:
| (17) |
and
| (18) |
where , , , is the radius of maximum circular velocity, is the maximum circular velocity at , and is the mass contained within (e.g., Zentner & Bullock, 2003; Gómez et al., 2015; Jethwa et al., 2016). Setting
| (19) |
yields the mass contained inside for an adopted and (Navarro et al., 1996, 1997).
To test our algorithm, we conducted a series of tests designed to reproduce published results. Our solutions for the separation of the LMC and MW, , as a function of the masses and structural parameters follow the trends in Fig. 1 of Gómez et al. (2015), who derive the motion of the LMC for a broad range of MW and LMC masses. For our choice of and , the trajectory of the LMC across the sky in matches the trajectory in Fig. 1 of Boubert & Evans (2016), who adopt an LMC orbit from the calculations of Jethwa et al. (2016).
For an ensemble of HVSs traveling through a time-varying MW+LMC potential, we select stars using our standard prescription. Once a star is placed at = 1.4 pc with velocity and ejection angles and , we use a look-up table to place the LMC at its expected position at a time = . The LMC is then at a position earlier than its current position relative to the GC. As we integrate the orbit of the star through the MW+LMC potential, we update the LMC position every time step, until the LMC reaches its current position at = . In this way, every star travels through a time-varying potential, with the initial LMC position set by .
In these calculations, we ignore the changing velocity of the MW relative to the center-of-mass. Over the 350 Myr main sequence lifetime of the B-type stars in our model, the velocity of the MW relative to the center-of-mass changes by roughly 20 . Compared to typical ejection velocities of 700 to more than 1000 , this difference is small. Among known HVSs, travel times from the GC to the halo are 50–250 Myr (Brown et al., 2014). During this time frame, the velocity of the MW changes by only 10 . This velocity is comparable to typical errors in the radial velocity and much smaller than typical errors in the tangential velocity (e.g., Brown et al., 2009, 2012, 2014, 2015; Marchetti et al., 2018b; Hattori et al., 2018a).
Overall, the moving LMC has little impact on distributions of HVS deflections. At 80–160 kpc, the magnitude of typical and extreme deflections as a function of is similar to that in models with a fixed LMC at its current position (Fig. 13, lower panel). At any , the largest is roughly 1∘ smaller; typical deflections are nearly identical. Among closer stars with = 40–80 kpc, maximum deflections are nearly 2∘ smaller; typical deflections are less than 1∘ different from those with a stationary LMC (Fig. 13, upper panel). Within both samples, a moving LMC fills a larger volume throughout the simulation and therefore deflects a larger percentage of stars. Compared to calculations with a stationary LMC, more HVSs have typical deflections in this simulation. Correspondingly fewer have the minimum deflection.
This situation repeats for stars at 10–40 kpc (Fig. 14). Although the maximum and typical deflections are smaller, more HVSs experience significant deflections. Among bound and unbound HVSs, there is a larger percentage of clearly non-radial orbits. Despite these clear differences, a moving LMC has little impact on the vast majority of stars in these samples (within the red contours in the figure). Most stars have modest deflections which range from a few degrees for stars ejected into the Galactic plane or into the Galactic pole to 10∘–30∘ for stars ejected with 10∘ to 40∘. While the gravity of the LMC deflects these stars, its motion has little impact.
4.4 Summary
Within a MW+LMC potential, HVSs ejected from the GC deviate significantly from radial orbits. On its own, the gravity of the disk deflects the trajectories of HVS moving near the Galactic plane (Figs. 1–2). For HVSs with 30∘, typical deflections range from 5∘ for unbound stars to 20∘ to 30∘ for bound stars (Figs. 4–5). Although stars ejected into higher Galactic latitudes experience a factor of 2–3 smaller , all HVSs are deflected towards the disk. Within a large ensemble of HVSs, more than 60% have final Galactic latitude 30∘.
The LMC adds another source of asymmetry to the potential. With a nominal mass larger than the MW disk mass, the LMC slows down HVSs faster than the disk and generates larger deflections with respect to the initial, purely radial motion. Changes to the radial trajectories are fairly independent of the initial angle of ejection relative to the plane: most HVSs have 2∘ to 5∘, a factor of 2–3 larger than in a system with no LMC.
In these examples, the position and large mass of the LMC are responsible for the shape of the - relation. Large deflections always occur for stars ejected with small ; moving the LMC closer to the disk tends to make these deflections larger. Stars with larger develop significant non-radial motions when the LMC lies somewhere near their nominal trajectory. An LMC along the -axis deflects stars with 60∘, but not those with ∘. Similarly, placing the LMC at its current position changes the trajectories of stars with 0∘ to ∘ and ∘ to ∘ much more than stars ejected into other quadrants of the Galaxy.
For any LMC position, reducing (increasing) the mass of the LMC leads to smaller (larger) peaks at ∘ and at ∘. Although changing the LMC scale length changes and for HVSs in the outer halo, has little impact on the magnitude or the shape of the – relation. For peaks at ∘ and , the distance of the LMC is large compared to the scale length. The magnitude of the deflections then depends only on the LMC mass. When stars are ejected along the -axis, the scale length has a modest impact on the height and shape of the peak at ∘. However, factor of two changes in produce much smaller variations in the peak than factor of two changes in the LMC mass.
5 OBSERVATIONAL DISCRIMINANTS
To develop observational predictions from these calculations, we consider subsets of the stars in calculations with and without an LMC analog. Selecting 3 stars with 100 kpc, absolute -band magnitudes 0 (Bressan et al., 2012), and 20 yields a sample accessible with large ground-based optical telescopes (e.g., Brown et al., 2005, 2009, 2013). For this group of stars, we consider how the radial space density, sky surface density, and distributions of the deflection angle and the radial and tangential velocity distinguish MW potentials with an LMC from those without an LMC.
Among all of our calculations, the radial variation of the space density of bound and unbound stars is nearly independent of the presence of the LMC. As in Fig. 3, stars outside (inside) 80 kpc are mostly unbound (bound to the Galaxy). Within 40 kpc, the relative numbers of unbound stars and bound outliers to halo-like stars are independent of the LMC mass. In models with and without the LMC, the relative density of bound outliers (unbound stars) peaks at 70–75 kpc (100–105 kpc).
The fraction of stars in the disk and halo is also independent of the physical properties of the LMC. For halo stars and bound outliers, roughly 33% have 30∘. The fraction of stars with 30∘ grows to 43% among unbound stars, where deflections from the disk or the LMC are smaller. Despite isotropic ejections from the GC, most bound HVS lie close to the Galactic plane. Unbound HVSs are distributed more isotropically.
Despite the high concentration at low Galactic latitude, HVSs in the pure MW calculations are otherwise distributed rather uniformly in space and velocity (Table 5). For the entire sample of stars, the average/median position and velocity is consistent with zero. The dispersion and inter-quartile range is roughly 20 kpc in each coordinate. The typical dispersion of 175 (150 ) in () yields a 3D velocity dispersion of roughly 300 , which is only twice the typical radial velocity dispersion of halo stars in the outer Galaxy (e.g., Brown et al., 2010; Kafle et al., 2012; King et al., 2015; Cohen et al., 2017). The smaller velocity dispersion in the direction is a measure of the influence of the disk potential.
In calculations that include the LMC potential, the distribution of stars is less isotropic. The positional centroid of the population shows a clear displacement of stars towards the LMC. The offset in velocity is smaller but still towards the adopted position of the LMC. Despite these differences, the velocity dispersion in LMC models is nearly identical to that in pure MW models.
These differences are also apparent in the specific angular momenta. Defining the cartesian components , , and , stars initially on radial trajectories from the GC have a specific angular momentum close to zero. After passing through the MW potential, the ensemble of HVSs in a MW only model still has average and median close to zero. The nearly identical large values of and result from the large distances of HVSs from the GC. The much smaller is a consequence of the symmetry of the potential relative to the Galactic poles.
Adding the LMC into the potential significantly changes these results. For the full set of HVSs, the average and median in Table 5 show the large impact of the LMC. Considering the absolute values, the average and median specific angular momenta illustrate the ability of the LMC to impart a rotational component to the velocities of bound HVSs.
Among unbound stars with 80 kpc in the MW only potential, typical angular momenta are somewhat smaller than those listed in the Table. Stars at larger distances in the MW+LMC calculations have larger specific angular momenta. Beyond 80 kpc, average and median values for are roughly a factor of two larger than those for the entire ensemble. Although the trajectories of unbound stars are deflected less than those of bound stars, their larger distances conspire to produce rather larger specific angular momenta.
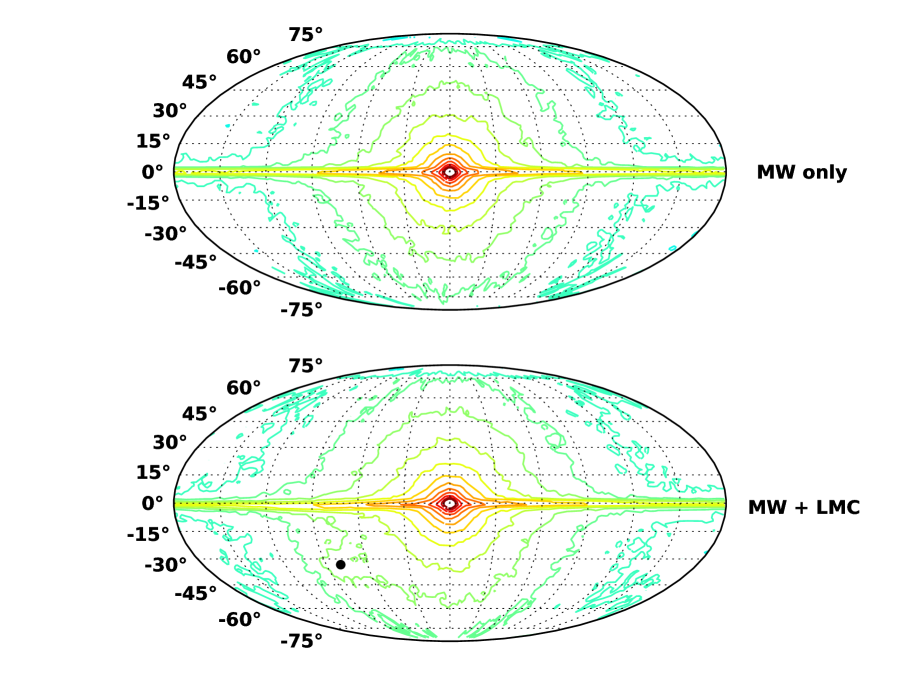
The sky surface density of unbound stars and bound outliers shows some of these features (Fig. 15). In the top panel, a map derived from models with no LMC shows (i) a strong concentration of stars towards the disk superimposed on (ii) a roughly axially symmetric distribution of stars centered on the GC. Although HVSs are ejected symmetrically from the GC, the gravitational potential of the disk bends trajectories towards the Galactic plane. Otherwise, stars are fairly isotropically distributed about the GC.
Results for calculations with the moving LMC analog are obviously different. In addition to a strong concentration of stars towards the disk midplane and the GC, there is a clear enhancement in the surface density towards the LMC at = (∘, ∘). Although the contours in the northern Galactic hemisphere resemble those in the MW only map, those in the southern Galactic hemisphere are more distorted and less symmetrical relative to = 0∘. These differences show the large impact of gravitational focusing, where the LMC bends the trajectories of HVSs around it. The extra concentration of stars towards the LMC is responsible for the shift in the median position of HVSs from the GC towards the LMC.
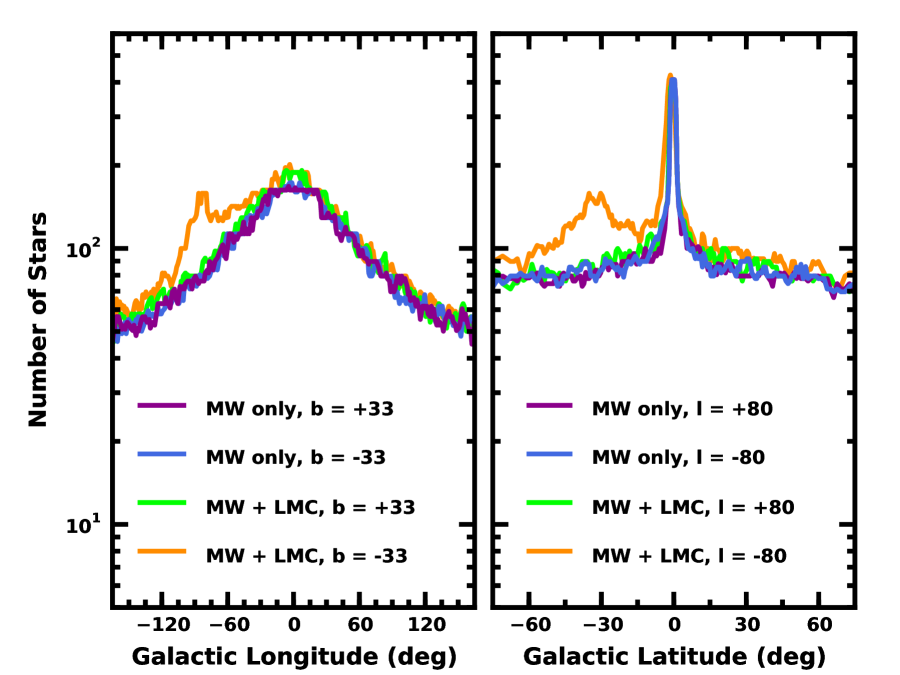
To examine the surface density enhancement in more detail, we consider the number of stars in 10∘ 10∘ boxes separated by 5∘ intervals (Fig. 16). In the left panel, the curves plot the number of stars as a function of Galactic longitude for boxes centered at = ∘ and = ∘. In the MW only models (purple and blue curves), the number of stars is independent of . Remarkably, the number of stars at = ∘ in the MW + LMC model (green curve) follows the MW only model very closely. In contrast, there is a clear factor of 2–3 enhancement in stars at = ∘ to ∘ along the = ∘ track (orange curve). The half width of the enhancement is roughly twice the LMC scale length.
The right panel of Fig. 16 illustrates the variation of surface density along a line of constant . For MW only models, the number of stars as a function of is symmetric with : the track for = ∘ (purple curve) closely follows the one for = ∘ (blue curve). Adding in the LMC has little impact on the track for = ∘ (green curve). Along = ∘ (orange curve), however, the enhancement in stars around the LMC is clear. Here, the half width of the enhancement is also roughly twice the LMC scale length.
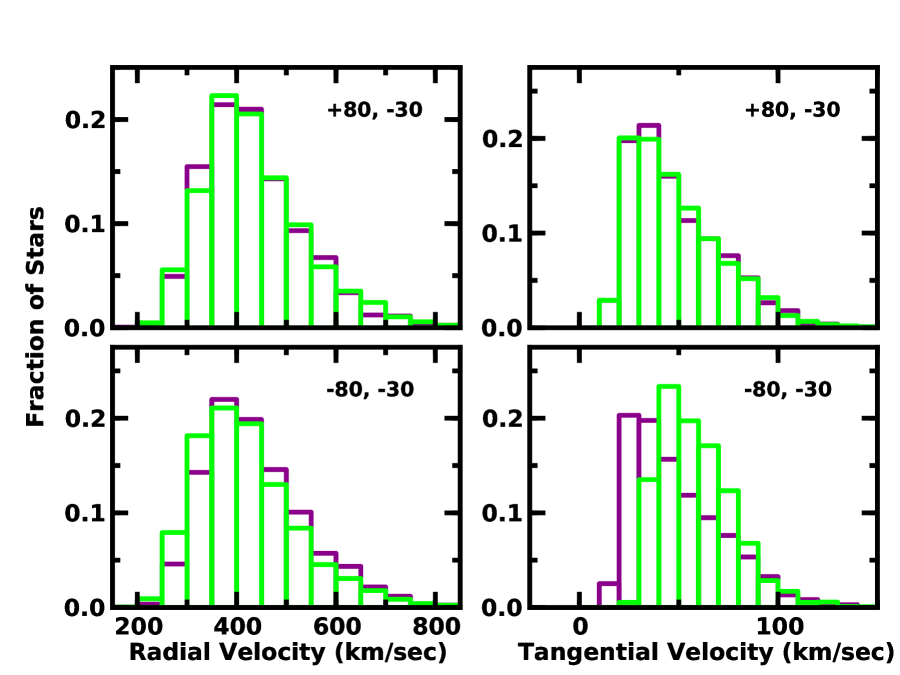
To explore the velocity differences between the calculations, we compare the distributions of radial and tangential velocities for unbound stars and bound outliers along lines-of-sight towards the LMC and other directions through the Galaxy. Fig. 17 illustrates results for = in the lower panels and for = in the upper panels. Along a line-of-sight towards the LMC, the distributions of for a MW only model (2000 stars, purple histogram) and a MW+LMC model (3700 stars, green histogram) are clearly different: models with the LMC have systematically smaller than those without the LMC. Using a K–S test (Press et al., 1992), the two distributions have a small chance, , of arising from the same parent population.
The distributions of towards the LMC are also different (Fig. 17, lower right panel). In the MW only model (purple histogram), the tangential velocity peaks at a smaller value ( 40–60 ) than in the MW+LMC model (green histogram, peak at 80–100 ). The K–S test again predicts a small likelihood, , that the two distributions have a common parent.
The top panels of Fig. 17 compare distributions for a line-of-sight on the opposite side of the GC from the LMC. The and distributions look identical; K–S tests yield 20% to 40% probabilities that the samples are drawn from the same parent population.
For other lines-of-sight through the Galaxy, there is a clear correlation between the results of K–S tests and . At high latitudes with 50∘, the LMC has little impact on the and distributions. For the MW only and MW+LMC samples, the averages/medians differ by less than 10 ; the corresponding dispersions or inter-quartile ranges are typically 150–200 . Based on K–S tests, the distributions have a high probability of selection from a common parent population.
At lower latitudes, the distributions of and show significant differences. For a specific , the K–S probability systematically grows from roughly at 40∘ to at 0∘–10∘. When 40∘, the typical in models with an LMC is a few per cent larger than models with no LMC. The typical is correspondingly smaller. Near the plane of the disk, the difference in and rivals the differences for the line-of-sight that includes the LMC shown in Fig. 17.
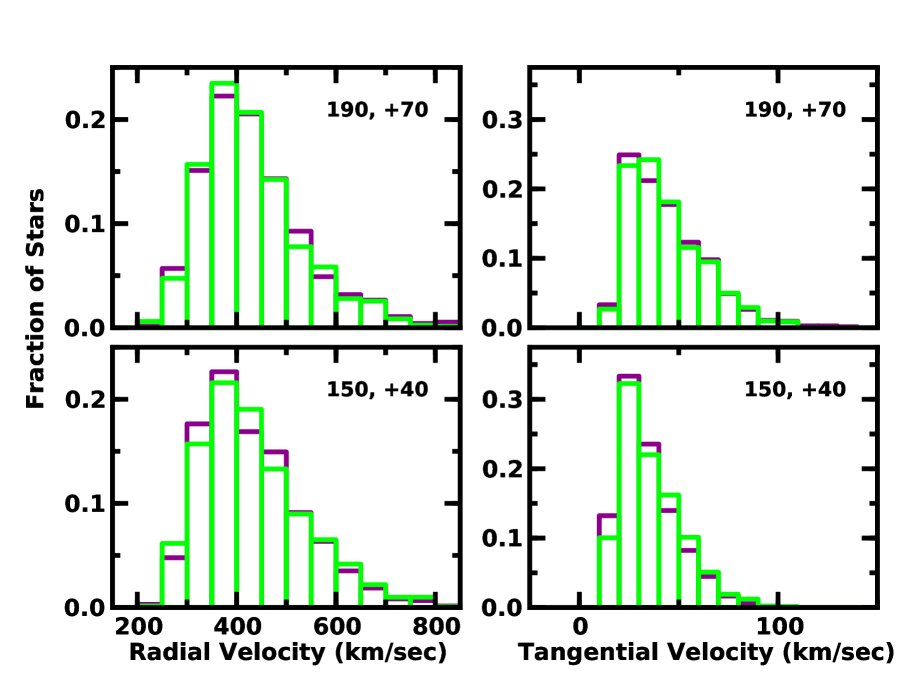
Fig. 18 illustrates results for two lines-of-sight well away from the current position of the LMC. In the upper panels, there is little difference between the distributions for MW only (purple histograms) and MW+LMC models (green histograms). The peaks and overall shapes of the distributions look identical within counting statistics. A K–S test confirms that the probability that the distributions are drawn from the same parent population is 20% to 30%. In the lower panel, the distributions start to show the tell-tale signature of the LMC potential: a somewhat smaller set of radial velocities and a somewhat larger set of tangential velocities. In this example, the K–S test yields a probability that the two sets of velocities are drawn from the same parent.
The physical origin for the variation of K–S probability with follows from sec. 4.2. For stars ejected into high Galactic latitudes, an LMC fairly close to the Galactic plane only slightly deflects the trajectories of unbound stars and bound outliers. Once these stars reach 50–100 kpc, most of their motion is radial; is negligible. Thus, any differences in the distributions are small and difficult to measure quantitatively. Although high latitude HVSs traveling out of the MW+LMC potential typically reach somewhat smaller distances with somewhat smaller , it is challenging to measure this difference. Within an ensemble of HVSs, this feature of LMC models moves the lowest velocity stars among the bound outliers (unbound stars) into the halo-like (bound outlier) population. Because they have the highest velocities and are decelerated the least, stars remaining among the bound outliers and unbound stars have fairly similar radial velocity distributions dominated by the (rare) highest velocity ejections. Thus, the populations are indistinguishable.
When HVS are ejected at low Galactic latitudes, the disk always deflects them from radial orbits. The gravity of the LMC magnifies these deflections. Stars with 40∘ are first deflected towards the disk by the disk potential and then by the LMC. Compared to stars at higher latitudes, these stars end up with larger and smaller . With larger deflections at smaller , the differences in the distributions of and grow with decreasing .
In these examples, the K–S tests require samples of a few hundred stars along most line-of-sight to yield probabilities . Samples of 20–30 stars in areas that subtend 10∘ 10∘ on the sky yield smaller confidence levels, . Testing differences among different potential models thus requires unbound HVSs over the sky.
To conclude this section, we examine the ability of 6D position and velocity information to measure the deflections of HVS from their original radial orbits. For stars with observed position and velocity , the angle between these two vectors is
| (20) |
Stars on purely radial orbits have = 0∘; disk stars orbiting the GC have 90∘.
Despite our inability to measure directly, is an excellent proxy for . For nearby stars ( = 10–40 kpc) on their first pass out through the MW only potential, ranges from roughly zero at 0∘ to a broad maximum of 10∘ to 20∘ at 30∘ to roughly zero again at 90∘ (see Figs. 4–5). The potential of the disk deflects bound stars near the Galactic plane by 10∘ to 20∘ more than unbound stars ejected from the GC at larger velocities. Bound stars on their way back to the GC have 30∘; many stars have 150∘ to 180∘. The frequency of is symmetric about the disk plane: stars with 30∘ have the same distribution of as stars with ∘.
Among more distant stars ( = 40–160 kpc), the population is dominated by unbound stars leaving the MW. With few bound stars returning to the GC, is always rather small. Close to the Galactic plane, 1∘. At somewhat larger 10∘ to 30∘, a few stars have 3∘. Near the Galactic poles, 1∘.
In models with the LMC potential, the behavior of with is more complicated (Figs. 9–14). Nearby, the large population of bound stars generates a broad range of 0∘ to 180∘, with a clear preference for 10∘ to 30∘ in the direction of the LMC and close to the Galactic plane. Near the LMC, gravitational focusing pulls stars on radial trajectories towards the LMC. Close to the disk midplane, the gravity of the LMC pulls stars across the disk. After reaching apogalacticon, bound stars returning towards the GC have large 180∘. As in the MW only models, these stars occupy the full range of possible with a modest overdensity at 30∘ due to the general overdensity of bound stars in the plane.
Compared to nearby stars in the MW + LMC potential, more distant unbound stars have relatively small . Near the Galactic poles ( 70∘ to 90∘), the gravity of the LMC simply decelerates these stars more rapidly than the MW on its own. Deflection angles are then small ( 3∘; see also Fig. 13). Stars ejected towards the LMC and into the Galactic plane are deflected by much larger angles, 5∘. Few stars have much larger deflection angles.
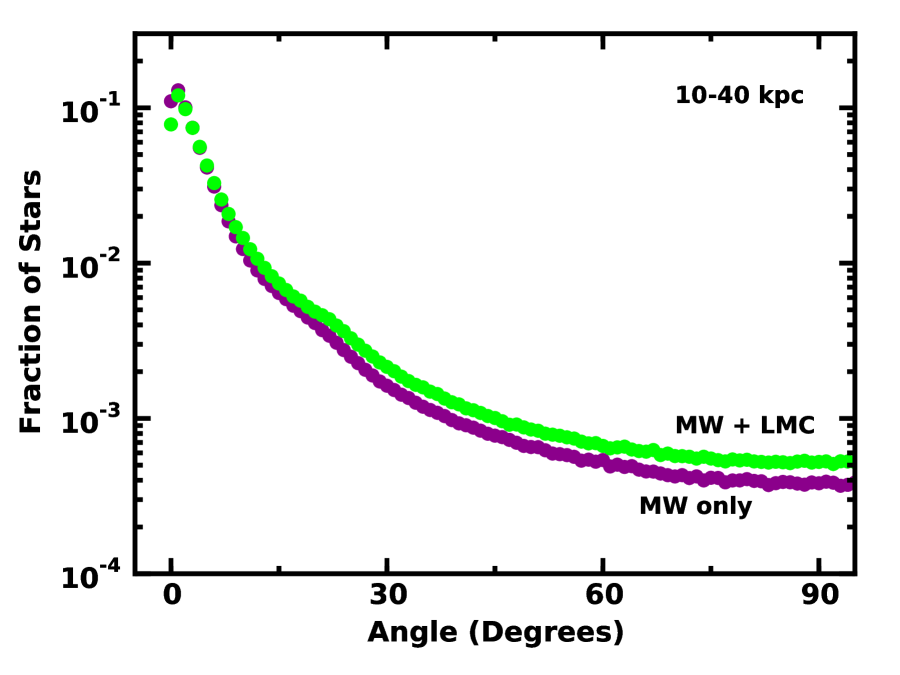
To contrast results for the different potential models, Figs. 19–20 show the distribution of for the MW only model (purple symbols) and the MW + moving LMC model (green symbols). Among stars at 10–40 kpc (Fig. 19), the distributions are nearly identical. Results for 90∘ are approximately a mirror image of those at 90∘. Overall, the MW only potential yields more stars with 0∘ and 180∘; the MW+LMC models generate more stars with intermediate .
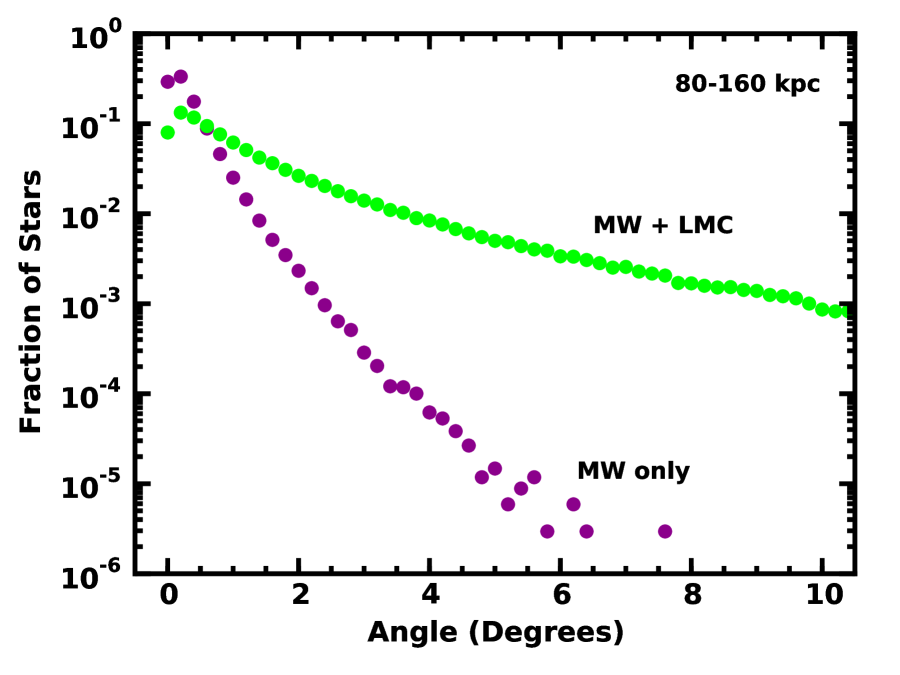
At larger distances (80–160 kpc), the two distributions are clearly different (Fig. 20). Although the disk deflects a few stars traveling through the Galactic plane by 2∘ or more, roughly 96% of unbound stars in the MW only model have 1∘; more than 99.5% have 2∘. Including the LMC potential significantly reduces the number of unbound stars with negligible deflections: only 56% (75%) have 1∘ (2∘); roughly 12% have 5∘.
Two factors cause the large differences in the distributions of for unbound stars. In the MW + LMC potential, roughly 10% of unbound stars pass within 2 (roughly 33∘) of the center of the LMC and are deflected by several deg (Fig. 13; Fig. 16). Another 20% of unbound stars are ejected within 12∘ of the disk midplane; the LMC pulls many of these across the midplane. Together, unbound stars ejected into the midplane or passing close to the LMC comprise nearly all of the distant stars with large in Fig. 20.
Aside from the distinctive frequency distributions of for complete ensembles of HVSs, there are clear differences in the distributions along most lines-of-sight through the Galaxy. Following the same procedure as for our analysis of the distributions for and in Figs. 17–18, we infer the median as a function of distance along various lines-of-sight. For nearby stars ( = 10–40 kpc), the median ’s for MW only and MW+LMC models differ by 02 or less. Using a K–S test, the two populations are almost always consistent with draws from the same underlying population. Among stars at 80–160 kpc, the median ’s differ by as much as 1∘; K–S tests suggest the distributions of are almost never consistent with draws from the same parent population, with very low K–S probabilities of .
In these examples, all-sky samples of unbound HVSs are required to demonstrate that the distribution of for stars along a particular line-of-sight in the MW only potential is not drawn from the same parent population as the ’s for stars ejected into the MW+LMC potential. However, the distribution of within smaller () all-sky samples of unbound HVSs randomly selected from any of our calculations clearly differ from one another and from samples of randomly generated stars on purely radial orbits from the GC. Thus, it should be possible to distinguish some potential models from others with more modest increases in the current sample of HVSs (see also Gnedin et al., 2005; Yu & Madau, 2007).
Changing the LMC mass has little impact on these conclusions. In systems where the LMC mass is a factor of two smaller than our nominal mass, there is substantially less gravitational focusing (Fig. 7). The overdensity of HVSs in the direction of the LMC is then roughly a factor of two smaller than shown in Fig. 16. Because the LMC mass has a limited impact on the velocities of HVSs, the overall shape of the histograms in Figs. 17–18 is unchanged. However, the typical tangential velocities are smaller and it is harder to distinguish the velocity distributions from those with no LMC. Similarly, the typical angle between the position and velocity vectors is smaller in calculations with a lower mass LMC. At 10–40 kpc (Fig. 19), the differences are negligible. Among more distant stars (Fig. 20), the distribution of is roughly midway between those of the pure MW model and the nominal MW+LMC model.
Doubling the nominal mass of the LMC has a somewhat smaller impact on observables. Despite the larger gravitational focusing of a more massive LMC (Fig. 7), stars passing at more than 2–3 LMC scale lengths still feel the gravity of the Galaxy more than the gravity of the LMC. Thus, the increase in the surface density of stars near the LMC is rather small, 25%. In calculations with a heavy LMC, HVSs have larger deflection angles, larger tangential velocities, and larger than HVSs in the nominal MW+LMC model. Among stars with = 10–40 kpc, these differences are negligible. For stars at larger distances, the heavier LMC produces a shallower distribution of with ejection angle (Fig. 20).
We conclude that there are robust observational measures that distinguish HVSs ejected from MW’s with and without an LMC companion. Aside from generating an overdensity of bound and unbound stars in the general direction of the LMC, the gravity of the LMC modifies the distributions of , , and along many lines-of-sight through the Galaxy. Although site lines towards the LMC and the Galactic plane are those most strongly affected, the gravity of the LMC also impacts the observed angle between the current position and velocity of unbound stars at all and .
6 IDENTIFYING UNBOUND HYPERVELOCITY STARS
In previous studies (Bromley et al., 2006; Kenyon et al., 2008, 2014), we have emphasized that the Hills mechanism ejects bound and unbound HVSs from the GC (see also Rossi et al., 2014, 2017). Aside from generating unbound hyper-runaway stars, close interactions of massive stars and supernova explosions in close binary stars also primarily eject stars closely bound to the MW (e.g., Blaauw, 1961; Poveda et al., 1967; Leonard, 1991; Bromley et al., 2009; Kenyon et al., 2014). Nearly all of the bound stars have radial or tangential velocities close to those of indigenous stars in the disk or halo. Identifying the handful of extreme outliers in this population is often tedious (e.g., Brown et al., 2009).
To facilitate the development of robust observing strategies, it is useful to consider the ability of heliocentric observations in recovering unbound stars from one of our simulations. We focus on and . For unbound stars with , we derive the fraction recovered from only one observable, either or . We also consider the fraction of unbound stars recovered from an ensemble of stars selected by either or . Our choice of the 0.75 factor is based on the observed velocity dispersion of bound HVS, which is only twice the local velocity dispersion of halo stars. Choosing a smaller factor leads to a larger confusion between possible HVSs and true halo or thick disk stars (for other approaches to analyzing large sets of observed velocities, see Kollmeier et al., 2009; Li et al., 2012; Zhong et al., 2014; Li et al., 2015; Hawkins et al., 2015; Favia et al., 2015; Hattori et al., 2018a, and references therein).
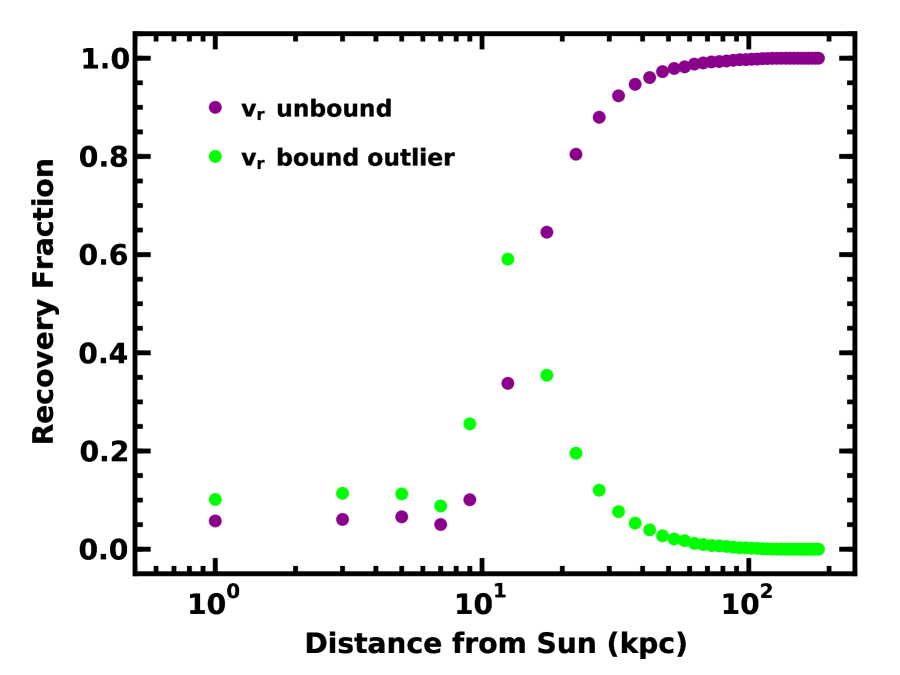
For distant stars ( 20 kpc), the radial velocity recovers the vast majority of unbound stars (Fig. 21). At these distances, HVSs on nearly radial orbits away from the GC have negligible proper motion and tangential velocity. The recovery fraction grows from 60%–70% at 20 kpc to nearly 100% at 100 kpc.
Requiring that the Galactic rest frame radial velocity exceed the local escape velocity underestimates the true fraction of unbound stars by a factor of 10–20 for nearby stars with 10–15 kpc. Among nearby HVSs on nearly radial orbits, the radial velocity is useful only for the fraction with motion directed right at or right away from the Sun (e.g., 0∘ or 180∘). This group is a small fraction of the total sample. For other stars, the radial component of the motion is a small fraction of the total motion; the radial velocity is then similar in magnitude to the typical velocity of other nearby stars.
Selecting stars with is an attractive way to identify nearby HVSs. At 8 kpc, a less restrictive constraint on identifies 1.5–2 times the number of unbound stars. However, the recovery fraction is still small, 10%. Among stars with intermediate distances of 8–15 kpc, however, the selection samples a much larger fraction of solid angle on the sky and recovers 30% to 60% of unbound stars. At still larger distances, the motion becomes more purely radial: stars that are bound based on have little tangential velocity and are truly bound to the MW.
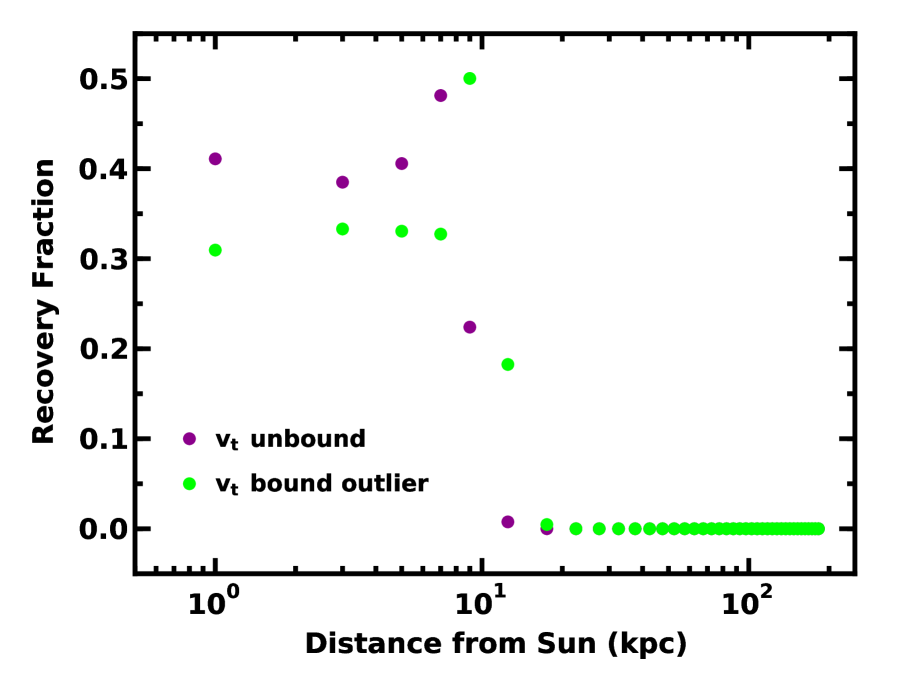
The strengths and weaknesses of the tangential velocity are exactly opposite those of (Fig. 22). Nearby ( 10 kpc), most HVSs move at large tangential velocities relative to the Sun. Searching for stars with identifies 40% to 50% of all unbound stars. Adding in stars with selects another 30% of the unbound stars with 8 kpc and close to 50% of unbound stars at 10 kpc. Together, these two criteria identify 70% to 80% of all unbound stars.
Beyond 10 kpc, provides a very poor way to identify HVSs. At these distances, the tangential component of the motion is simply a small fraction of the total motion.
These results demonstrate that surveys using for nearby stars with 10–20 kpc and for more distant stars with 20 kpc can recover 80% of unbound HVSs ejected from the GC. Because the Sun lies at a distance 8 kpc from the GC, both techniques work rather well for .
Once unbound stars are identified, it is straightforward to pinpoint their origins from the observed and . Along lines-of-sight well away from the disk or the LMC, nearly all unbound stars have 2∘–3∘. For samples of stars with modest errors in , stars ejected from the GC are easily distinguished from runaways ejected from the disk and stars ejected from the LMC or some other location within the Local Group. Within a few deg of the disk, unbound HVSs on nearly radial orbits ( 5∘) are hard to distinguish from unbound runaways ejected at small angles with respect to the Galactic plane. With high quality , however, it should be possible to establish the rotational component of motion for any runaway and use this measurement to separate runaways from HVSs on more radial trajectories. Toward the LMC, gravitational focusing increases the typical for unbound stars. Still, high quality serves to isolate HVS ejected from the GC from other types of high velocity stars.
7 DISCUSSION
Our calculations clarify the impact of the disk and the LMC on the trajectories of HVSs ejected from the GC. Aside from decelerating all HVSs, the disk and the LMC dramatically change the trajectories of HVSs ejected into low Galactic latitudes ( 30∘), pulling stars across the plane and (sometimes) into the inner halo. At higher latitudes, the gravity of the disk and the LMC deflects HVSs from their original radial paths through the halo. These deviations range from a few tenths of a degree for unbound stars to several tens of degrees for bound stars.
The disk and the LMC also generate overdensities of HVSs relative to the initial spatial distribution ejected from the GC. The disk potential concentrates bound HVSs towards the disk. For a reasonable range of MW+LMC potential models, roughly 25% of HVSs ejected with an initial Galactic latitude 40∘ end their lives with 30∘. Although fewer unbound stars are dragged to lower , the fraction of unbound stars with 30∘ is still larger than the fraction with 30∘. The smaller fraction of unbound stars in the halo necessitates an upward revision of 20% to 40% in rate estimates for HVS ejected from the GC.
Calculations that include the LMC potential produce a factor of two overdensity in the sky surface density of stars towards the LMC. Compared to lines-of-sight on opposite sides of the GC, the overdensity extends for 30∘–35∘ from the center of the LMC, which corresponds to two LMC scale lengths. For our adopted LMC potential model, the LMC cannot capture bound stars ejected from the GC: stars reaching apogalacticon within 5–10 kpc of the LMC center simply fall back towards the GC. If the mass of the LMC is larger or more concentrated than we assume, capture of bound HVS increases the overdensity relative to our calculations.
Although we calculate trajectories only for 3 stars, the results are generally applicable to other stellar masses. Ejections from the GC are fairly independent of stellar mass (Bromley et al., 2006; Kenyon et al., 2008; Sari et al., 2010). Although all stars respond to the potential in the same way, the relative mix of bound and unbound stars depends on the stellar lifetime (e.g., Bromley et al., 2006; Kenyon et al., 2008, 2014). Ensembles of lower (higher) mass stars with longer (shorter) main sequence lifetimes have a larger (smaller) number of bound stars relative to the population of unbound stars. Thus, the spatial distribution of higher (lower) mass stars is more (less) spherically symmetric. Deviations from purely radial paths and the overdensity of stars in the direction of the LMC should be somewhat smaller (larger) for more (less) massive stars. Based on several tests of HVS trajectories for 1 and 6 stars, we expect these differences to be less than a factor of two.
This analysis complements proposals to infer the shape of the Galactic halo from the proper motions of HVSs (e.g., Gnedin et al., 2005; Yu & Madau, 2007). For HVSs ejected from the GC at 900 , a triaxial halo deflects trajectories by 02 to 05 at = 10–70 kpc (Gnedin et al., 2005; Yu & Madau, 2007). This deflection is roughly a factor of two larger than the typical deflection for unbound HVSs in a MW only potential (Fig. 20, purple points). Although most HVSs ejected with 70∘ in a MW+LMC potential also have small deflection angles, the LMC deflects those ejected at lower by many degrees. In a large sample of HVSs at 60∘, it should be possible to isolate the deflections of the disk, the LMC, and the triaxial halo. At lower , separating the different contributions to will require samples of several thousand HVSs.
Improved understanding of HVS trajectories throughout the Galaxy provides additional constraints on techniques to infer and from the space motions of HVSs (e.g., Hattori et al., 2018b). When HVSs have purely radial trajectories from the GC, the observed and enable direct estimates on and that depend only on errors in the measured distance, radial velocity, and proper motion for each HVSs. Small deflections from purely radial motion have a modest impact on the derived and . The larger ’s implied by our simulations complicate this picture. While it seems plausible that and can still be inferred from a set of unbound HVSs, it is necessary to use data only for the highest velocity stars where is relatively small.
Our results also extend recent efforts to quantify the response of the MW to the infall of the LMC, the Sgr dwarf, and other less massive galaxies (e.g., García-Ruiz et al., 2002; Bailin, 2003; Weinberg & Blitz, 2006; Purcell et al., 2011; Gómez et al., 2013; Laporte et al., 2017, 2018, and references therein). Previous efforts focused on how the gravity of infalling galaxies might shape the dynamical structure of low velocity stars within the disk and the halo. Our analysis demonstrates that the dynamics of the highest velocity stars in the MW also have an imprint from the gravitational fields of nearby galaxies.
Deriving reliable properties of the MW (and Local Group) from HVSs requires samples much larger than the 20–40 currently available (e.g., Brown, 2015; Boubert et al., 2018; Brown et al., 2018). Despite recent attempts to identify nearby HVSs in Gaia DR2 (Marchetti et al., 2018b; Hattori et al., 2018a), samples of likely unbound stars remain small. Fortunately, it seems plausible that many more HVSs can be discovered among A-type to G-type stars in the outer halo (e.g., Kollmeier & Gould, 2007; Kenyon et al., 2008; Kollmeier et al., 2010; Kenyon et al., 2014; Rossi et al., 2017; Marchetti et al., 2018a). If future surveys reveal these stars, then HVSs can provide unique insights into the dynamics of the Milky Way system.
8 SUMMARY
Two components of the gravitational potential – the Galactic disk and the LMC at roughly 50 kpc from the Sun – modify the radial trajectories of HVSs ejected from the GC. Close to the disk, HVS trajectories bend by as much as 30∘ relative to the original path. Towards the Galactic poles, deflections are a factor of 2–3 smaller. Bound HVSs suffer much larger deflections than unbound stars. Including the LMC in the potential produces larger deflections.
Among large ensembles of HVSs, it is possible to distinguish the purely radial trajectories predicted for a spherically symmetric potential and the deflected trajectories of HVSs in a more realistic potential (see also Gnedin et al., 2005; Yu & Madau, 2007). In principle, variations in the bending with Galactic latitude and longitude provide a way to isolate the contributions from the disk and the LMC. In practice, detecting these differences requires samples of stars.
Aside from bent trajectories, gravitational focusing generates a factor of two overdensity of stars in the direction of the LMC. Although we limit our discussion to predictions for the overdensity for models of HVSs, the extra gravity of the LMC should also attract indigenous halo stars and runaway stars ejected from the disk. The scale of the overdensity on the sky is related to the scale length of the LMC potential.
In any potential model, the Galactic rest-frame radial () and tangential () velocities separately provide a robust way to identify unbound HVSs. Close the Sun ( 10 kpc), the likelihood of finding an HVS moving directly towards or away from us is small. Selecting stars with larger than 75% of the local escape speed robustly finds from 70% to 90% of unbound stars. Despite deflections by the disk or the LMC, tangential motions among more distant HVSs ( 15–20 kpc) are much smaller than the local escape speed. However, requiring that exceeds 75% of the local escape speed then recovers more than 80% of the unbound HVSs. For the highest velocity stars where is small, accurate measurements of and are capable of isolating stars ejected from the GC.
The success of either or in selecting unbound HVSs points to a two-pronged approach for identifying the few HVSs likely to be found within a much, much larger sample of indigenous halo or disk stars. Nearby, accurate distances and proper motions provided by Gaia (for example) can yield robust samples of high velocity stars for future study (e.g., Marchetti et al., 2018b; Hattori et al., 2018a). At larger distances, radial velocity measurements of stars isolated from the disk or halo by optical colors (for example) return physically distinct groups of high velocity stars (e.g., Brown et al., 2006a, 2007, 2009, 2014). If these techniques discover enough high velocity stars, they provide unique constraints on the Galactic potential despite the presence of the disk and the LMC.
We thank the referee for a timely and useful report. Resources supporting this work on the discover cluster were provided by the NASA High-End Computing (HEC) Program through the NASA Center for Climate Simulation (NCCS) at Goddard Space Flight Center.
References
- Abadi et al. (2009) Abadi, M. G., Navarro, J. F., & Steinmetz, M. 2009, ApJ, 691, L63
- Abt (1983) Abt, H. A. 1983, ARA&A, 21, 343
- Bailin (2003) Bailin, J. 2003, ApJ, 583, L79
- Battaglia et al. (2005) Battaglia, G., Helmi, A., Morrison, H., et al. 2005, MNRAS, 364, 433
- Baumgardt et al. (2006) Baumgardt, H., Gualandris, A., & Portegies Zwart, S. 2006, MNRAS, 372, 174
- Besla et al. (2007) Besla, G., Kallivayalil, N., Hernquist, L., et al. 2007, ApJ, 668, 949
- Blaauw (1961) Blaauw, A. 1961, Bull. Astron. Inst. Netherlands, 15, 265
- Boehle et al. (2016) Boehle, A., Ghez, A. M., Schödel, R., et al. 2016, ApJ, 830, 17
- Boubert et al. (2017) Boubert, D., Erkal, D., Evans, N. W., & Izzard, R. G. 2017, MNRAS, 469, 2151
- Boubert & Evans (2016) Boubert, D., & Evans, N. W. 2016, ApJ, 825, L6
- Boubert et al. (2018) Boubert, D., Guillochon, J., Hawkins, K., Ginsburg, I., & Evans, N. W. 2018, ArXiv e-prints, arXiv:1804.10179
- Bovy et al. (2012) Bovy, J., Allende Prieto, C., Beers, T. C., et al. 2012, ApJ, 759, 131
- Boylan-Kolchin et al. (2013) Boylan-Kolchin, M., Bullock, J. S., Sohn, S. T., Besla, G., & van der Marel, R. P. 2013, ApJ, 768, 140
- Bressan et al. (2012) Bressan, A., Marigo, P., Girardi, L., et al. 2012, MNRAS, 427, 127
- Bromley & Kenyon (2006) Bromley, B. C., & Kenyon, S. J. 2006, AJ, 131, 2737
- Bromley et al. (2009) Bromley, B. C., Kenyon, S. J., Brown, W. R., & Geller, M. J. 2009, ApJ, 706, 925
- Bromley et al. (2006) Bromley, B. C., Kenyon, S. J., Geller, M. J., et al. 2006, ApJ, 653, 1194
- Bromley et al. (2012) Bromley, B. C., Kenyon, S. J., Geller, M. J., & Brown, W. R. 2012, ApJ, 749, L42
- Brown (2015) Brown, W. R. 2015, ARA&A, 53, 15
- Brown et al. (2015) Brown, W. R., Anderson, J., Gnedin, O. Y., et al. 2015, ApJ, 804, 49
- Brown et al. (2008) Brown, W. R., Beers, T. C., Wilhelm, R., et al. 2008, AJ, 135, 564
- Brown et al. (2013) Brown, W. R., Cohen, J. G., Geller, M. J., & Kenyon, S. J. 2013, ApJ, 775, 32
- Brown et al. (2009) Brown, W. R., Geller, M. J., & Kenyon, S. J. 2009, ApJ, 690, 1639
- Brown et al. (2012) —. 2012, ApJ, 751, 55
- Brown et al. (2014) —. 2014, ApJ, 787, 89
- Brown et al. (2010) Brown, W. R., Geller, M. J., Kenyon, S. J., & Diaferio, A. 2010, AJ, 139, 59
- Brown et al. (2005) Brown, W. R., Geller, M. J., Kenyon, S. J., & Kurtz, M. J. 2005, ApJ, 622, L33
- Brown et al. (2006a) —. 2006a, ApJ, 640, L35
- Brown et al. (2006b) —. 2006b, ApJ, 647, 303
- Brown et al. (2007) Brown, W. R., Geller, M. J., Kenyon, S. J., Kurtz, M. J., & Bromley, B. C. 2007, ApJ, 660, 311
- Brown et al. (2018) Brown, W. R., Lattanzi, M. G., Kenyon, S. J., & Geller, M. J. 2018, ArXiv e-prints, arXiv:1805.04184
- Bullock & Boylan-Kolchin (2017) Bullock, J. S., & Boylan-Kolchin, M. 2017, ARA&A, 55, 343
- Capuzzo-Dolcetta & Fragione (2015) Capuzzo-Dolcetta, R., & Fragione, G. 2015, MNRAS, 454, 2677
- Cohen et al. (2017) Cohen, J. G., Sesar, B., Bahnolzer, S., et al. 2017, ApJ, 849, 150
- Coughlin et al. (2018) Coughlin, E. R., Darbha, S., Kasen, D., & Quataert, E. 2018, ArXiv e-prints, arXiv:1802.07262
- De Donder et al. (1997) De Donder, E., Vanbeveren, D., & van Bever, J. 1997, A&A, 318, 812
- Dehnen et al. (2006) Dehnen, W., McLaughlin, D. E., & Sachania, J. 2006, MNRAS, 369, 1688
- dos Santos et al. (2017) dos Santos, L. A., Meléndez, J., Bedell, M., et al. 2017, MNRAS, 472, 3425
- Dremova et al. (2014) Dremova, G. N., Dremov, V. V., & Tutukov, A. V. 2014, Astronomy Reports, 58, 291
- Ducati et al. (2011) Ducati, J. R., Penteado, E. M., & Turcati, R. 2011, A&A, 525, A26
- Duquennoy & Mayor (1991) Duquennoy, A., & Mayor, M. 1991, A&A, 248, 485
- Eckart et al. (2017) Eckart, A., Hüttemann, A., Kiefer, C., et al. 2017, Foundations of Physics, 47, 553
- Edelmann et al. (2005) Edelmann, H., Napiwotzki, R., Heber, U., Christlieb, N., & Reimers, D. 2005, ApJ, 634, L181
- Eldridge et al. (2011) Eldridge, J. J., Langer, N., & Tout, C. A. 2011, MNRAS, 414, 3501
- Favia et al. (2015) Favia, A., West, A. A., & Theissen, C. A. 2015, ApJ, 813, 26
- Fox et al. (2013) Fox, A. J., Richter, P., Wakker, B. P., et al. 2013, ApJ, 772, 110
- Fox et al. (2014) Fox, A. J., Wakker, B. P., Barger, K. A., et al. 2014, ApJ, 787, 147
- Fragione & Capuzzo-Dolcetta (2016) Fragione, G., & Capuzzo-Dolcetta, R. 2016, MNRAS, 458, 2596
- Fragione et al. (2017) Fragione, G., Capuzzo-Dolcetta, R., & Kroupa, P. 2017, MNRAS, 467, 451
- Fragione & Loeb (2017) Fragione, G., & Loeb, A. 2017, New A, 55, 32
- Fragione & Sari (2018) Fragione, G., & Sari, R. 2018, ApJ, 852, 51
- Gaia Collaboration et al. (2018) Gaia Collaboration, Helmi, A., van Leeuwen, F., et al. 2018, ArXiv e-prints, arXiv:1804.09381
- García-Ruiz et al. (2002) García-Ruiz, I., Kuijken, K., & Dubinski, J. 2002, MNRAS, 337, 459
- Geier et al. (2015) Geier, S., Fürst, F., Ziegerer, E., et al. 2015, Science, 347, 1126
- Genzel et al. (2003) Genzel, R., Schödel, R., Ott, T., et al. 2003, ApJ, 594, 812
- Gillessen et al. (2017) Gillessen, S., Plewa, P. M., Eisenhauer, F., et al. 2017, ApJ, 837, 30
- Ginsburg & Loeb (2006) Ginsburg, I., & Loeb, A. 2006, MNRAS, 368, 221
- Ginsburg & Loeb (2007) —. 2007, MNRAS, 376, 492
- Gnedin et al. (2010) Gnedin, O. Y., Brown, W. R., Geller, M. J., & Kenyon, S. J. 2010, ApJ, 720, L108
- Gnedin et al. (2005) Gnedin, O. Y., Gould, A., Miralda-Escudé, J., & Zentner, A. R. 2005, ApJ, 634, 344
- Gómez et al. (2015) Gómez, F. A., Besla, G., Carpintero, D. D., et al. 2015, ApJ, 802, 128
- Gómez et al. (2013) Gómez, F. A., Minchev, I., O’Shea, B. W., et al. 2013, MNRAS, 429, 159
- Gould & Quillen (2003) Gould, A., & Quillen, A. C. 2003, ApJ, 592, 935
- Gualandris et al. (2005) Gualandris, A., Portegies Zwart, S., & Sipior, M. S. 2005, MNRAS, 363, 223
- Hamers & Perets (2017) Hamers, A. S., & Perets, H. B. 2017, ApJ, 846, 123
- Hattori et al. (2018a) Hattori, K., Valluri, M., Bell, E. F., & Roederer, I. U. 2018a, ArXiv e-prints, arXiv:1805.03194
- Hattori et al. (2018b) Hattori, K., Valluri, M., & Castro, N. 2018b, ArXiv e-prints, arXiv:1804.08590
- Hawkins & Wyse (2018) Hawkins, K., & Wyse, R. F. G. 2018, ArXiv e-prints, arXiv:1806.07907
- Hawkins et al. (2015) Hawkins, K., Kordopatis, G., Gilmore, G., et al. 2015, MNRAS, 447, 2046
- Heacox (1998) Heacox, W. D. 1998, AJ, 115, 325
- Heber et al. (2008) Heber, U., Edelmann, H., Napiwotzki, R., Altmann, M., & Scholz, R.-D. 2008, A&A, 483, L21
- Hernquist (1990) Hernquist, L. 1990, ApJ, 356, 359
- Hills (1988) Hills, J. G. 1988, Nature, 331, 687
- Hirsch et al. (2005) Hirsch, H. A., Heber, U., O’Toole, S. J., & Bresolin, F. 2005, A&A, 444, L61
- Hogg et al. (2005) Hogg, D. W., Blanton, M. R., Roweis, S. T., & Johnston, K. V. 2005, ApJ, 629, 268
- Huang et al. (2017) Huang, Y., Liu, X.-W., Zhang, H.-W., et al. 2017, ApJ, 847, L9
- Irrgang et al. (2010) Irrgang, A., Przybilla, N., Heber, U., Nieva, M. F., & Schuh, S. 2010, ApJ, 711, 138
- Jethwa et al. (2016) Jethwa, P., Erkal, D., & Belokurov, V. 2016, MNRAS, 461, 2212
- Kafle et al. (2012) Kafle, P. R., Sharma, S., Lewis, G. F., & Bland-Hawthorn, J. 2012, ApJ, 761, 98
- Kenyon et al. (2014) Kenyon, S. J., Bromley, B. C., Brown, W. R., & Geller, M. J. 2014, ApJ, 793, 122
- Kenyon et al. (2008) Kenyon, S. J., Bromley, B. C., Geller, M. J., & Brown, W. R. 2008, ApJ, 680, 312
- King et al. (2015) King, III, C., Brown, W. R., Geller, M. J., & Kenyon, S. J. 2015, ApJ, 813, 89
- Kollmeier & Gould (2007) Kollmeier, J. A., & Gould, A. 2007, ApJ, 664, 343
- Kollmeier et al. (2009) Kollmeier, J. A., Gould, A., Knapp, G., & Beers, T. C. 2009, ApJ, 697, 1543
- Kollmeier et al. (2010) Kollmeier, J. A., Gould, A., Rockosi, C., et al. 2010, ApJ, 723, 812
- Laporte et al. (2018) Laporte, C. F. P., Gómez, F. A., Besla, G., Johnston, K. V., & Garavito-Camargo, N. 2018, MNRAS, 473, 1218
- Laporte et al. (2017) Laporte, C. F. P., Johnston, K. V., Gómez, F. A., Garavito-Camargo, N., & Besla, G. 2017, ArXiv e-prints, arXiv:1710.02538
- Lehner et al. (2015) Lehner, N., Howk, J. C., & Wakker, B. P. 2015, ApJ, 804, 79
- Lennon et al. (2017) Lennon, D. J., van der Marel, R. P., Ramos Lerate, M., O’Mullane, W., & Sahlmann, J. 2017, A&A, 603, A75
- Leonard (1991) Leonard, P. J. T. 1991, AJ, 101, 562
- Levin (2006) Levin, Y. 2006, ApJ, 653, 1203
- Li et al. (2012) Li, Y., Luo, A., Zhao, G., et al. 2012, ApJ, 744, L24
- Li et al. (2015) Li, Y.-B., Luo, A.-L., Zhao, G., et al. 2015, Research in Astronomy and Astrophysics, 15, 1364
- Li et al. (2018) Li, Y.-B., Luo, A., Zhao, G., et al. 2018, ArXiv e-prints, arXiv:1807.00167
- Loebman et al. (2014) Loebman, S. R., Ivezić, Z., Quinn, T. R., et al. 2014, ApJ, 794, 151
- Lu et al. (2007) Lu, Y., Yu, Q., & Lin, D. N. C. 2007, ApJ, 666, L89
- Lu et al. (2010) Lu, Y., Zhang, F., & Yu, Q. 2010, ApJ, 709, 1356
- Marchetti et al. (2018a) Marchetti, T., Contigiani, O., Rossi, E. M., et al. 2018a, MNRAS, 476, 4697
- Marchetti et al. (2018b) Marchetti, T., Rossi, E. M., & Brown, A. G. A. 2018b, ArXiv e-prints, arXiv:1804.10607
- McMillan (2017) McMillan, P. J. 2017, MNRAS, 465, 76
- Miyamoto & Nagai (1975) Miyamoto, M., & Nagai, R. 1975, PASJ, 27, 533
- Monari et al. (2018) Monari, G., Famaey, B., Carrillo, I., et al. 2018, ArXiv e-prints, arXiv:1807.04565
- Napiwotzki & Silva (2012) Napiwotzki, R., & Silva, M. D. V. 2012, Mem. Soc. Astron. Italiana, 83, 272
- Navarro et al. (1996) Navarro, J. F., Frenk, C. S., & White, S. D. M. 1996, ApJ, 462, 563
- Navarro et al. (1997) —. 1997, ApJ, 490, 493
- Nuza et al. (2014) Nuza, S. E., Parisi, F., Scannapieco, C., et al. 2014, MNRAS, 441, 2593
- O’Leary & Loeb (2008) O’Leary, R. M., & Loeb, A. 2008, MNRAS, 383, 86
- Patel et al. (2017a) Patel, E., Besla, G., & Mandel, K. 2017a, MNRAS, 468, 3428
- Patel et al. (2018) Patel, E., Besla, G., Mandel, K., & Sohn, S. T. 2018, ApJ, 857, 78
- Patel et al. (2017b) Patel, E., Besla, G., & Sohn, S. T. 2017b, MNRAS, 464, 3825
- Peñarrubia et al. (2016) Peñarrubia, J., Gómez, F. A., Besla, G., Erkal, D., & Ma, Y.-Z. 2016, MNRAS, 456, L54
- Pereira et al. (2012) Pereira, C. B., Jilinski, E., Drake, N. A., et al. 2012, A&A, 543, A58
- Perets (2009) Perets, H. B. 2009, ApJ, 690, 795
- Perets & Subr (2012) Perets, H. B., & Subr, L. 2012, ApJ, 751, 133
- Pflamm-Altenburg & Kroupa (2010) Pflamm-Altenburg, J., & Kroupa, P. 2010, MNRAS, 404, 1564
- Piffl et al. (2014) Piffl, T., Scannapieco, C., Binney, J., et al. 2014, A&A, 562, A91
- Portegies Zwart (2000) Portegies Zwart, S. F. 2000, ApJ, 544, 437
- Posti & Helmi (2018) Posti, L., & Helmi, A. 2018, ArXiv e-prints, arXiv:1805.01408
- Poveda et al. (1967) Poveda, A., Ruiz, J., & Allen, C. 1967, Boletin de los Observatorios Tonantzintla y Tacubaya, 4, 86
- Press et al. (1992) Press, W. H., Teukolsky, S. A., Vetterling, W. T., & Flannery, B. P. 1992, Numerical recipes in FORTRAN. The art of scientific computing
- Purcell et al. (2011) Purcell, C. W., Bullock, J. S., Tollerud, E. J., Rocha, M., & Chakrabarti, S. 2011, Nature, 477, 301
- Raddi et al. (2018) Raddi, R., Hollands, M. A., Gänsicke, B. T., et al. 2018, MNRAS, arXiv:1804.09677
- Reid & Dame (2016) Reid, M. J., & Dame, T. M. 2016, ApJ, 832, 159
- Reid et al. (2014) Reid, M. J., Menten, K. M., Brunthaler, A., et al. 2014, ApJ, 783, 130
- Renzo et al. (2018) Renzo, M., Zapartas, E., de Mink, S. E., et al. 2018, ArXiv e-prints, arXiv:1804.09164
- Richter et al. (2017) Richter, P., Nuza, S. E., Fox, A. J., et al. 2017, A&A, 607, A48
- Rossi et al. (2014) Rossi, E. M., Kobayashi, S., & Sari, R. 2014, ApJ, 795, 125
- Rossi et al. (2017) Rossi, E. M., Marchetti, T., Cacciato, M., Kuiack, M., & Sari, R. 2017, MNRAS, 467, 1844
- Russeil et al. (2017) Russeil, D., Zavagno, A., Mège, P., et al. 2017, A&A, 601, L5
- Ryu et al. (2017) Ryu, T., Leigh, N. W. C., & Perna, R. 2017, MNRAS, 470, 3049
- Sari et al. (2010) Sari, R., Kobayashi, S., & Rossi, E. M. 2010, ApJ, 708, 605
- Sesana et al. (2006) Sesana, A., Haardt, F., & Madau, P. 2006, ApJ, 651, 392
- Sesana et al. (2007) —. 2007, MNRAS, 379, L45
- Sesana et al. (2009) Sesana, A., Madau, P., & Haardt, F. 2009, MNRAS, 392, L31
- Shen et al. (2018) Shen, K. J., Boubert, D., Gänsicke, B. T., et al. 2018, ArXiv e-prints, arXiv:1804.11163
- Smith et al. (2007) Smith, M. C., Ruchti, G. R., Helmi, A., et al. 2007, MNRAS, 379, 755
- Subr & Haas (2016) Subr, L., & Haas, J. 2016, ApJ, 828, 1
- Tauris (2015) Tauris, T. M. 2015, MNRAS, 448, L6
- Tillich et al. (2009) Tillich, A., Przybilla, N., Scholz, R.-D., & Heber, U. 2009, A&A, 507, L37
- Tremaine et al. (2002) Tremaine, S., Gebhardt, K., Bender, R., et al. 2002, ApJ, 574, 740
- van der Marel et al. (2002) van der Marel, R. P., Alves, D. R., Hardy, E., & Suntzeff, N. B. 2002, AJ, 124, 2639
- Vickers et al. (2015) Vickers, J. J., Smith, M. C., & Grebel, E. K. 2015, AJ, 150, 77
- Wang & Han (2009) Wang, B., & Han, Z. 2009, A&A, 508, L27
- Wang et al. (2018) Wang, Y.-H., Leigh, N., Sesana, A., & Perna, R. 2018, ArXiv e-prints, arXiv:1807.10765
- Watkins et al. (2010) Watkins, L. L., Evans, N. W., & An, J. H. 2010, MNRAS, 406, 264
- Watkins et al. (2018) Watkins, L. L., van der Marel, R. P., Sohn, S. T., & Evans, N. W. 2018, ArXiv e-prints, arXiv:1804.11348
- Weinberg & Blitz (2006) Weinberg, M. D., & Blitz, L. 2006, ApJ, 641, L33
- Xue et al. (2008) Xue, X. X., Rix, H. W., Zhao, G., et al. 2008, ApJ, 684, 1143
- Yu & Madau (2007) Yu, Q., & Madau, P. 2007, MNRAS, 379, 1293
- Yu & Tremaine (2003) Yu, Q., & Tremaine, S. 2003, ApJ, 599, 1129
- Zentner & Bullock (2003) Zentner, A. R., & Bullock, J. S. 2003, ApJ, 598, 49
- Zhang et al. (2010) Zhang, F., Lu, Y., & Yu, Q. 2010, ApJ, 722, 1744
- Zhang et al. (2013) —. 2013, ApJ, 768, 153
- Zhang et al. (2016) Zhang, Y., Smith, M. C., & Carlin, J. L. 2016, ApJ, 832, 10
- Zheng et al. (2014) Zheng, Z., Carlin, J. L., Beers, T. C., et al. 2014, ApJ, 785, L23
- Zhong et al. (2014) Zhong, J., Chen, L., Liu, C., et al. 2014, ApJ, 789, L2
- Ziegerer et al. (2017) Ziegerer, E., Heber, U., Geier, S., et al. 2017, A&A, 601, A58
- Ziegerer et al. (2015) Ziegerer, E., Volkert, M., Heber, U., et al. 2015, A&A, 576, L14
- Zubovas et al. (2013) Zubovas, K., Wynn, G. A., & Gualandris, A. 2013, ApJ, 771, 118
| Description | Variable(s) |
|---|---|
| Gravitational potential | |
| Cartesian system centered on GC, disk midplane has = 0 | |
| Spherical system centered on GC | |
| Cylindrical system centered on GC () | |
| GC longitude (, ) | |
| GC latitude () | |
| Velocity in the GC frame | |
| Heliocentric distance | |
| Heliocentric Galactic longitude | |
| Heliocentric Galactic latitude | |
| Galactic rest frame radial velocity | |
| Galactic rest frame tangential velocity | |
| Heliocentric radial velocity | |
| Heliocentric tangential velocity | |
| Initial GC distance of HVS | |
| Final GC distance of HVS | |
| Initial GC longitude and latitude of HVS | |
| Final GC longitude and latitude of HVS | |
| Initial heliocentric longitude and latitude of HVS | |
| Final heliocentric longitude and latitude of HVS | |
| Initial velocity of HVS | |
| Final velocity of HVS | |
| Main sequence lifetime | |
| Time of ejection from GC | |
| Time of observation |
| Parameter | Symbol | Value |
|---|---|---|
| Mass of central MW black hole | ||
| Mass of MW bulge | ||
| Mass of MW disk | ||
| Mass of MW halo | ||
| Mass of LMC | ||
| Virial mass for MW | 1.7 | |
| Scale length of MW bulge | 105 pc | |
| Radial scale length of MW disk | 2750 pc | |
| Vertical scale length of MW disk | 300 pc | |
| Scale length of MW halo | 20 kpc | |
| Scale length of LMC halo | 15 kpc | |
| Concentration parameter for MW | 12.5 | |
| Distance of Sun from GC | 8 kpc | |
| Orbital velocity of Sun around GC | 235 | |
| Distance of LMC from Sun | 49.66 kpc |
| (Myr) | () | ||||||
|---|---|---|---|---|---|---|---|
| Model | (kpc) | 100 kpc | 8 kpc | 1 pc | 100 kpc | 8 kpc | 1 pc |
| HVz | 250 | 1415 | 1668 | 1680 | 261 | 568 | 918 |
| HVz | 500 | 3786 | 4007 | 4019 | 320 | 598 | 937 |
| HVz | 1000 | 9726 | 9932 | 9944 | 354 | 616 | 949 |
| HVx | 250 | 1415 | 1667 | 1679 | 261 | 579 | 918 |
| HVx | 500 | 3785 | 4006 | 4017 | 320 | 608 | 938 |
| HVx | 1000 | 9725 | 9931 | 9942 | 354 | 616 | 949 |
Note. — Within a pure MW potential, particles are released at rest from a distance and fall toward the GC. The columns list the time to reach a distance and the velocity at for models where infall is along the -axis (HVz) or the -axis (HVx).
| Model | d (kpc) | |||
|---|---|---|---|---|
| HVS3a | 10–20 | 0.919 | 0.058 | 0.023 |
| HVS3a | 20–40 | 0.852 | 0.089 | 0.058 |
| HVS3a | 40–80 | 0.626 | 0.164 | 0.209 |
| HVS3a | 80–160 | 0.112 | 0.147 | 0.742 |
| HVS3b | 10–20 | 0.920 | 0.057 | 0.023 |
| HVS3b | 20–40 | 0.853 | 0.089 | 0.058 |
| HVS3b | 40–80 | 0.634 | 0.162 | 0.204 |
| HVS3b | 80–160 | 0.125 | 0.151 | 0.724 |
| HVS3c | 10–20 | 0.919 | 0.057 | 0.023 |
| HVS3c | 20–40 | 0.853 | 0.089 | 0.058 |
| HVS3c | 40–80 | 0.635 | 0.162 | 0.203 |
| HVS3c | 80–160 | 0.126 | 0.151 | 0.723 |
| HVS3d | 10–20 | 0.920 | 0.057 | 0.023 |
| HVS3d | 20–40 | 0.852 | 0.089 | 0.059 |
| HVS3d | 40–80 | 0.634 | 0.162 | 0.204 |
| HVS3d | 80–160 | 0.125 | 0.152 | 0.722 |
Note. — The columns list the fraction of stars defined as ‘halo-like’ (), ‘bound outliers’ (), and ‘unbound’ () as a function of distance from the Galactic Center for different HVS models with 3 ejected stars: HVS3a: no LMC; HVS3b: stationary LMC at = 49.01 kpc; HVS3c: stationary LMC at = -0.425 kpc, = kpc, and kpc; HVS3d: moving LMC model summarized in the main text.
| Parameter | HVS3a | HVS3b | HVS3c | HVS3d |
|---|---|---|---|---|
| (pc) | 0.7 | -18 | -22 | -4 |
| (pc) | -0.8 | -4.5 | -819 | -280 |
| (pc) | 0.1 | 855 | -512 | -225 |
| () | -0.05 | -0.1 | -0.1 | -0.3 |
| () | -0.09 | 0.0 | -6.5 | -8.8 |
| () | 0.00 | 6.4 | -4.1 | -5.5 |
| () | 175 | 173 | 173 | 173 |
| () | 175 | 173 | 175 | 175 |
| () | 147 | 149 | 147 | 147 |
| (pc ) | 54 | -266 | 23290 | 22300 |
| (pc ) | 41 | 54 | -184 | -452 |
| (pc ) | 0.0006 | 0.005 | -17.4 | -153 |
| (pc ) | 153840 | 223520 | 262540 | 259770 |
| (pc ) | 153830 | 223520 | 185510 | 185960 |
| (pc ) | 5.3 | 5.2 | 163080 | 158430 |
| // (pc) | 2.1 | -4.0 | -5.2 | -14 |
| (pc) | -4.6 | -0.4 | -285 | -800 |
| (pc) | -0.4 | 360 | -226 | -500 |
| () | -0.02 | 0.0 | -0.2 | -0.2 |
| () | -0.01 | 0.0 | -9.0 | -6.4 |
| () | 0.00 | 7.8 | -5.5 | -4.2 |
| (pc ) | 0.3 | -0.02 | -234 | -2575 |
| (pc ) | -0.05 | -0.33 | 365 | 1014 |
| (pc ) | 0.00 | 0.00 | 0.02 | -0.2 |
| (pc ) | 122730 | 134500 | 156550 | 155940 |
| (pc ) | 122820 | 134510 | 124990 | 124840 |
| (pc ) | 3.2 | 3.1 | 67283 | 65405 |
Note. — Results for various observables of the full ensemble of ejected stars in four models of 3 HVSs: HVS3a: no LMC; HVS3b: stationary LMC at = 49.01 kpc; HVS3c: stationary LMC at = -0.425 kpc, = kpc, and kpc; HVS3d: moving LMC model summarized in the main text.