The symbiotic contact process: phase transitions, hysteresis cycles, and bistability
Abstract
We performed Monte Carlo simulations of the symbiotic contact process on different spatial dimensions (). On the complete and random graphs (infinite dimension), we observe hysteresis cycles and bistable regions, what is consistent with the discontinuous absorbing-state phase transition predicted by mean-field theory. By contrast, on a regular square lattice, we find no signs of bistability or hysteretic behavior. This result suggests that the transition in two dimensions is rather continuous. Based on our numerical observations, we conjecture that the nature of the transition changes at the upper critical dimension (), from continuous () to discontinuous ().
I Introduction
Improving our understanding of absorbing-state phase transitions in non-equilibrium systems is of great importance, not only because they occur in a variety of problems, but also display critical behavior and universality Ódor (2004); Dickman and Marro (2005); Henkel et al. (2009). Absorbing states are those at which the dynamics is suppressed and no further changes occur. Examples of these states were found in models of epidemic spreading, opinion formation (Anteneodo and Crokidakis, 2017), population dynamics Sarkar (2015), diffusion-limited aggregation Kartha and Banpurkar (2016); Iannini and Dickman (2017), traffic Antonov et al. (2016), and other non-equilibrium systems Gutiérrez et al. (2017); Takeuchi et al. (2007). Most of these models are characterized by a continuous phase transition that falls into the Directed Percolation (DP) universality class Grassberger (1982); Janssen (1981); Ódor (2004). However, absorbing phase transitions might also be discontinuous. Examples include, the single-species restrictive contact process models, such as the quadratic contact process (QCP) Guo et al. (2007); Liu et al. (2007); Guo et al. (2009); da Silva and de Oliveira (2012); Varghese and Durrett (2013); Fiore and Landi (2014); Fiore (2014); Pastor-Satorras et al. (2015), the Ziff-Gulari-Barshad (ZGB) model for catalysis Ziff et al. (1986); de Oliveria et al. (2015); de Oliveira et al. (2016), and ballistic deposition with anisotropic interactions Dias et al. (2014); Araújo et al. (2015).
The two-species contact process 2SCP was introduced by Oliveira et al. de Oliveira et al. (2012) to study the effects of symbiotic interactions in the contact process (CP) Harris (1974). As in CP, in 2SCP the dynamics of each species evolves through sequences of creation and annihilation, but the rate of annihilation is reduced in the presence of a second species. Oliveira et al. have shown that, in the mean-field limit, the absorbing-state phase transition in 2SCP becomes discontinuous for a wide range of the symbiotic interaction strengths de Oliveira et al. (2012). However, no evidence of a discontinuous transition in two dimensions has been observed from numerical simulations on a square lattice de Oliveira et al. (2012, 2014). Here, we combine Monte Carlo simulations and a mean-field calculation to study the nature of the referred transition. We focus on the stability of the steady state and hysteretic behavior. In the mean-field limit, we confirm that the absorbing-state phase transition might be discontinuous, while in two dimensions it is always continuous and belongs to the Directed Percolation universality class Lübeck (2003); Henkel et al. (2009).
The paper is organized as follows. In Section II we describe the 2SCP model and derive the phase diagram and bistable regions in the mean-field regime. The simulation results for different underlying networks are presented in Section III. In Section IV we draw some final conclusions.
II The Two-species contact process
In the 2SCP two species ( and ) are considered. Each site of a network is either empty or occupied by only one -particle, only one -particle, or two different particles. At a given instant , the state of the site is characterized by a pair of variables , where () if the site is occupied by one -particle (-particle) or () otherwise. The transition from occurs at rate , being the fraction of nearest neighbors (NN) occupied by -particles, independently of . In the same way, the transition from occurs at rate , with the fraction of NN occupied by -particles, independently of . The annihilations and occur at rate of unity, while the ones and occur at rate , i.e., the rate of annihilation is reduced on sites occupied by particles of both species (symbiosis).
In the 2SCP the symbiotic interaction favors the persistence of the doubled occupied sites, and the critical reproduction rate decreases as the parameter is reduced. Moreover, a continuous phase transition in the Directed Percolation universality class, is observed for . The upper critical dimension of this model is the same of the ordinary CP, namely, . From the mean-field equations, it was previously found Ref. de Oliveira et al. (2012) that the phase transition is discontinuous for , with identified as the tricritical point. In what follows, we study the stability of the steady state when the transition is discontinuous.
The state where for all is absorbing. At the system undergoes an absorbing phase transition (de Oliveira et al., 2012, 2014). The mean-field theory for the 2SCP was first derived in Ref. de Oliveira et al. (2012), assuming spatial homogeneity. Defining , , , and as probabilities for a given site to be empty, occupied by only one -particle, only one -particle, or by both species, respectively, they studied the effect of symbiotic interactions by seeking a symmetric solution , which obeys,
| (1) |
and
| (2) |
using the constrain . The absorbing state corresponds to and . The active stationary solutions are given by
| (3) |
and
| (4) |
We define the order parameter as the density of particles , which depends on both parameters . Therefore, taking into account the steady-state solutions, we calculate in the mean-field limit, for all values of the parameters and . We focus in the limit , where the 2SCP undergoes a discontinuous phase transition de Oliveira et al. (2012). Since only has physical meaning, there are three solutions, namely,
| (5) |
| (6) |
and
| (7) |
where the indexes “absorbing”, “active”, and “unstable” refer to the type of solution, as discussed below.
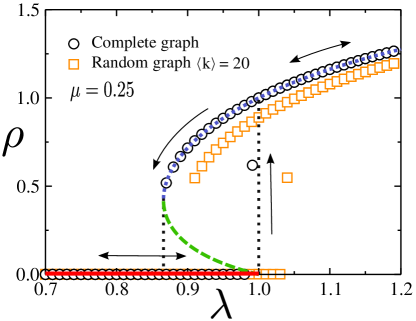
One signature of a discontinuous transition is the presence of hysteretic behavior. Figure 1 shows the hysteresis cycle obtained from the mean-field calculation for the case . The solution (continuous red line) corresponds to the absorbing phase. The solutions (dotted blue line) and (dashed green line) are physical if and , respectively, with . Otherwise, would admit complex values. For the case , we have . However, as discussed next, the solution given by Eq. (7) is always unstable, while the stability of other solutions depends on the values of and .
To analyze the stability of each solution, we consider the Jacobian matrix. The system described by Eqs. (1) and (2) can be written as and . The Jacobian matrix is then
| (8) |
The trace and the determinant of the matrix for each steady-state solution are
| (9) |
| (10) |
| (11) |
and
| (12) |
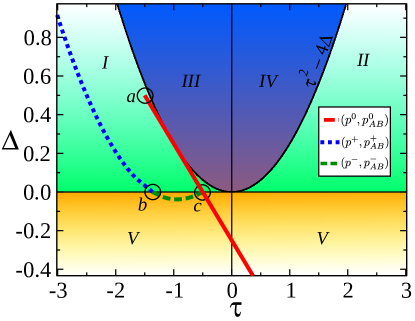
This analysis can be summarized in Fig. 2, which shows the stability diagram of the Jacobian matrix for (the same parameters as in Fig. 1). The diagram is divided into five regions. The regions and correspond to the stable and unstable nodes, respectively. The regions and correspond to the stable and unstable spirals. Finally, the region corresponds to the saddle points, namely, an unstable region. The solution (dashed red line) is conditionally stable, since for , this solution belongs to the region of stable nodes. However, for , the absorbing solution is a saddle node (region ) and becomes unstable. The solution , corresponding to an active phase, is stable if . Notice that in the range either absorbing or actives phases are stable. This range, therefore, bounds the bistable region. Finally, the solution is unconditionally unstable, since for any value of this solution lies in the region of saddle nodes.
III Complete and random graphs
In order to check the histeretic behavior predicted by the mean-field calculation, we performed Monte Carlo simulations of the symbiotic contact process on complete and random graphs. We considered the algorithm described in Ref. de Oliveira et al. (2012). Accordingly, we define as the time increment associated to a given step in the 2SCP simulation and and as the number of sites occupied by one or two species, respectively. At each time step, we choose one of the following events:
-
•
creation attempt at a site occupied only by a single species, with probability ;
-
•
creation attempt at a site occupied by both species, with probability ;
-
•
annihilation of a particle at a site occupied only by a single species, with probability ;
-
•
annihilation of a particle at a site occupied by both species, with probability .
Since the probabilities are normalized, , where is the total number of particles. Moreover, we take on the graphs of active nodes, such that a Monte Carlo step corresponds to one attempt event per node, on average Dickman et al. (1998). Using this algorithm, we follow the time evolution of the 2SCP. However, due to finite-size effects, the absorbing configuration can always be reached, even for , what would immediately suppress the dynamics Dickman et al. (1998); Sander et al. (2016). To circumvent this problem, every time that an absorbing configurations is generated, we perform a spontaneous creation of two particles, one of each species, in sites chosen at random. Notice that this method guarantees that there will be at least one particle of each species at all times.
A complete graph is defined as a structure where each node interacts with all others. Figure 1 shows the density of particles for a complete graph (circles) and random graphs (rectangles) of nodes. The hysteresis cycle was obtained for a fixed value of . For each value of , we allowed the dynamics to evolve for MCS. Next, we increased and decreased by constant intervals , and simulated the dynamics starting from the previous configuration, for each value of Assis and Copelli (2009). Each data point is an average over independent configurations. As can be seen in the Fig. 1, the results for the complete graph are in good agreement with the mean-field solutions. Moreover, both in the complete and random graphs the nature of the hysteretic behavior is consistent with a discontinuous transition.
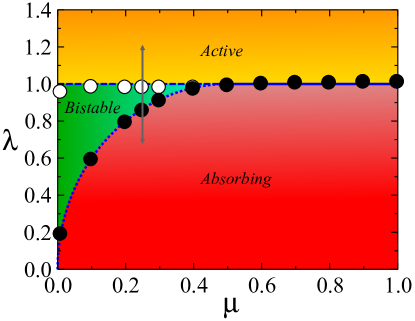
Figure 3 shows the phase diagram of the 2SCP obtained for a complete graph and mean-field solutions, where active, bistable, and absorbing phases are identified. For , the 2SCP undergoes a continuous absorbing-state phase transition. The solid symbols represent the critical parameter obtained by the ratio cumulant Dickman and Marro (2005). The continuous line represents the respective mean-field solution. For , the system undergoes a discontinuous phase transition with a bistable phase, where both the active and absorbing phases are stable. The initial configuration here is an absorbing state for the open symbols and a fully occupied state for the solid symbols. Notice the agreement between the simulated data (symbols) and the mean-field solutions.
IV Regular square lattice
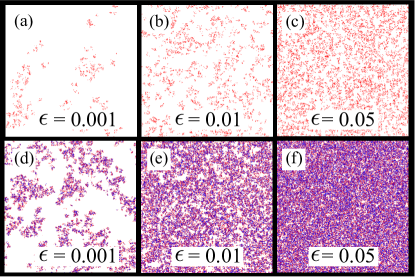
We now consider the 2SCP on regular square lattice. Figure 4 shows snapshots of the ordinary and symbiotic contact processes at the steady state for , where and Dickman et al. (1998) for the ordinary contact process (Figs. 4a-c) and de Oliveira et al. (2012) for the 2SCP (Figs. 4d-f). For both models, the same method described for the complete and random graphs was used to avoid the absorbing state. Notice that, for any value of , the density for actives sites of the 2SCP is always greater than that for the ordinary contact process.
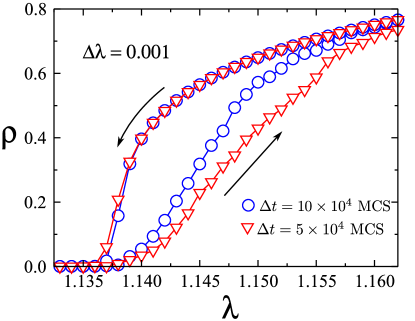
To determine the order of the phase transition on regular lattices, we analyze the hysteresis cycles. We employ the same algorithms used in Section III to produce the states and the hysteresis cycles. Figure 5 shows, for , the order parameter for two cycles in the creation rate . For each cycle, the control parameter is varied in the range at constant intervals . Note that, as we double the value of , the width of the cycle is decreased. This indicates an absence of hysteretic behavior for . Moreover, since the time necessary to reach the steady state diverges at the critical region in the thermodynamic limit, a system that undergoes a continuous phase transition to an absorbing phase should exhibit an hysteresis cycle when the control parameter is varied around its critical value Takeuchi et al. (2007); Assis and Copelli (2009).
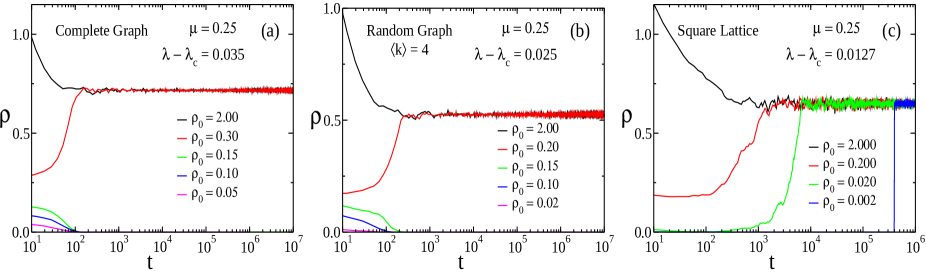
The absence of bistability for the 2SCP on regular square lattices can be studied by evaluating the role of initial conditions on the stationary state, as described in Ref. Assis and Copelli (2009). Considering different values of the initial density of particles, with fixed values of and , we can evaluate the stability of each state. Figure 6 shows the results obtained on a regular square lattice, and on complete and random graphs. The values of and are in a range where a possible bistable region is identified. As expected, for the complete and random graphs (Figs. 6a and b) the stable phase depends on the initial condition considered, reflecting the presence of a bistable region between the absorbing and active phases. However, on a square lattice (Fig. 6c) the active phase is always stable, for all considered initial conditions. This indicates that bistability is not observed for 2SCP on two-dimensional lattices. Moreover, we conjecture that the 2SCP always have a continuous phase transition below the upper critical dimension.
V Conclusions
We have revisited the symbiotic contact process, where two species interact via a reduced death rate , that describes the dynamics of doubled occupied sites, but individually, the dynamics of each species is described by an ordinary contact process. We have shown that, by using a suitable method to generate the quasistationary state (QS), the simulations performed on complete graphs are in accordance with the mean-field solutions. Precisely, these solutions reveal a discontinuous phase transitions, with hysteretic behavior and a bistable phase, where the absorbing and the actives phases are both stables. A bistable region also is detected on random graphs. Considering simulations on regular square lattices, we show the absence of hysteretic behavior and bistable regions, being these properties consistent with a continuous phase transition. Moreover, we conjecture that the 2SCP always undergoes a continuous phase transition for any spatial dimension below the upper critical dimension, but above one-dimensional systems.
Acknowledgements.
We thank the Brazilian agencies CNPq, CAPES, FUNCAP, and the National Institute of Science and Technology for Complex Systems for financial support. NAMA acknowledges financial support from the Portuguese Foundation for Science and Technology (FCT) under Contract no. UID/FIS 00618/2013.References
- Ódor (2004) G. Ódor, Rev. Mod. Phys. 76, 663 (2004).
- Dickman and Marro (2005) R. Dickman and J. Marro, Nonequilibrium Phase Transitions in Lattice Models (Cambridge University Press, 2005), ISBN 978-0521019460.
- Henkel et al. (2009) M. Henkel, H. Hinrichsen, and S. Lübeck, Non-Equilibrium Phase Transitions. Volume 1 (Springer-Verlag GmbH, 2009), ISBN 978-1-4020-8764-6.
- Anteneodo and Crokidakis (2017) C. Anteneodo and N. Crokidakis, Phys. Rev. E 95, 042308 (2017).
- Sarkar (2015) N. Sarkar, Phys. Rev. E 92, 042110 (2015).
- Kartha and Banpurkar (2016) M. J. Kartha and A. G. Banpurkar, Phys. Rev. E 94, 062108 (2016).
- Iannini and Dickman (2017) M. L. L. Iannini and R. Dickman, Phys. Rev. E 95, 022106 (2017).
- Antonov et al. (2016) N. V. Antonov, M. Hnatič, A. S. Kapustin, T. Lučivjanský, and L. Mižišin, Phys. Rev. E 93, 012151 (2016).
- Gutiérrez et al. (2017) R. Gutiérrez, C. Simonelli, M. Archimi, F. Castellucci, E. Arimondo, D. Ciampini, M. Marcuzzi, I. Lesanovsky, and O. Morsch, Phys. Rev. A 96, 041602 (2017).
- Takeuchi et al. (2007) K. A. Takeuchi, M. Kuroda, H. Chaté, and M. Sano, Phys. Rev. Lett. 99, 234503 (2007).
- Grassberger (1982) P. Grassberger, Z. Phys. B Cond. Matt. 47, 365 (1982).
- Janssen (1981) H. K. Janssen, Z. Phys. B Cond. Matt. 42, 151 (1981).
- Guo et al. (2007) X. Guo, D.-J. Liu, and J. W. Evans, Phys. Rev. E 75, 061129 (2007).
- Liu et al. (2007) D.-J. Liu, X. Guo, and J. W. Evans, Phys. Rev. Lett. 98, 050601 (2007).
- Guo et al. (2009) X. Guo, D.-J. Liu, and J. W. Evans, J. Chem. Phys. 130, 074106 (2009).
- da Silva and de Oliveira (2012) F. E. da Silva and M. J. de Oliveira, Comput. Phys. Commun. 183, 2001 (2012).
- Varghese and Durrett (2013) C. Varghese and R. Durrett, Phys. Rev. E 87, 062819 (2013).
- Fiore and Landi (2014) C. E. Fiore and G. T. Landi, Phys. Rev. E 90, 032123 (2014).
- Fiore (2014) C. E. Fiore, Phys. Rev. E 89, 022104 (2014).
- Pastor-Satorras et al. (2015) R. Pastor-Satorras, C. Castellano, P. Van Mieghem, and A. Vespignani, Rev. Mod. Phys. 87, 925 (2015).
- Ziff et al. (1986) R. M. Ziff, E. Gulari, and Y. Barshad, Phys. Rev. Lett. 56, 2553 (1986).
- de Oliveria et al. (2015) M. M. de Oliveria, M. G. E. da Luz, and C. E. Fiore, Phys. Rev. E 92, 062126 (2015).
- de Oliveira et al. (2016) M. M. de Oliveira, S. G. Alves, and S. C. Ferreira, Phys. Rev. E 93, 012110 (2016).
- Dias et al. (2014) C. S. Dias, N. A. M. Araújo, and M. M. Teloda Gama, Phys. Rev. E 90, 032302 (2014).
- Araújo et al. (2015) N. A. M. Araújo, C. S. Dias, and M. M. Telo da Gama, J. Phys. Condens. Matter 27, 194123 (2015).
- de Oliveira et al. (2012) M. M. de Oliveira, R. V. Dos Santos, and R. Dickman, Phys. Rev. E 86, 011121 (2012).
- Harris (1974) T. E. Harris, Ann. Probab. 2, 969 (1974).
- de Oliveira et al. (2014) M. M. de Oliveira, R. Dickman, Phys. Rev. E 90, 032120 (2014).
- Lübeck (2003) S. Lübeck, Phys. Rev. Lett. 90, 210601 (2003).
- Dickman et al. (1998) R. Dickman, A. Vespignani, and S. Zapperi, Phys. Rev. E 57, 5095 (1998).
- Sander et al. (2016) R. S. Sander, G. S. Costa, and S. C. Ferreira, Phys. Rev. E 94, 042308 (2016).
- Assis and Copelli (2009) V. R. V. Assis and M. Copelli, Phys. Rev. E 80, 061105 (2009).