11email: gjmluna@iafe.uba.ar 22institutetext: Universidad de Buenos Aires, Facultad de Ciencias Exactas y Naturales, Buenos Aires, Argentina 33institutetext: Universidad Nacional Arturo Jauretche, Av. Calchaquí 6200, F. Varela, Buenos Aires, Argentina 44institutetext: CRESST and X-ray Astrophysics Laboratory, NASA Goddard Space Flight Center, Greenbelt, MD 20771, USA 55institutetext: Department of Physics, University of Maryland, Baltimore County, 1000 Hilltop Circle, Baltimore, MD 21250, USA 66institutetext: Columbia Astrophysics Lab 550 W120th St., 1027 Pupin Hall, MC 5247 Columbia University, New York, New York 10027, USA 77institutetext: Department of Physics and Astronomy, University of Pittsburgh, Pittsburgh, PA 15260 88institutetext: University College London, Mullard Space Science Laboratory, Holmbury St. Mary, Dorking, RH5 6NT, U.K. 99institutetext: INAF - Istituto di Astrofisica Spaziale e Fisica Cosmica, Via U. La Malfa 153, I-90146 Palermo, Italy 1010institutetext: Departamento de Física y Astronomía, Universidad de La Serena, Av. Cisternas 1200, La Serena, Chile. 1111institutetext: Instituto de Ciencias Astronómicas, de la Tierra y del Espacio (ICATE-CONICET), Av. España Sur 1512, J5402DSP, San Juan, Argentina
Dramatic change in the boundary layer in the symbiotic recurrent nova T Coronae Borealis.
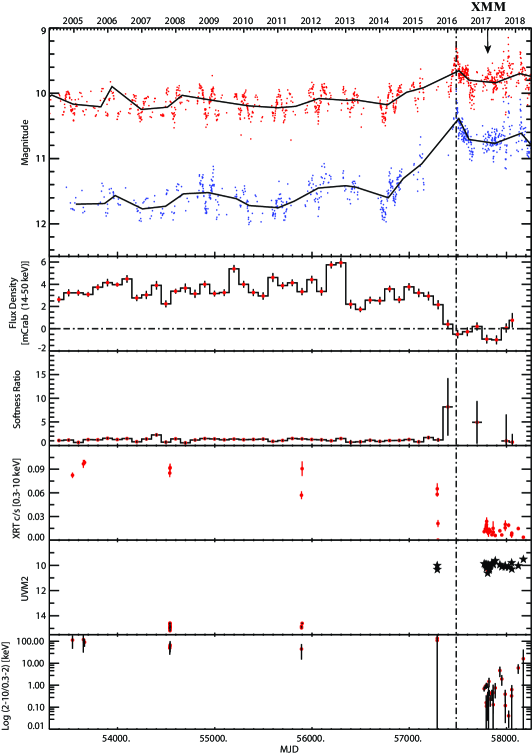
A sudden increase in the rate at which material reaches the most internal part of an accretion disk, i.e. the boundary layer, can change its structure dramatically. We have witnessed such change for the first time in the symbiotic recurrent nova T CrB. Our analysis of XMM-Newton, Swift Burst Alert Telescope (BAT)/ X-Ray Telescope (XRT) / UltraViolet Optical Telescope (UVOT) and American Association of Variable Stars Observers (AAVSO) V and B-band data indicates that during an optical brightening event that started in early 2014 (V1.5): () the hard X-ray emission as seen with BAT almost vanished; () the XRT X-ray flux decreased significantly while the optical flux remained high; () the UV flux increased by at least a factor of 40 over the quiescent value; and () the X-ray spectrum became much softer and a bright, new, blackbody-like component appeared. We suggest that the optical brightening event, which could be a similar event to that observed about 8 years before the most recent thermonuclear outburst in 1946, is due to a disk instability.
Key Words.:
binaries: symbiotic – accretion, accretion disks – X-rays: binaries1 Introduction
The interface between a Keplerian accretion disk and the accreting object is known as the boundary layer. This region, in a Keplerian disk, radiates approximately half of the available accretion luminosity, often in X-ray energies due to its high temperature. The accretion rate determines the optical depth of the boundary layer. A sudden change in the accretion rate can manisfest itself through a brightening in optical/UV and an X-ray fading. Theory predicts a threshold above which the boundary layer will be optical thick to its own radiation and the observed spectrum will be blackbody-like, while below this threshold the spectrum will be that of an optically thin thermal plasma (e.g., Narayan & Popham 1993; Suleimanov et al. 2014).
T Coronae Borealis (T CrB) is one of the four known recurrent novae where the companion is a red giant star, i.e. a symbiotic binary system. In these systems, strong eruptions are triggered by a thermonuclear runaway on the white dwarf (WD) surface after accretion of a critical amount of hydrogen-rich material from the companion. T CrB had recorded nova-type outbursts in 1866 and 1946, when it reached magnitudes as bright as V=3, becoming a naked-eye object in the northern sky. It hosts a massive white dwarf, with MWD=1.2-1.37 (Belczynski & Mikolajewska 1998; Stanishev et al. 2004). Unlike in most symbiotics, in T CrB the M4III (Mürset & Schmid 1999) donor star fills its Roche-lobe (Belczynski & Mikolajewska 1998), and accretion thus proceeds through the L1 point into an accretion disk before reaching the WD surface. The long orbital period of 227.56870.0099 days (Fekel et al. 2000) implies an accretion disk that extends out to the circularisation radius R 1012 cm; i.e. a distance from the WD that has a Keplerian orbit with the same angular momentum that had the transfered material when passed through the Lagrangian internal point L1 (see eq. 5 in Wynn 2008).
In terms of its X-ray spectrum, T CrB is one of five symbiotic stars with X-ray emission sometimes hard and bright enough to be detected with the Neil Gehrels Swift Observatory Burst Alert Telescope (BAT; Gehrels et al. 2004; Kennea et al. 2009). Observations of T CrB with RXTE and Suzaku in 2006 and 2009 showed that the hard X-ray spectrum could be described by a hot, highly absorbed, optically thin thermal plasma from the accretion disk boundary layer (Luna et al. 2008; Iłkiewicz et al. 2016). Suzaku, RXTE and recent NuSTAR observations will be discussed in a forthcoming paper.
The exhaustive historical optical light curve compiled by Schaefer (2014) suggests that T CrB brightened by about 1 mag in V several years ( 8) before both recorded recurrent novae outburst. The origin and frequency of these brightening events is unknown, but they perhaps indicate a change in accretion flow onto the WD. Since the onset of the current optical brightening that started in early 2014, referred to as a ”super-active” state, Munari et al. (2016) found that the luminosity of the ionizing source has increased, leading to a strengthening of high-ionization emission lines such as He II 4686Å and the nebular radiation, which now overwhelms the red giant continuum. Munari et al. (2016), however, only presented observations through December 2015. The light curve from the AAVSO indicates that the maximum brightness was reached around 4-5 April 2016 (see Fig. 1). T CrB was persistently detected with the Swift/BAT since Swift launch in late 2004, until late 2014 when in the span of 4 100-day bins, the BAT 14–50 keV flux declined from 4 mCrab to 2 mCrab, then exhibited a sudden drop to 0 (within 1 sigma) in the following time bin.
In this article we study the super-active state, focusing on the XMM-Newton observation taken about 300 days after the optical maximum. Based on the behavior of the high-energy emission and the nature of the T CrB system, we propose that the super-active state is due to a disk-instability. In Section 2 we describe our dataset while in Section 3 we present the results from the spectral and timing analysis. Section 4 presents our interpretation.
2 Observations.
2.1 Swift
On January 18th 2017 we started a Swift XRT+UVOT monitoring campaign, with observations first every week, then every two weeks, and during the last year, once every month. The Swift/XRT was operated in Photo Counting mode. We extracted source and background count rates from each observation from a circular region with a radius of 20 pixels (47′′) centered on T CrB SIMBAD coordinates (=15h 59m 30.16s; =+25∘ 55′ 12.6′′). We accounted for the presence of dead columns on the CCDs using the tool xrtlccorr.
2.2 XMM-Newton
We observed T CrB on 2017 February 23 (through a DDT time request) using the EPIC camera in Full Window mode, with the medium filter, for 53.8 ks and the OM camera in fast-mode. After removing intervals with high flaring background, the net exposure time reduced to 38.3 ks. Source, background spectra and light curves where extracted from circular regions of 32 and 42 arcsec radii, respectively, with the source region centered on T CrB SIMBAD coordinates and the background in a source-free region of the same CCD. We used the RMFGEN and ARFGEN to build the redistribution matrices and ancillary responses. The resulting X-ray spectra were grouped with a minimum of 25 counts per energy bin. For timing analysis, we converted photon arrival times to the Solar system barycenter using the SAS task barycen.
We emphasize that both grades distribution and offset maps indicate that the Swift and XMM-Newton observations were not affected by optical loading on the X-ray detector, and the softest X-rays in the spectra are real. Very bright optical sources tend to create spurious X-rays photons, or change the grades and energies of X-ray photons in the case of moderately optically bright sources, and we have verified that this is not the case for T CrB.
2.3 Optical/UV photometry.
During each visit with Swift we also obtained UVOT exposures with the UVM2 (2246 Å, FWHM=498 Å) filter. The UVOT light curve was constructed using the uvotproduct tool. Most UVOT observations taken during the current optical brightening are saturated with Vega-magnitudes brighter than about 10. However, we were able to measure source magnitudes using the readout streak, as detailed by Page et al. (2013). Observations with the Optical Monitor (OM) onboard XMM-Newton with the V, U, B, W1 filters were also saturated.
We also collected multi-epoch photometric observations in the V and B bands from the American Association of Variable Star Observers (AAVSO) to study the X-ray data in the context of the optical state. The observations covered a period of 4200 days.
3 Analysis and results.
The XRT flux reached its lowest value since the launch of Swift during our observing campaign that started in 2017 January. Along with the X-ray fading, the XRT spectra have clearly softened, with a soft component dominating the spectra at energies less than about 1 keV. T CrB increased its brightness in UV significantly, from about 15 to brighter than approximately 9.8 UVM2 mag. The upper panel in Figure 1 shows the resulting optical, X-ray and UV light curves.
On 2017 February 23, well into the super-active state, our deep observation with XMM-Newton showed that the EPIC spectra (Fig. 2) are obviously complex, and can be divided into three energy ranges. Above 3 keV, there is a highly absorbed component with prominent emission line complex in the 6–7 keV range, indicative of optically thin, thermal origin. This is likely the same -type component seen in T CrB in its normal state (Kennea et al. 2009; Luna et al. 2013). Below 0.7 keV, the spectra are dominated by a soft, unabsorbed component. A blackbody provide an good description of this region. Photons are also detected in the intermediate energy range (0.7–3 keV). We fit the spectra in two different ways.
In one, all components are absorbed by interstellar absorption and local, partial covering absorption that blocks 99.7% of the emission (model A in Table 1, see also Fig. 2). The soft X-ray spectra consist of blackbody-like emission (with Tbb=4105 K) from a region smaller than the surface of the WD, with a spherical surface area of 4.2107 km2 (in the case of a WD with 1.2 and RWD=5108 cm, this represents approximately 13% of the surface of the WD). The hard (0.6 E 10 keV) spectra were consistent with a multi-temperature, cooling flow, with maximum temperature kTmax=12.9 keV. An alternative to this two-components model, where only the -component is partially-covered by the absorber yielded a blackbody-component spherical surface area of 1.5105 km2 (model A’).
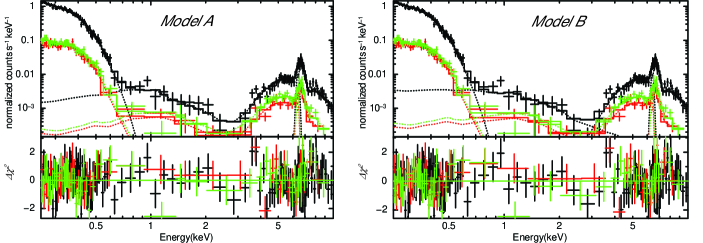
We also studied an alternative model, with three separate thermal components, a soft blackbody-like component, a hard optically thin thermal plasma component and a medium energy optically thin thermal plasma component to take into account photons in the 0.7–3 keV region. The soft, optically thick and medium-energy, optically thin components are modified by mostly interstellar absorption while the hard, cooling flow is affected by full and partial covering absorbers. Although in terms of (0.95/222 d.o.f) this model is also acceptable, parameters such as the absorbing column densities or the covering fraction, are unconstrained. The black-body emitting area in this case was smaller than in model A, with a value of 1.3105 km2 (covering much less than 0.1% of the WD surface; model B in Table 1).
The light curves from the XMM-Newton observation, binned at 300 s, show strong variability with fractional amplitudes of 0.32 in the soft (0.3–0.7 keV) X-ray band and 0.47 in the hard (0.7–10 keV) X-ray band, respectively (Figure 3). The XMM-Newton X-ray light curves did not contain statistically significant periodic modulations. We searched for periodicities in the X-ray light curves (with bins of 300 s) in the 0.3–0.7 and 0.7–10 keV energy ranges by computing the Fourier power spectrum. The log-log power spectrum in the frequency region 0.0033 Hz is dominated by red noise. To search for periods with amplitudes in excess of the red-noise, we modeled the log-log power spectrum with a simple power-law using a Least-squared fit (Vaughan 2005). The detection threshold was determined by simply assuming that the model is a good description of the underlying power spectrum and thus their ratio will be distributed like . We estimated the probability (at a 95 and 99.74% confidence levels) that at a given frequency, a large peak would be present in the periodogram by comparing the ratio of modeled over observed power spectrum to the probability distribution. No peaks in the power spectrum excedeed the detection threshold. None of the power spectra, in any of the selected energy ranges, show periods with a significance greater than 3. Our observations were sensitive to pulsed fraction (following Israel & Stella 1996) greater than 15% for 0.0033 Hz in the 0.3-0.7 keV range and greater than 22% for 0.0033 Hz in the 0.7-10 keV range.

| Parameter | Model A1 | Model B2 |
|---|---|---|
| [1022 cm-2] | 0.0490.002 | 63 |
| [1022 cm-2] | 682 | 39 |
| CFb | 0.9970.001 | 0.6 |
| kTmax [keV] | 12.90.5 | 135 |
| Z/Z⊙ | 1.50.3 | 1.5 |
| [10-9 M⊙ yr-1] | 0.160.01 | 0.170.1 |
| [1022 cm-2] | … | 0.09 |
| kTmid [keV] | … | 4.5 |
| [1022 cm-2] | … | 0.050.01 |
| kTbb [keV] | 0.0350.001 | 0.0350.002 |
| Rbb [km] | 183030 | 10310 |
| Fcf | 61.00.2 | 652 |
| Fmid | … | 0.150.3 |
| Fbb | 860001000 | 2855 |
| Lcf | 47 | 50.5 |
| Lmid | … | 0.12 |
| Lbb | 66800 | 221 |
| /dof | 0.92/226 | 0.95/222 |
4 Discussion.
4.1 The boundary layer and unstable disk
From the spectral models fit to the XMM-Newton EPIC spectra, we consider model A to be the most compelling. While the size of the blackbody-component in models A’ and B are unlikely small to arise from the WD surface or the accretion disk boundary layer, in model A it might well corresponds to the size of the boundary layer. Changes in strength and character of UV and X-rays, along with optical changes reported by Munari et al. (2016); Zamanov et al. (2016); Iłkiewicz et al. (2016), demonstrate that after early 2014, the rate of mass transfer onto the WD, increased and the boundary layer became predominantly optically thick. The non-detection of periodicities in the light curves of both the hard and soft X-rays suggests that the emission is not powered by magnetically-channeled accretion. The stochastic variability in the hard band is, however, expected if the emission arise in the accretion disk boundary layer. Furthermore, the strong variability observed in the soft band and the small area of the blackbody emitting region derived from the spectral model A indicates that this emission is not powered by thermonuclear burning on the WD surface.
At a distance of 806 pc (as recently determined with Bailer-Jones et al. 2018), the unabsorbed luminosity of the blackbody-emitting region is Lbb=T4=6.681035 (d/806 pc)2 ergs s-1, with A being the surface area of a sphere with radius Rbb=1.8108 cm. The UVM2 fluxes indicate that L 21034 (d/806 pc)2 ergs s-1. Assuming that half of the accretion luminosity is radiated in the boundary layer, and that MWD=1.2 and RWD=5108 cm, we found that the accretion rate feeding the optically thick portion of the boundary layer was 6.610-8 (d/806 pc)2 yr-1. The luminosity of the boundary layer is the sum of the luminosity of the optically thick and optically thin cooling flow components, LBL=Lbb+Lcf. The luminosity of the optically thin portion of the boundary layer, from the cooling flow spectral model in the 0.3-50 keV, was L4.71032 (d/806 pc)2 ergs s-1. The accretion rate feeding the optically thin portion of the boundary layer was thus =1.610-10 (d/806 pc)2 yr-1. These accretion rates are consistent with the expected theoretical values where the boundary layer is optically thick/thin to its own radiation (Patterson & Raymond 1985; Narayan & Popham 1993).
The current high optical brightness state appears to be associated with the highest accretion rate on record. The long term optical light curve of T CrB shows a history of different levels of activity (see Stanishev et al. 2004; Munari et al. 2016; Iłkiewicz et al. 2016) and with the exception of the nova eruptions, all of them had lower intensity than the current level. We can rescale, at =806 pc, the reported accretion rates and compare then with the current level. The U-band light curve from May 1979 until August 2002 presented by Stanishev et al. (2004) shows that T CrB was in a low brightness state from JD 2447300 – JD 2450000 (1987 August through 1995 September), while from JD2444300 to JD2447300 (1980 March through May 1988) was in an optical high state. By modeling the IUE spectra during the low and high states, Stanishev et al. (2004) found =1.5310-9 (d/806 pc)2 yr-1 and =1.110-8 (d/806 pc)2 yr-1. Selvelli et al. (1992) analyzed IUE data and suggests that during the decade of 1980, the accretion rate was on average =9.610-9 (d/806 pc)2 yr-1. The optical depth of the boundary layer previous to Swift launch is unknown. Only short pointed X-ray observation of T CrB (2 ks) with Einstein obtained on 1979-02-26 were reported by Cordova et al. (1981), with a 0.1–4.5 keV luminosity of 7.21030 (d/806 pc)2 erg/s. In this energy range, T CrB was even fainter than the current X-ray state. It is unknown, however, if a hard X-ray component existed in the past.
The current brightness state, with 6.610-8 (d/806 pc)2 yr-1 being the highest on record, dramatically changed the structure of the boundary layer, making it mostly thick to its own radiation. NuSTAR observations in Luna et al. (in prep.) support this interpretation. Theory predicts that the transition from mostly optically thin to mostly optically thick should occur at accretion rates of about yr-1 for a 1 M⊙ WD (Popham & Narayan 1995) or even lower values as proposed by Suleimanov et al. (2014). The accretion rate before the optical brightening was therefore likely smaller than a few yr-1.
Phenomenologically, the simultaneous quenching of the hard X-rays, with the remarkable increase in UV flux is exactly what is observed in well-known dwarf novae in outburst. Also, as it is observed in some dwarf novae (Wheatley et al. 2003), in T CrB the maximum temperature of the cooling flow dropped from kTmax=5710 keV as observed with Suzaku in September 2006 (Luna et al. 2008) to kTmax=12.90.5 keV during the XMM-Newton observation reported here. The origin of the residual hard X-ray emission during outburst and the decrease of kTmax, are still a matter of debate and could be related to an accretion disk coronae or the presence of an additional cooling mechanism (see Mukai 2017, for a detailed discussion).
The enhancement of accretion rate in the accretion disk must be due to an increased mass transfer rate from the donor, a disk instability, or both. Although irradiation is cited as a potential cause of enhanced mass transfer in some interacting binaries, it is unlikely to explain the super high state of T CrB. First, the irradiating flux is low: (Munari et al. 2016) used the infrared light curves to infer a temperature increase of the heated side of 80 K, or about 2% increase compared to the unirradiated side, implying an irradiating flux of 8% of the intrinsic stellar flux. Second, Büning & Ritter (2004) concluded that irradiation of a giant donor cannot result to mass transfer cycles. Finally, the time scale on which the envelope of the giant responds to changing irradiation is many thousands of years according to the same authors.
In a steady-state disk, the effective temperature as a function of disk radius is given by (eq. 5.43 in Frank et al. 2002, with R RWD) and has to be greater than 104 K, enough to keep H ionized. In T CrB, with a WD mass of 1.2 and a mass accretion rate 6.610-8 yr-1 (determined from the XMM-Newton observation), the steady-state disk would extend out to about R0.75 R⊙. Given the size of circularisation radius in T CrB, it is highly unlikely that the entire disk can remain in a high state (with T104 K). If the region in the vecinity of the circularisation radius is cold, and unstable with mostly neutral H and low viscosity, then the accreted matter would accumulate near that region until a disk instability develops, allowing the material to flow inwards. A similar inside-stable, outside-unstable, hybrid accretion disk has been discussed for the recurrent novae RS Oph by Wynn (2008) in an attempt to explain how mass is transferred during quiescence periods, given the low accretion rate determined from X-ray observations in quiescence (Nelson et al. 2011). In this scenario, disk instability outbursts in the outer parts of the disk are infrequent, with recurrence time of the order of hundreds of years. Recently, Bollimpalli et al. (2018) studied a similar scenario, where the amount of material necessary to trigger a thermonuclear outburst in RS~Oph every 20 years is delivered to the WD in a series of disk-instability outbursts, with optical brightening amplitudes of about 1 magnitude. A similar scenario could be at work in T~CrB.
4.2 X-ray absorption
X-ray observations from the past decade indicate that the absorbing column was very high during that time (Luna et al. 2008; Kennea et al. 2009; Iłkiewicz et al. 2016), completely covering the source (Luna et al., in prep.) and absorbing all X-rays with energies lower than 2-3 keV. This might lead us to suspect that the blackbody-like spectral component could have been permanently emitting at the current level but was only detected now that there was a favorable sight. However, optical spectra during the past decade (see Munari et al. 2016) indicate that, with the exception of the current super-active state, the intensity of highly-ionized emission lines, such as HeII4686 has been low and the optical continuum weak, in contrast to what is observed now in the super-active state, simultaneous with the appearance of the blackbody-like component. If blackbody-like X-ray emission had been present but absorbed, we would have expected very strong optical line and continuum emission from the absorbing material.
Partial-covering absorber is sometimes inferred for -type symbiotics. However, a covering fraction of 99.7% is extreme. While we cannot exclude a geometrical explanation for this covering fraction, we have also explored a possible alternative. In high accretion rate, non-magnetic CVs, accretion disk wind features are routinely observed in the UV spectra, and perhaps also in the optical spectra (Matthews et al. 2015). It therefore makes sense to ask if the accretion disk wind could be responsible for the partial covering absorption we observe in T CrB in high- state in particular, and in -type symbiotic stars in general. Matthews and others consider a wind mass loss rate of 10-9 M⊙ yr-1 to be a reasonable estimate for an accretion rate of 10-8 M⊙ yr-1; the former is a non-linear function of the latter, such that the fraction of mass lost in the wind is lower for lower accretion rate. Their model (see a schematic in Figure 3 of Matthews et al.) has a biconical geometry with an X-shaped cross section, with wind being launched from 4–12 Rwd. The launch radii may be particularly uncertain as wind is launched from the innermost regions of the disk in other simulations (e.g., Dyda & Proga 2018). We express the mass loss rate in the units of 10-9 M⊙ yr-1 as ; for =1.0, the mass loss rate is g yr-1= g s-1. We further express the characteristic radius of the wind where the line-of-sight to the X-ray emitting region crosses it in the units of 109 cm as , and the wind velocity at the same point in the units of 1000 km s-1 as . Dividing mass loss rate by 4r , for =1.0 and =1.0, we obtain a mass column density expected from a wind of g cm-2, or cm-2.
Given our estimate for the accretion rate in T CrB in the high state of M⊙ yr-1, =3.0 would be a plausible assumption. According to Matthews et al. (2015), it takes the wind of order 100 Rwd to obtain its final velocity, and it has poloidal velocities of less than 100 km s-1 within a few Rwd, so we can try =0.1. Then =2.2 would result in the observed value of cm-2. This admittedly crude estimate suggests that the accretion disk wind is a plausible origin of the local absorber in T CrB in high state.
However, our Model A suggests a partial covering absorber with a covering fraction of 99.7%, and the remaining 0.3% experiences hardly any absorption at all ( cm-2, or less than a thousandth of the column of the partial-covering absorber, and this may well be dominated by the ISM). While the 3D simulation of Dyda & Proga (2018) does show a clumpy wind, the density contrast between the clumps and inter-clump regions is only of order 10. In general (i.e., regardless of whether the absorber is the accretion disk wind or something else), we do have not identified a natural explanation for a near 100% covering fraction and a factor of 1000 density contrast.
The scattering model for CH Cyg of Wheatley & Kallman (2006) may provide a possible alternative to our best-fit spectral model with its extraordinarily high absorption covering fraction. This model requires a low density matter that gets highly ionized, and a clear line of sight to that region. Such a region could exist in the polar cavity of the wind. For this region to remain highly ionized, it cannot be optically thick to X-rays from the central source, which also limits its scattering efficiency. Combined with geometrical factors, it appears plausible for this region to scatter 0.3% of the total luminosity into our line of sight.
In a normal state there are problems for the accretion disk wind as the origin of X-ray absorbers in all -type symbiotic stars. One is that we would expect a strong inclination angle dependence, with little absorption when one is seen pole-on. The other is the accretion rate dependence of the wind mass loss rate. The numbers appear to work for T CrB in the high state. In a normal state, the accretion rate may only be a few times 10-9 M⊙ yr-1, hence the wind mass loss rate is expected to be of order 10-10 M⊙ yr-1 at most. Yet in excess of cm-2 is seen in T CrB in a normal state. If all X-ray absorbers in -type symbiotics are due to accretion disk wind, we would expect a stronger dependence on the accretion rate. Similarly, this model may have difficulty explaining the high values seen in lower X-ray luminosity -type systems.
At the time of submission, the current optically bright state continues. Our finding that the accretion-disk boundary layer around the 1.2 WD in T CrB transitioned from primarily optically thin to primarily optically thick when the accretion rate rose from 10-9 yr-1 to 10-8 yr-1 (assuming d=806 pc) challenges theoretical boundary-layer models, which must also explain BL transitions at much lower accretion rates for some DNe in outburst.
Acknowledgements.
Based on observations obtained with XMM-Newton an ESA science mission with instruments and contributions directly funded by ESA Member States and NASA. We thanks the entire Swift team for accepting and planning our multiple Target-of-Opportunity requests. We thanks Norbert Schartel for approving the XMM-Newton DDT request. We acknowledge with thanks the variable star observations from the AAVSO International Database contributed by observers worldwide and used in this research. We thanks Ulisse Munari for the helpful discussions about the current super-active state. GJML and NEN are members of the CIC-CONICET (Argentina) and acknowledge support from grant ANPCYT-PICT 0478/14. GJML also acknowledges support from grants PIP-CONICET/2011 #D4598. JLS acknowledge support from NASA grants NNX15AF19G and NNX17AC45G.References
- Bailer-Jones et al. (2018) Bailer-Jones, C. A. L., Rybizki, J., Fouesneau, M., Mantelet, G., & Andrae, R. 2018, ArXiv e-prints, arXiv:1804.10121
- Belczynski & Mikolajewska (1998) Belczynski, K. & Mikolajewska, J. 1998, MNRAS, 296, 77
- Bollimpalli et al. (2018) Bollimpalli, D. A., Hameury, J. M., & Lasota, J. P. 2018, ArXiv e-prints, arXiv:1804.07916
- Büning & Ritter (2004) Büning, A. & Ritter, H. 2004, A&A, 423, 281
- Cordova et al. (1981) Cordova, F. A., Mason, K. O., & Nelson, J. E. 1981, ApJ, 245, 609
- Dyda & Proga (2018) Dyda, S. & Proga, D. 2018, MNRAS, 475, 3786
- Fekel et al. (2000) Fekel, F. C., Joyce, R. R., Hinkle, K. H., & Skrutskie, M. F. 2000, AJ, 119, 1375
- Frank et al. (2002) Frank, J., King, A., & Raine, D. J. 2002, Accretion Power in Astrophysics: Third Edition, 398
- Gehrels et al. (2004) Gehrels, N., Chincarini, G., Giommi, P., et al. 2004, ApJ, 611, 1005
- Iłkiewicz et al. (2016) Iłkiewicz, K., Mikołajewska, J., Stoyanov, K., Manousakis, A., & Miszalski, B. 2016, MNRAS, 462, 2695
- Israel & Stella (1996) Israel, G. L. & Stella, L. 1996, ApJ, 468, 369
- Kennea et al. (2009) Kennea, J. A., Mukai, K., Sokoloski, J. L., et al. 2009, ApJ, 701, 1992
- Luna et al. (2008) Luna, G. J. M., Sokoloski, J. L., & Mukai, K. 2008, in Astronomical Society of the Pacific Conference Series, Vol. 401, RS Ophiuchi (2006) and the Recurrent Nova Phenomenon, ed. A. Evans, M. F. Bode, T. J. O’Brien, & M. J. Darnley, 342
- Luna et al. (2013) Luna, G. J. M., Sokoloski, J. L., Mukai, K., & Nelson, T. 2013, A&A, 559, A6
- Matthews et al. (2015) Matthews, J. H., Knigge, C., Long, K. S., Sim, S. A., & Higginbottom, N. 2015, MNRAS, 450, 3331
- Mukai (2017) Mukai, K. 2017, PASP, 129, 062001
- Munari et al. (2016) Munari, U., Dallaporta, S., & Cherini, G. 2016, New A, 47, 7
- Mürset & Schmid (1999) Mürset, U. & Schmid, H. M. 1999, A&AS, 137, 473
- Narayan & Popham (1993) Narayan, R. & Popham, R. 1993, Nature, 362, 820
- Nelson et al. (2011) Nelson, T., Mukai, K., Orio, M., Luna, G. J. M., & Sokoloski, J. L. 2011, ApJ, 737, 7
- Page et al. (2013) Page, M. J., Kuin, N. P. M., Breeveld, A. A., et al. 2013, MNRAS, 436, 1684
- Patterson & Raymond (1985) Patterson, J. & Raymond, J. C. 1985, ApJ, 292, 535
- Popham & Narayan (1995) Popham, R. & Narayan, R. 1995, ApJ, 442, 337
- Schaefer (2014) Schaefer, B. E. 2014, in American Astronomical Society Meeting Abstracts, Vol. 223, American Astronomical Society Meeting Abstracts #223, 209.01
- Selvelli et al. (1992) Selvelli, P. L., Cassatella, A., & Gilmozzi, R. 1992, ApJ, 393, 289
- Stanishev et al. (2004) Stanishev, V., Zamanov, R., Tomov, N., & Marziani, P. 2004, A&A, 415, 609
- Suleimanov et al. (2014) Suleimanov, V., Hertfelder, M., Werner, K., & Kley, W. 2014, A&A, 571, A55
- Vaughan (2005) Vaughan, S. 2005, A&A, 431, 391
- Wheatley & Kallman (2006) Wheatley, P. J. & Kallman, T. R. 2006, MNRAS, 372, 1602
- Wheatley et al. (2003) Wheatley, P. J., Mauche, C. W., & Mattei, J. A. 2003, MNRAS, 345, 49
- Wilms et al. (2000) Wilms, J., Allen, A., & McCray, R. 2000, ApJ, 542, 914
- Wynn (2008) Wynn, G. 2008, in Astronomical Society of the Pacific Conference Series, Vol. 401, RS Ophiuchi (2006) and the Recurrent Nova Phenomenon, ed. A. Evans, M. F. Bode, T. J. O’Brien, & M. J. Darnley, 73
- Zamanov et al. (2016) Zamanov, R., Semkov, E., Stoyanov, K., & Tomov, T. 2016, The Astronomer’s Telegram, 8675