Galaxy Nurseries: Crowdsourced analysis of slitless spectroscopic data
keywords:
notices — galaxies: general — techniques: spectroscopic — methods: data analysisHugh Dickinson
1 The Galaxy Nurseries Project
The Galaxy Nurseries111www.zooniverse.org/projects/hughdickinson/galaxy-nurseries project was designed to enable crowdsourced analysis of slitless spectroscopic data by volunteers using the Zooniverse222www.zooniverse.org online interface. The dataset was obtained by the WFC3 Infrared Spectroscopic Parallel (WISP) Survey collaboration (Atek et al., 2010) and comprises NIR grism (G102 and G141) and direct imaging of 432 fields. The scientific goals of WISP Survey require reliable identification of emission lines (e.g. Masters et al., 2014; Atek et al., 2014). Spectral contamination by overlapping signals from multiple sources or diffraction orders as well as residual artifacts of the data reduction can significantly complicate the automatic detection and identification of emission lines. Visual verification of automatically detected features has proved essential to obtain a pure sample of emission lines.
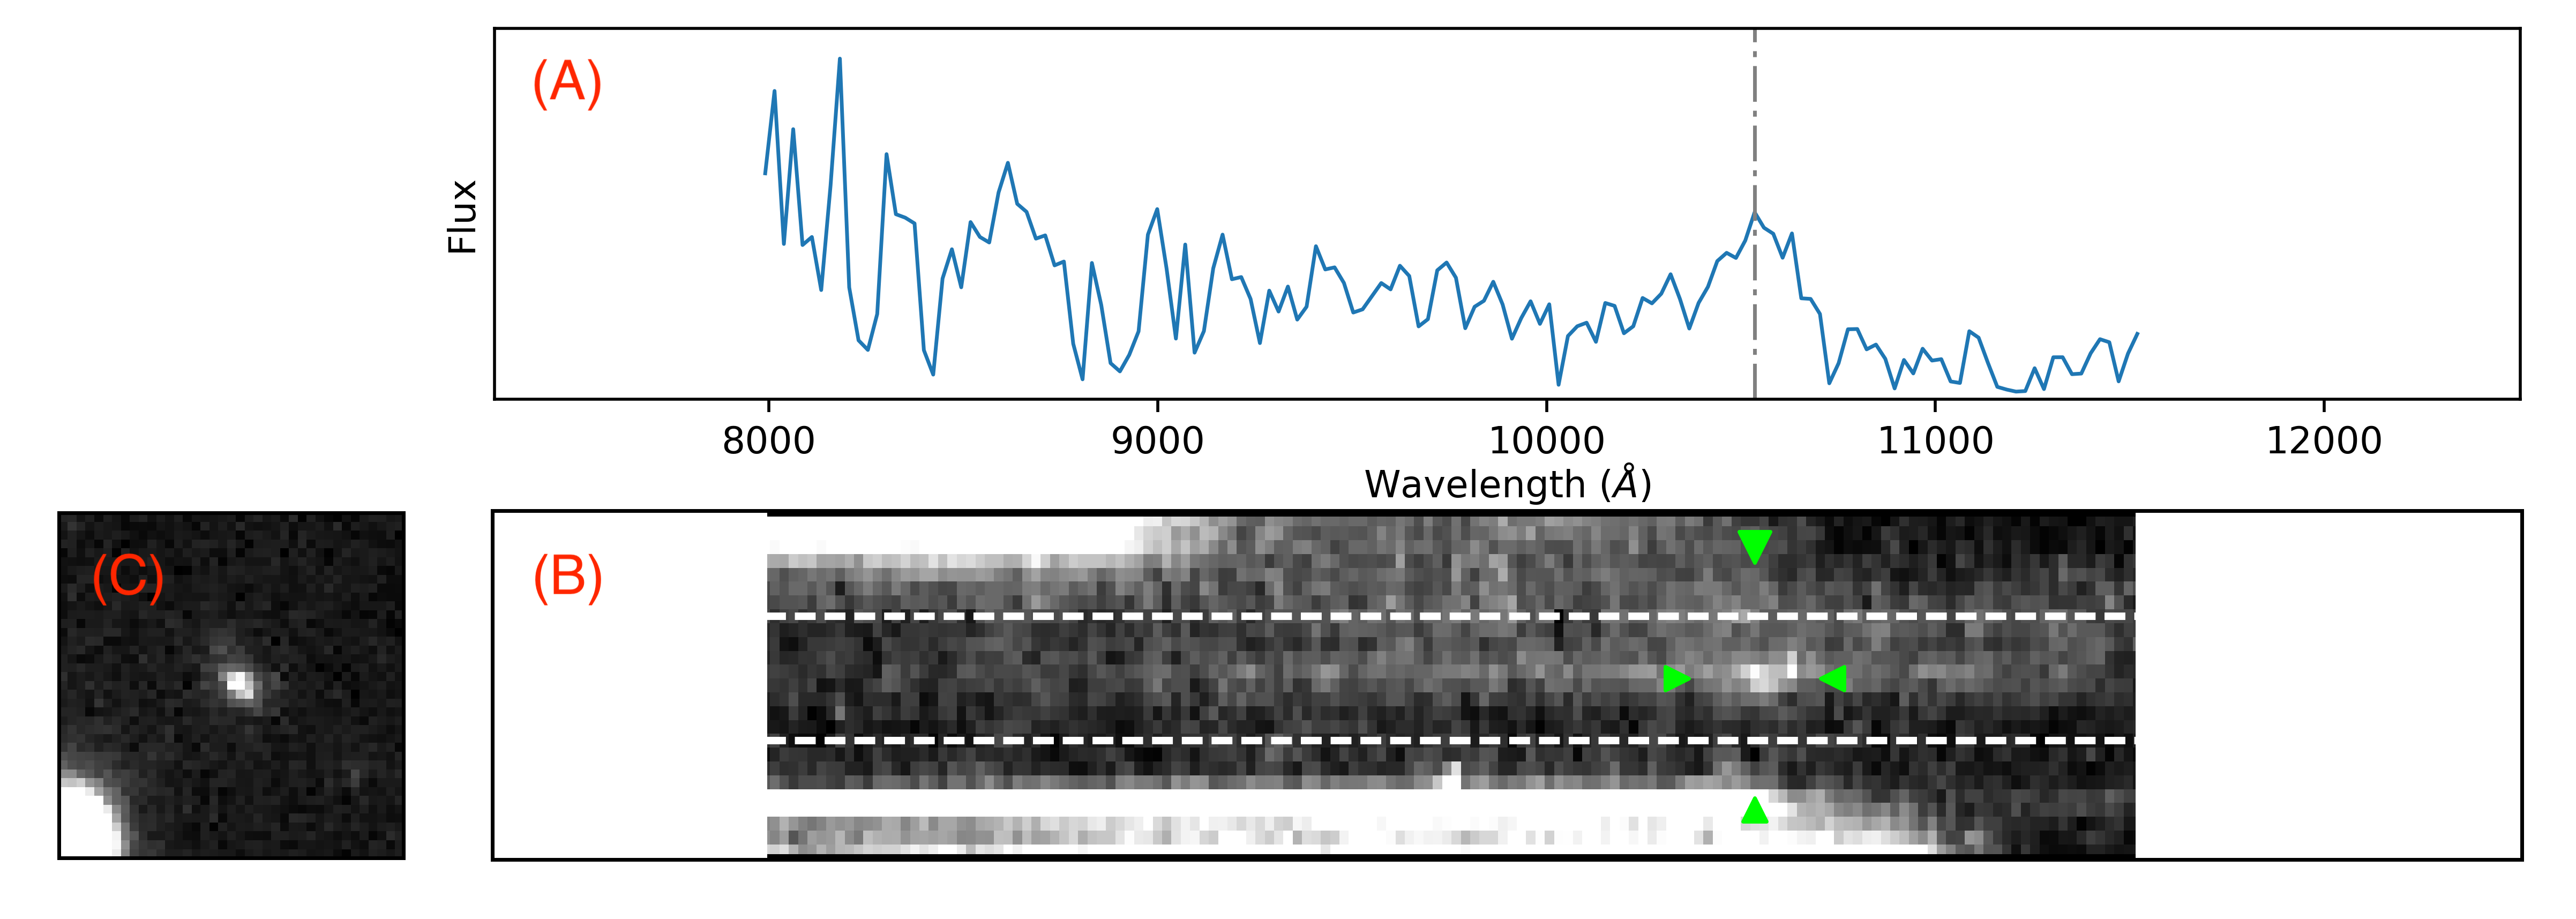
In Galaxy Nurseries verification of putative emission lines was delegated to citizen-scientist volunteers. Data were presented as “subject images” using the fixed format illustrated in the top panels of Figure 1. For each target, volunteers were provided with the two-dimensional spectrum (B), the corresponding one-dimensional extraction (A) and its direct image (C). Volunteers were instructed to evaluate only the feature identified by the green crosshairs and to decide whether it was a genuine emission line or more likely an artifact, providing a Boolean Valued (i.e. “Real” or “Spurious”) label. Following its launch, Galaxy Nurseries was completed in only 40 days, gathering 414,360 classifications from 3003 volunteers for 27,333 putative emission lines. At least 15 classifications were obtained for each subject image. For reference, it took approximately 4.5 months for the full sample of lines to be visually inspected by two members of the WISP Survey Science Team (WSST).
2 Results
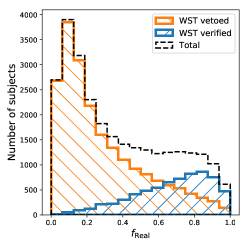
Volunteer responses for each subject were aggregated to compute , the fraction of volunteers who classified the corresponding emission line as “Real”. To evaluate the accuracy of volunteer classifications, their aggregated responses were compared with independent assessments provided by members of the WSST333Full results of the WSST evaluation will be presented in Bagley et al. 2019 (in prep.). The distribution of for all subjects is shown in the bottom-left panel of Figure 1 and is subdivided to identify emission lines that were verified (blue) and vetoed (orange) by the WSST. The relative small number of lines that were validated by the WSST underlines the need for visual inspection of the full sample. Overall, there is a broad agreement between the WSST and volunteers classifications. The distribution of peaks at 0.85 for the sample of verified lines, indicating that the majority of volunteers agree on the reality of these lines. Similarly, the distribution of peaks at 0.1 for the sample of vetoed lines. It is clear, however, that the agreement is not perfect: there is a large number of lines which were vetoed by the WSST and would be classified as real by most of the volunteers (about one third of the objects with have been vetoed by the WSST). The opposite is not true: only a minority of lines with low were in fact real according to the WSST. This result suggests that, with a minimal level of training, volunteers are successful in securely identifying artifacts in the data.
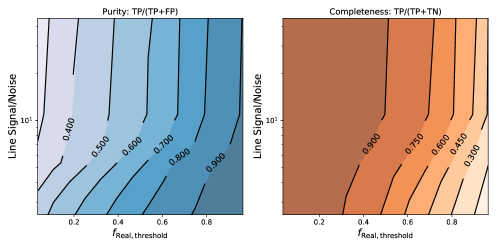
The result is reinforced by a more quantitative analysis that accounts also for the emission line signal-to-noise ratio (). The remaining middle panels of Figure 1 illustrate how the purity ()444The labels T(rue)/F(alse) are assigned to lines verified/vetoed by the WSST, while lines for which greater/smaller than are labeled as P(ositive)/N(egative). and completeness () change as a function of and . These results show that the degree of categorical separation provided by volunteer classifications may be adequate in certain situations. If purity is paramount, then for , choosing yields a sample purity . The corresponding sample completeness is . Conversely, a more complete () albeit impure () sample is feasible for if .
The results of Galaxy Nurseries demonstrate the feasibility of identifying genuine emission lines in slitless spectra by citizen scientists. We recognise that robust scientific analyses typically require samples with higher purity and completeness than raw volunteer classifications provide. Nonetheless, choosing optimal values for allows a large fraction of spurious lines to be vetoed, substantially reducing the timescale for subsequent professional analysis of the remaining potential lines.
Acknowledgements.
HD, CS, and LF acknowledge partial support from the US National Science Foundation Grant AST-1413610. Support for HST Programs GO-11696, 12283, 12568, 12902, 13517, 13352, and 14178 was provided by NASA through grants from the Space Telescope Science Institute, which is operated by the Association of Universities for Research in Astronomy, Inc., under NASA contract NAS5-26555. This publication uses data generated via the Zooniverse.org platform, development of which is funded by generous support, including a Global Impact Award from Google, and by a grant from the Alfred P. Sloan Foundation.References
- Atek et al. (2010) Atek, H., Malkan, M., McCarthy, P., et al. 2010, ApJ, 723, 104, doi: 10.1088/0004-637X/723/1/104
- Atek et al. (2014) Atek, H., Kneib, J.-P., Pacifici, C., et al. 2014, The Astrophysical Journal, 789, 96
- Masters et al. (2014) Masters, D., McCarthy, P., Siana, B., et al. 2014, The Astrophysical Journal, 785, 153