Testing emergent gravity with mass densities of galaxy clusters.
Abstract
We use a sample of 23 galaxy clusters to test the predictions of emergent gravity (EG) (Verlinde, 2017) as alternative to dark matter. Our sample has both weak-lensing inferred total mass profiles as well as x-ray inferred baryonic gas mass profiles. Using nominal assumptions about the weak-lensing and x-ray mass profiles, we find that the EG predictions (based on no dark matter) are acceptable fits only near the virial radius. In the cores and in the outskirts, the mass profile shape differences allow us to confirm previous results that the EG model can be ruled out at . However, when we account for systematic uncertainties in the observed weak-lensing and x-ray profiles, we find good agreement for the EG predictions. For instance, if the weak-lensing total mass profiles are shallow in the core and the x-ray gas density profiles are steep in the outskirts, EG can predict the observed dark matter profile in R200, where R200 is the radius which encloses 200 the critical density of the Universe. The required x-ray and lensing shapes are within the current observational systematics-limited errors on cluster profiles. We also show that EG itself allows flexibility in its predictions, which can allow for good agreement between the observations and the predictions. We conclude that we cannot formally rule our EG as an alternative to dark matter on the cluster scale and that we require better constraints on the weak-lensing and gas mass profile shapes in the region R200.
I Introduction
Galaxy clusters provide a unique opportunity to study gravity in the weak-field regime. They are the only astrophysical objects which provide three simultaneous measures of gravity. We can observe the dynamical properties of clusters through the line-of-sight movement of their member galaxies. We can measure their gas content via the Bremsstrahlung x-ray emission. We can observe the distortion of spacetime through the shearing of the shapes of background galaxies. In turn, each of these needs to produce a consistent picture of the underlying gravitational theory. Our standard cosmological paradigm is based on general relativity (GR) in a de Sitter spacetime with a positive cosmological constant, where the majority of the gravitating mass is in a dark form (Frieman et al., 2008). Clusters should be able to test this theory on a case-by-case basis.
This paper is concerned with one of the biggest mysteries in modern cosmology: the origin of the dark matter, which was introduced to explain the deviation from Newtonian dynamics for galaxy rotation curves (Zwicky, 1933; Rubin and Ford, 1970). Current particle theory favors options such as weakly interacting massive particles, neutrinos and axions (Freese, 2017). Alternatively, modified Newtonian dynamics (MOND) has been shown to provide a phenomenological explanation of the galaxy rotation curves (Milgrom, 1983, 2008; Famaey and McGaugh, 2012).
Recently, there has been an advance in the theory of gravity as an emergent property of the universe. It was shown by Jacobson (1995) that general relativity is an emergent theory and it is possible to derive Einstein’s equations from the concept of entropy of black holes and thermodynamic concepts such as temperature, heat and entropy. The revised emergent gravity (EG) proposal emphasizes the entropy content of space, which could be due to excitations of the vacuum state that manifest as dark energy (Verlinde, 2011, 2017). Briefly, this new EG defines the spacetime geometry as due to the quantum entanglement of structure at the microscopic level. Entropy then describes the information content of a gravitating system and its amount is reflected by the number of microscopic degrees of freedom. In Verlinde (2011), anti-de Sitter space was used to derive the surface entropic contribution around matter. In Verlinde (2017), de Sitter spacetime was implemented in the theory which resulted in an assumed additional bulk volume component to the entropy. This volume contribution grows as the scale-size of a system increases. The excess entropy (over the surface component) results in a scale dependence for gravity as manifested through the elastic spacetime, which in turn mimics an apparent dark matter. This apparent dark matter is a result of the presence of baryonic matter.
Given the observational signature of the gas content as the dominant baryonic component in clusters, as well as the observational signature of the spacetime metric through lensing, galaxy clusters provide a rare opportunity to test EG’s predictions. However, the current model proposed in Verlinde (2017) makes some important simplifying assumptions, such as that objects need to be spherically symmetrical, isolated, and dynamically “relaxed”. In addition to that, Verlinde (2017) assumes that the universe is totally dominated by the dark energy and that implies that Hubble parameter is a constant. Working in a small redshift regime is a good approximation to this assumption as it implies small changes to the Hubble parameter, which makes it to be approximately constant, as well as adds negligible corrections to the measurements due to the small change in the cosmological evolution. The real galaxy clusters which are used in the current work fit well into these assumptions as we do not include in our sample merging systems such as the Bullet cluster, and clusters with high redshifts.
Some progress has been done in testing the EG model using galaxy clusters. Nieuwenhuizen (2017) tested emergent gravity with strong and weak lensing data of Abell cluster (a part of our data sample) and showed that EG fits the data well only with inclusion of neutrinos. Ettori et al. (2019) analyzed 13 clusters with reconstructed hydrostatic mass profiles and in redshift range and concluded that EG provides overall better fit in comparison with MOND, especially at where emergent gravity mass prediction matches hydrostatic mass measurements.
Our goal is to conduct a thorough analysis of all the available in the literature galaxy clusters data. We analyze clusters which cover a wide redshift range () in an extended radial range (). Utilization of this number of clusters helps us to mitigate sample variance, which is a dominant systematic error unaddressed in Nieuwenhuizen (2017). In contrast to Ettori et al. (2019), where only weak lensing uncertainties were analyzed, we include in our analysis systematic uncertainties on the x-ray and weak lensing observables, including biases and additional scatter from the weak lensing inferred total mass profile shapes, biases from x-ray inferred baryon profile shapes, as well as stellar mass contributions and cosmology (via the Hubble parameter).
Moreover, our cluster sample does not have issues that data of Nieuwenhuizen (2017); Ettori et al. (2019) possess: 13 clusters from Ettori et al. (2019) have hydrostatic bias due to nonthermal pressure sources and cluster Abell has discrepancy between mass estimates based on the x-ray data and on the gravitational lensing (Broadhurst et al., 2005) and it was shown by Sereno et al. (2012) that Abell has an orientation bias and the discrepancy could be resolved by dropping spherical symmetry assumption used in deriving weak lensing mass (as it was mentioned above, spherical symmetry is one of the key requirements of the EG model).
While the aim of this work is to utilize mass profiles, dynamical properties of galaxy clusters can be used as well. The idea of using escape velocity profiles of galaxy clusters to place constraints on cosmological parameters was introduced by Gifford et al. (2013); Stark et al. (2017) and it can be similarly applied to test the EG model. It should be noted that this approach has a significant statistical uncertainty due to the projection effects. However, Halenka et al. (2020) resolved this issue and showed that the observed suppression can be modeled by the function that only requires the number of observed galaxies in the projected phase-space.
In Sec. II we introduce the theoretical framework of the EG model. Description of the observational data is presented in Sec. III. In Sec. IV the testing procedure is described as well as constraints of the EG model are presented. Discussion of the results and the conclusions are presented in Secs. V and VI.
For the observational data we assume a flat standard cosmology with , and km s-1 Mpc-1 with . Throughout the paper we refer to the following quantities and which are the radius and the mass of the clusters at the point when the density drops to , where is the critical density of the universe at redshift and . The connection between and is by definition the following: .
II Theoretical framework
In this section we present the main ideas of the EG model (Verlinde, 2017) as well as the equation that provides the connection between baryon matter distribution of the spherically symmetrical isolated non-dynamical system and the apparent dark matter. To do so we adopt the EG description presented in Tortora et al. (2018).
While the original model is derived for an -dimensional surface area111 is used in order not to confuse our reader with which is the integral of the mass density along the line of sight , we work in four dimensional spacetime and in a spherically symmetric approximation, such that the surface mass density is
| (1) |
where and is the total mass inside a radius r
| (2) |
By incorporating quantum entanglement entropy in a de Sitter spacetime, Verlinde (2017) identified a thermal volume law contribution to the entropy of the universe (). Heuristically, one can think of emergent gravity as modifying the law of gravity due to the displacement of in the presence of matter. Tortora et al. (2018) emphasizes the “strain” as the ratio of entropy from the baryonic matter in some volume compared to the entropy from the vacuum expansion of the universe:
| (3) |
where is the acceleration scale (Milgrom, 1983). In regions of normal matter density with a large number of microscopic states , the theory recovers the simple Newtonian equations as a limit to the theory of general relativity. However, as the number of microscopic states becomes small (i.e., in low density regions of the Universe) (), not all of the de Sitter entropy () is displaced by matter. The remaining entropy modifies the normal gravitational laws in the GR weak-field limit (i.e., the Newtonian regime). This gravitational effect can be described by an additional surface density component,
| (4) |
where the subscript refers to the apparent dark matter.
To get the ”mass” of the apparent DM one needs to estimate the elastic energy due to the presence of the baryonic matter. The calculations (see Verlinde (2017)) lead to the following inequality
| (5) |
where is defined in formula 3 and is the spherical region with the area and radius . The r.h.s. of the inequality 5 is the volume which contains an equal amount of entropy with the average entropy density of the universe to the one which is removed by the presence of baryons,
| (6) |
where is the total mass of the baryonic matter inside some radius .
Tortora et al. (2018) notes that most of the recent papers on the EG theory focus on the equality in the expression 5, but there is no particular reason to choose this case as it places the upper bound on the amount of the apparent DM. However, if we work at the maximum we can combine equations 4 and 6 with equality in 5 to get:
| (7) |
To find the apparent dark matter we can differentiate both sides of the Eq. (7)
| (8) |
Equations (7) and (8) provide predictions from the theory to test the data against. We use the observed baryonic matter density through the emitting x-ray gas combined with a total (dark matter plus baryonic matter) inferred from weak lensing to make these tests.
| Cluster name222The original papers are cited above, but actual spherical weak lensing masses (and their respective errors) we use in our analysis were taken from the Sereno (2015) meta catalog. More specifically, Sereno (2015) standardizes the masses for the clusters shown above (as inferred from each reference listed in the ”weak lensing” column) for the fiducial cosmology mentioned in our Introduction. | Redshift | Weak lensing333The abbreviations in this column refer to the following papers: H15= Hoekstra et al. (2015), OK08 = Okabe and Umetsu (2008), OK10 = Okabe et al. (2010), OK15= Okabe and Smith (2016), A14 = Applegate et al. (2014), C04 = Cypriano et al. (2004), D06 = Dahle (2006), P07 = Pedersen and Dahle (2007), U15= Umetsu et al. (2015). We averaged over multiple weak lensing sources to get as well as the errors of the clusters A2219 and A773. | Baryons444The abbreviations in this column refer to the following papers: G17 = Giles et al. (2017), V06 = Vikhlinin et al. (2006), Gi17 = Giacintucci et al. (2017) | ||||||||
| 555Index stands for weak lensing in the Einasto parameters (9) | (Mpc) | 666Index stands for baryon gas in the Einasto parameters (9) | |||||||||
| A1682 | 0.227 | P07 | 6.05 | 1.62 | 6.1 | 65.8 | 4.21 | G17 | 1.62 | 8980 | 2.89 |
| A1423 | 0.214 | OK15 | 6.7 | 1.68 | 5.8 | 71.9 | 4.19 | G17 | 40.5 | 20.8 | 5.08 |
| A2029 | 0.077 | C04 | 10.28 | 2.03 | 5.2 | 86.3 | 4.19 | V06 | 54.0 | 111.6 | 4.2 |
| A2219 | 0.226 | OK10/0K15/A14 | 15.33 | 2.21 | 4.46 | 122.7 | 4.13 | G17 | 4.63 | 6347.8 | 2.95 |
| A520 | 0.201 | H15 | 12.75 | 2.09 | 4.63 | 111.6 | 4.14 | G17 | 0.46 | 97100 | 1.8 |
| A773 | 0.217 | OK15/D06 | 15.45 | 2.22 | 4.43 | 123.7 | 4.13 | G17 | 8.36 | 1670 | 3.36 |
| ZwCl3146 | 0.289 | OK15 | 7.94 | 1.73 | 5.36 | 86.6 | 4.15 | G17 | 1170.0 | 1.8 | 5.38 |
| RXJ1720 | 0.16 | OK10 | 5.38 | 1.59 | 6.43 | 58 | 4.23 | G17 | 250.0 | 7.1 | 5.07 |
| RXCJ1504 | 0.217 | OK15 | 8.26 | 1.8 | 5.46 | 81.2 | 4.18 | Gi17 | 1280.0 | 0.9 | 5.58 |
| A2111 | 0.229 | H15 | 8.08 | 1.78 | 5.38 | 83.5 | 4.17 | G17 | 9.49 | 535 | 3.9 |
| A611 | 0.287 | OK10 | 8.68 | 1.78 | 5.19 | 92.2 | 4.15 | G17 | 260.0 | 6.3 | 5.12 |
| A697 | 0.281 | OK10 | 15.16 | 2.15 | 4.47 | 125.9 | 4.12 | G17 | 3.16 | 11500 | 2.67 |
| A1689 | 0.184 | U15 | 18.86 | 2.4 | 4.2 | 137.2 | 4.12 | Gi17 | 311.0 | 3.9 | 5.29 |
| A1914 | 0.166 | H15 | 11.2 | 2.03 | 4.89 | 99 | 4.16 | G17 | 74.51 | 174 | 3.95 |
| A2261 | 0.224 | OK15 | 18.01 | 2.33 | 4.25 | 135.7 | 4.12 | G17 | 526.0 | 1.1 | 5.79 |
| A1835 | 0.251 | H15 | 16.88 | 2.26 | 4.35 | 131.3 | 4.12 | G17 | 568.0 | 4.9 | 5.15 |
| A267 | 0.229 | OK15 | 9.07 | 1.85 | 5.26 | 87.7 | 4.17 | G17 | 383.0 | 2.2 | 5.48 |
| A1763 | 0.231 | H15 | 14.13 | 2.14 | 4.48 | 120.9 | 4.12 | G17 | 2.19 | 11000 | 2.75 |
| A963 | 0.204 | OK15 | 10.66 | 1.97 | 4.95 | 97.9 | 4.15 | G17 | 2.36 | 14634 | 2.42 |
| A383 | 0.189 | OK15 | 8.06 | 1.8 | 5.54 | 78.2 | 4.19 | V06 | 450.0 | 1.9 | 5.39 |
| A2142 | 0.09 | OK08 | 13.63 | 2.22 | 4.74 | 104.4 | 4.16 | Gi17 | 333.0 | 1.1 | 5.86 |
| RXCJ2129 | 0.234 | OK15 | 7.24 | 1.71 | 5.67 | 75.8 | 4.18 | G17 | 23.8 | 443 | 3.73 |
| A2631 | 0.277 | OK15 | 12.34 | 2.02 | 4.7 | 112.5 | 4.13 | G17 | 1.11 | 36800 | 2.17 |
III Data
We require inferred total mass and baryonic mass profiles for a large set of galaxy clusters. The weak lensing data are given in the NFW formulism Navarro et al. (1996). The baryonic data are given via a profile Vikhlinin et al. (2006). Because we are going to focus on the virial region of clusters, we simplify the analysis by using a single analytical form for all of the mass profiles. There has been much recent work (Merritt et al., 2006; Miller et al., 2016) on the dark matter mass profiles of clusters in simulations that show that the preferred profile is close to an Einasto form (Einasto, 1965). A great advantage of the Einasto parametrization over the NFW or the form in the context of gravitational studies is that it predicts a fixed mass of a cluster, i.e. (2) converges to a particular number. The Einasto profile is described by
| (9) |
where , is the scale radius, is the normalization and is the power index. Below, we discuss how we convert between the Einasto and the NFW or models, as well as the implication of this profile homogenization.
III.1 Total mass profiles
We are using Sereno meta catalog (Sereno, 2015) as a source of weak lensing data of the galaxy clusters. The weak lensing parameters are presented in the NFW form (Navarro et al., 1997)
| (10) |
where and are two parameters of the model and we can define concentration parameter , which describes the overall shapes of the density profiles. Sereno (2015) uses the following relationship between and
| (11) |
where , , , (Duffy et al., 2008).
We convert the NFW profiles to the Einasto form (9). Sereno et al. (2016) has already showed that both the NFW and the Einasto density profiles are nearly identical outside the core region of clusters up to . We confirm this and find that the Einasto parametrization can recreate a given NFW profile in the region to less than 1% accuracy. This defines the statistical floor of our total mass profiles. We include additional error on the total mass profiles from the published errors in (Sereno, 2015).
The use of a specific mass versus concentration relationship adds a systematic uncertainty from the observations. The average concentration of our sample is and individual concentrations are in the range . We also explore the effect of an additional systematic error in the concentrations on our conclusions.
III.2 Baryon profiles
In what follows we are using only the gas density profile as a source of baryon density while neglecting stellar mass contribution as it is around or less than of the overall baryon mass for the clusters with the masses of the clusters we use in our analysis (Giodini et al., 2009; Andreon, 2010; Laganá et al., 2013). We will test the assumption of neglecting stellar contribution later in the text. Also, we do not take into account the brightest cluster galaxy (BCG) in each of the galaxy clusters, since it was shown by ZuHone and Sims (2019) that the BCG contribution is negligible outside kpc (in our analysis, we focus on the region outside which is kpc for the analyzed clusters (see table 1)). The gas density profiles are taken from several sources Giles et al. (2017); Vikhlinin et al. (2006); Giacintucci et al. (2017). Unlike the weak lensing data, the baryon density uncertainties are not reported in the papers from which the data used in this work were extracted.
Giles et al. (2017); Vikhlinin et al. (2006) use beta profile to infer the baryon density distribution,
| (12) |
where and are the number densities of protons and electrons in a gas, is the characteristic radius and is the central density. Giles et al. (2017) uses the same profile but without the second term in the sum, i.e. without .
To get the actual baryon matter density distribution, relation 12 is used (Vikhlinin et al., 2006),
| (13) |
where is the proton mass.
Giacintucci et al. (2017) uses so called double beta model that provides the number density of the electrons in the gas
| (14) |
where is the central density, the rest of the parameters are free parameters and in order to infer the baryon matter profile the following relation is used (Schellenberger and Reiprich, 2017)
| (15) |
We transform the beta profiles into Einasto profiles in the identical manner as the NFW profiles (see subsection III.1). The Einasto profile recreates the beta profile with a high precision in the region from around the core until (see Fig. 1). While we chose to transfer beta to the Einasto profile in the region up to , we could do this procedure with almost identical accuracy in the region up to .
We note that like for the case of the weak lensing profiles, the shapes of the baryon profiles are systematics limited. In Eq. (12), the parameter governs the shape of the baryon profile in the outskirts. Large values indicate steeper slopes. Vikhlinin et al. (2006) applies an upper limit of and his original sample has . On the other hand, the fits to our subset of the cluster data by Eq. (12) have significantly shallower slopes at . Uncertainties on are not available, and so like concentration in weak lensing NFW fits, we explore systematic errors in this parameter later on.
III.3 Dark matter profiles
In what follows, we treat the weak lensing masses as total masses of the galaxy clusters and the dark matter mass is calculated as
| (16) |
where , and are the total mass, the dark matter mass and the baryon matter mass of a cluster.
III.4 The clusters
We list all the 23 clusters in the Table 1. The average mass of our set of 23 observed galaxy clusters is while individual masses are in rather broad range . To create a list of galaxy clusters used in this work, the following selection procedure was followed. The first criteria is the data availability, i.e. only clusters with the available in the literature weak lensing and baryon density profiles were selected. The second stage is to remove from the sample merging systems (e.g., the Bullet cluster) and clusters with high redshifts (e.g. BLOXJ1056 with ). All of the clusters have rather small redshifts () and that fits well into approximation made by the EG theory, i.e. constant Hubble parameter. However, we will still test this assumption later in the current manuscript.
IV Testing emergent gravity
We have two ways of comparing the EG model with the data. The first one is based on Eq. (7) such that we compare the observed baryon mass profile to the one predicted from the “observed” dark matter profile. Recall from Section III.3 that the observed dark matter profile is actually the total mass profile from weak lensing minus the observed baryon profile. The second approach is based on Eq. (8) that represents the opposite situation. In this case, we use the observed baryon profile to make a prediction for the dark matter profile and compare that to the “observed” dark matter profile.
IV.1 Qualitative assessment of the EG model
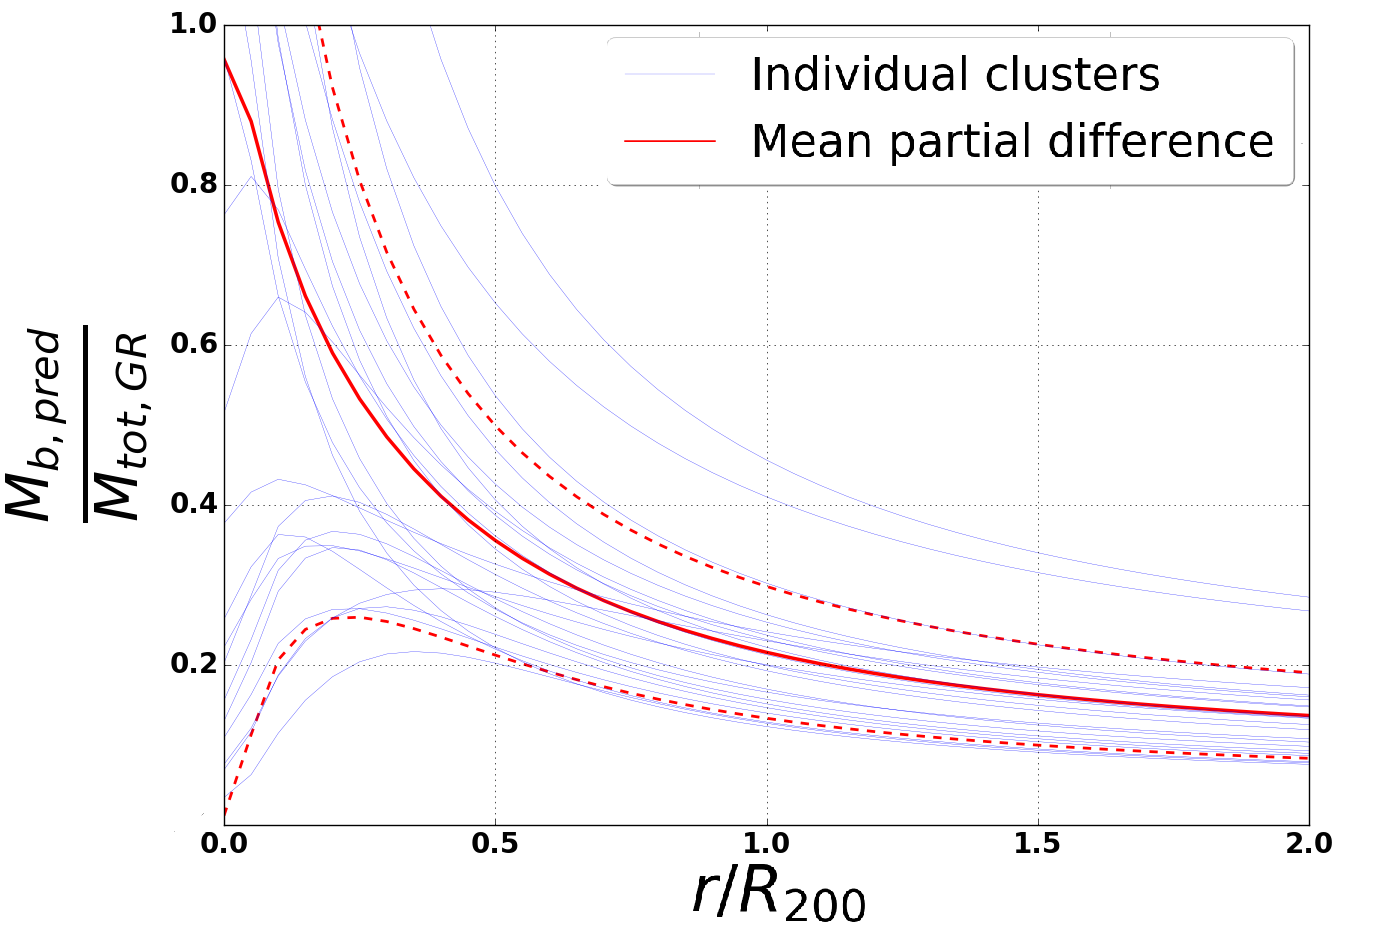
Fig. 2 shows the results of applying Eq. (7) that makes a prediction for the baryon profile from the dark matter profile. The red line is the observed baryon profiles using the x-ray data and including a 10% additional stellar component. The blue line comes from applying Eq. (7) using the dark matter mass profile from Eq. (16). We note that for clarity in Figs. 2 and 3, we normalized each cluster baryon profile by its value at . Actual radii (in terms of Mpc) were used in all of the statistical analyses. The solid lines represent the means of the samples and the dashed lines the observed 1 scatter from the 23 systems. We find that the data (red) and the model (blue) agree at and beyond. However, EG predicts that the majority of the baryons are enclosed within the cluster core. Specifically, EG predicts that 50% of the baryons are within . However, the observed baryons do not reach 50% until .
Fig. 3 shows the results of applying Eq. (8) that makes a prediction for the dark matter profile from observed baryon profile. The red line is from the observed dark matter profiles. The blue line comes from applying Eq. (8) to the observed baryon profiles. The solid lines represent the means of the samples and the dashed lines the observed 1 scatter from the 23 systems. We normalize each of the cluster’s dark matter profiles by its value at the weak-lensing inferred in order to conduct a combined analysis of all 23 galaxy clusters.
From Figs. 2 and 3 we find a qualitative agreement between the observations and EG theory. A key success of the theory is the amplitude it predicts as it is close to what we observe near the virial radius. In other words, using just the observed baryons, EG predicts the observed dark matter mass at . Likewise, the difference between the total weak-lensing inferred mass and the baryon mass at is predicted from EG using just the baryons alone. However, differences become apparent at smaller and larger777One can notice strange behaviour in EG predictions at high radii which is especially noticeable on Fig. 2, where starts to decrease at . This result can be derived analytically: Eq. (7) leads to assuming convergence of to a constant number at high radii. radii. Unfortunately, the observed baryon profiles are not highly constraining in the core regions and in the outskirts of clusters. The cores of clusters are active environments with varying levels of astrophysical processes which could alter the profiles. Likewise, x-ray surface brightnesses drop steeply beyond , to the point where it becomes impossible to constrain the gas density profile out beyond the virial radius. We discuss these issues in the next subsections. In the meantime, we can first apply a more stringent quantitative comparison in the region where the data is more certain.
IV.2 Data analysis and statistical constraint of the EG model
To compare the EG model with the data we apply fitting procedure which is based on minimization of
| (17) |
where is given by the r.h.s. of the Eq. (8) (the apparent dark matter prediction by the EG model) while and are provided by the weak lensing data. The relevant quantity to compare the model to the data is a reduced , which is calculated as , where is the number of degrees of freedom.
As shown previously, the best qualitative agreement is the radial region around the virial radius. In what follows, we measure each of the cluster mass profiles with a step and for example in the range from to that gives us data points per clusters and data points in total as we have 23 clusters in our data sample. The total since the Einasto matter density model has three free parameters.
In spite of the fact that at the predicted by the EG model the apparent dark matter is similar to the observed dark matter, quantitatively we find that the profiles predicted by EG differ from the observed profiles by . The best agreement we find is within the narrow range , where the EG model is only ruled out at the level.
Having uncertainties of the baryon density profiles could not easing significantly the level of the precision of the constraint of the EG model. To confirm this statement we add some error of the baryon profiles by treating in the formula (17) as a sum of the squares of the errors of the weak lensing () and baryon masses (), i.e. . Placing uncertainties on the baryon matter even half of the uncertainties of the weak lensing data [i.e. ] does not decrease significantly the level of constraining EG model in the range as it is still . However, with these baryon matter uncertainties the EG model is compatible with the observations at almost level in the ”narrow” range.
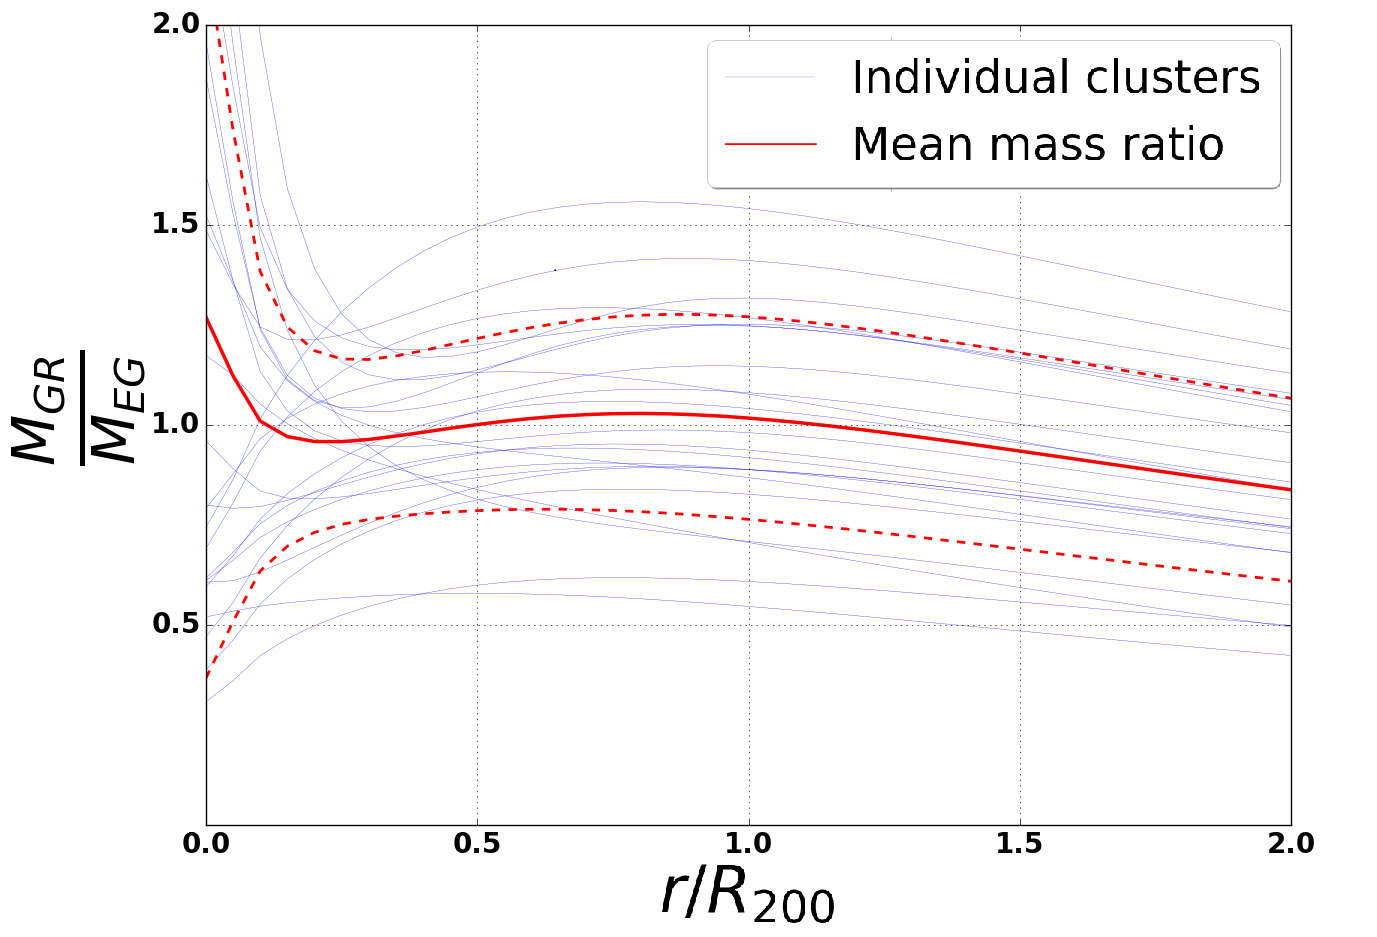
Given that the amplitude predicted by EG is reasonably well represented by the model, we focus our comparison on the profile shapes. Fig. 4 shows the mass ratio of the observed dark matter () and the predicted by the EG model apparent dark matter (). One can see that the observed dark matter is almost two times higher than the apparent dark matter in the area close to the cores () of the galaxy clusters (around 40% higher at ) and it can also be seen that the mass profiles of the dark matter and the apparent dark matter are very different. EG underestimates the dark matter mass in the regions closer to the core while overestimating the mass in the regions beyond approximately . At the current stage we must claim that the EG model is unable to describe the real observational data at Mpc scales.
IV.3 Systematic uncertainty from concentration
As it was discussed above (see subsection III.1), the mass-concentration relation of the galaxy clusters is a source of systematic uncertainty. We can include these systematics in the following way: in the formula (17) is now a sum of statistical and systematical uncertainties, i.e. . We neglect here as discussion of the baryon uncertainty was done in the previous subsection. We define as the difference between the true value of the [i.e. at the concentration which is given by the data (11)] and (at the concentration motivated by Groener et al. (2016)),
| (18) |
Through this technique, we allow the systematic uncertainty in the concentration to impact the uncertainty on the amplitude of the profiles, but not the shape. We consider the effect of systematic uncertainties by concentrations up to . We focus our analysis only on the range () where the mass densities are measured with the step . The effect of the systematic uncertainty starts to be noticeable at were the median . This effect pushes the constraint level down to and at the EG model is compatible with the observations at .
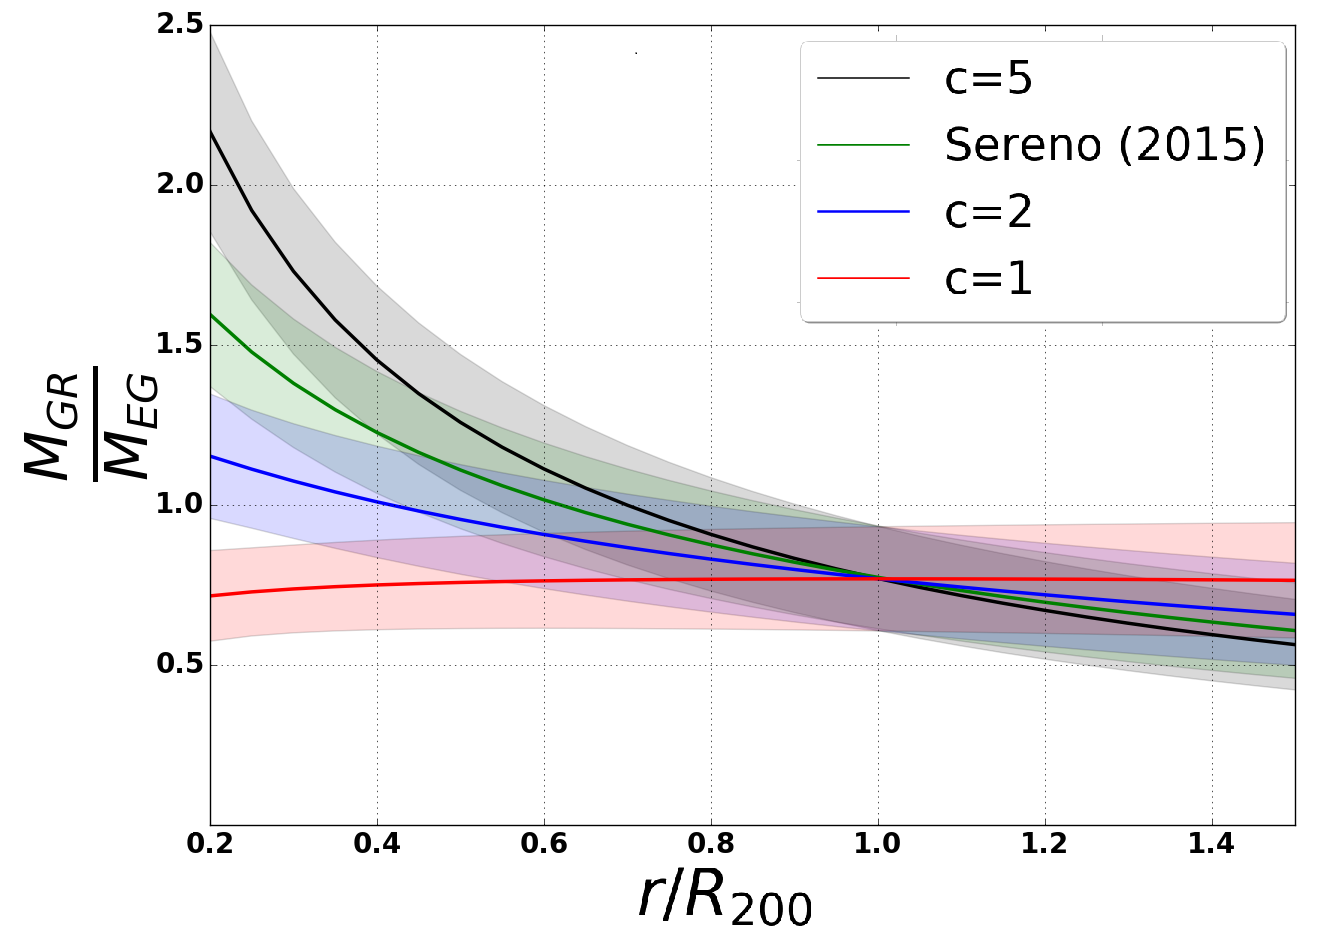
IV.4 Systematic shape bias from concentration
An alternative approach to evaluate systematic uncertainty due to the mass-concentration relation is to fix the mass measurements with our current errors while allowing the profile shapes to be more uncertain. As we can see from Fig. 5, if we assume that the cluster weak-lensing inferred masses are unbiased, the EG model becomes more consistent with the data at . While small, this average value for the NFW concentration of the weak-lensing mass profiles of massive clusters is close to those obtained in simulations (Groener et al., 2016; Klypin et al., 2016; Correa et al., 2015).
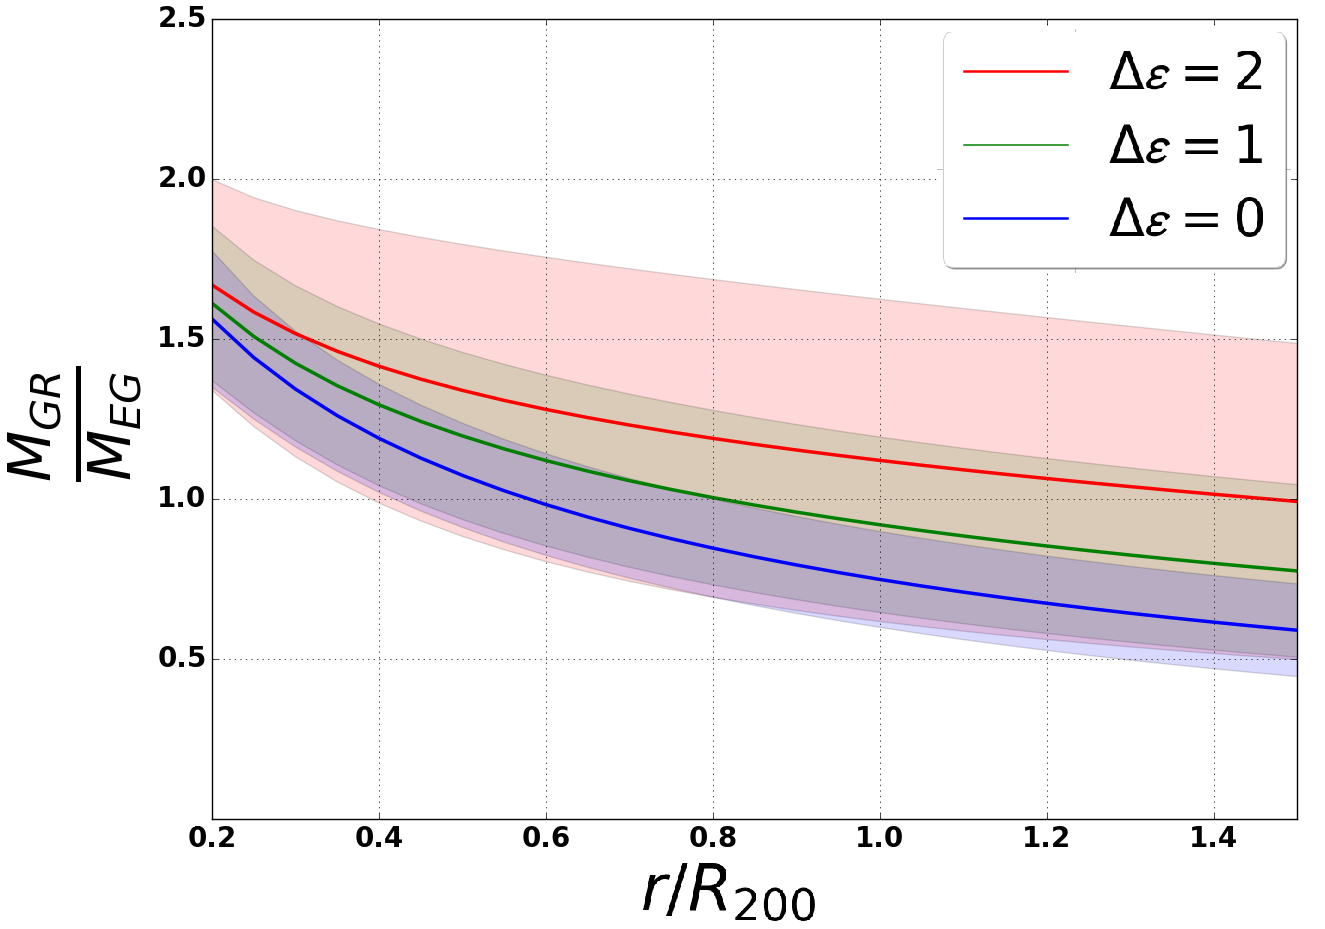
IV.5 Baryon profile bias
Three clusters from Giacintucci et al. (2017) utilize double beta profile (14) which does not take into account steepness parameter in Eq. (12). The remaining 20 clusters in our sample have average steepness parameter which is significantly smaller than the average steepness parameter of Vikhlinin et al. (2006) dataset. Increasing in our data rotates the apparent DM distribution curve and shifts it upwards which makes the EG prediction of the apparent DM more consistent with the observation of DM (see Fig. 6). Recent results from Ettori and Balestra (2009); Eckert et al. (2012) suggest that the baryon profiles are in fact much steeper than the original beta profile and in agreement with the high values from Vikhlinin et al. (2006).
IV.6 Other systematics
One of the assumptions of the EG model, which was discussed above in the introduction, is the fixed value of the Hubble parameter. To test this assumption we divided by redshifts our data sample of 23 galaxy clusters into two bins, i.e. one bin contained 11 clusters with the lowest redshifts () and the second bin contained 12 clusters with the highest redshifts (). Analysis of both bins produced almost completely identical results and that validates the fixed Hubble parameter assumption.
The second assumption which we made on the data is that the hot gas represents the total baryon mass of the clusters which is not totally true as stars contribute as well. However, stellar mass is less than (Giodini et al., 2009; Andreon, 2010; Laganá et al., 2013) of the hot gas for the clusters with the masses we use in this paper (). To check this assumption, we increased the baryon mass by which shifted the mass ratio in Fig. 4 only by approximately or changed this ratio by around 6%. This small shift in the mass ratio not only does not change the precision of constraining the EG model, but also does not change at all the main conclusion of incompatibility of the EG model with the galaxy clusters. So, the assumption of neglecting stellar masses is totally valid.
V Discussion
In this section, we discuss the consequences of the current EG predictions in the context of the observational data. We also explore alternatives to our fiducial analysis which could bring the EG predictions and the data into better agreement.
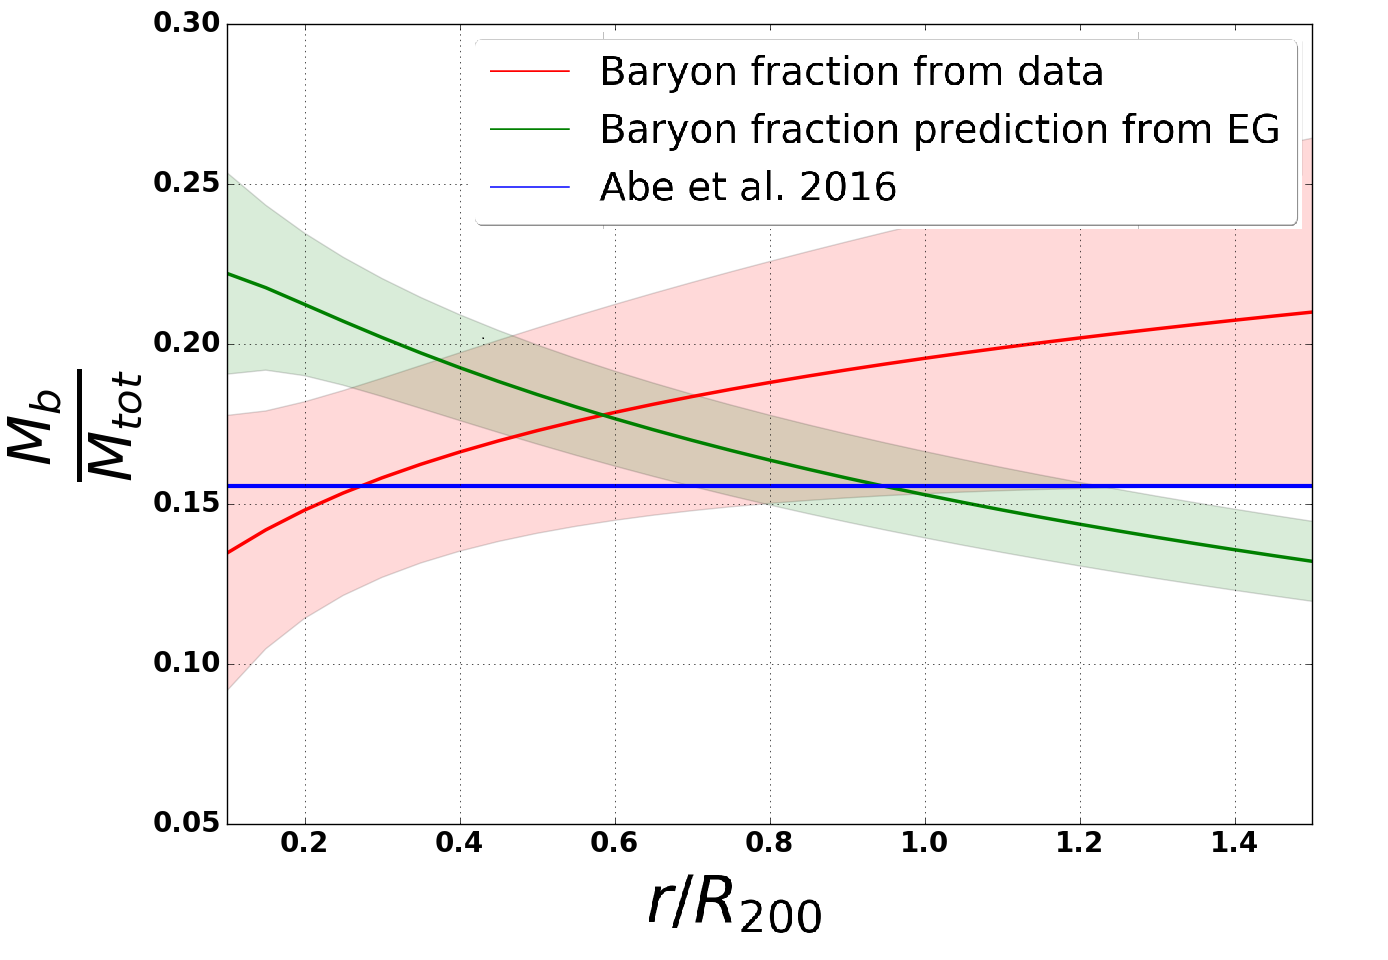
V.1 Effect on the baryon fraction
One of the consequences of the EG model is in the distribution of the baryons in clusters. We can define the effective baryon fraction which is predicted by the EG model by introducing the following ratio
| (19) |
where is the observed baryon mass and is the total mass which is predicted by the EG model.
The results of Fig. 7 imply that the EG effective baryon fraction is different in many aspects from the observed baryon fraction with the total mass defined by the weak lensing data. The first difference is the shape of the lines in Fig. 7: the EG model has a monotonically decreasing behavior while the data shows that the baryon fraction is an increasing with the radius function. In agreement with Nieuwenhuizen (2017) this means that the EG predicts baryons to be concentrated in the region around the cores of the galaxy clusters while the observations imply that the baryons are actually spread in the broader regions with highest fraction in the outskirts of the clusters. Second, the effective baryon fraction is almost twice as high close to the core (at ) which should be detected as it implies brighter cluster cores than we would observe in GR. This effect could be actually smaller if BCGs would be correctly taken into account by weak lensing data. In spite of these differences, the EG model predicts correctly the baryon fraction at the distances approximately . Additionally, the EG model predicts the effective baryon fraction to be close to (the number which is expected from the CMB observations (Ade et al., 2016)) at the distances close to .
One of the tenets of EG is that there is no particlelike dark matter. In the case of a flat universe, the only two contributions to the energy density are baryons and dark energy (Ade et al., 2016). We can build a toy model for how the baryons should be distributed in EG such that at the core of a virialized system one finds of the baryons while in the outskirts the EG baryon fraction falls to the global value of 5%-10%. This toy model is shown in Fig. 8 right. If this toy model describes how the real baryons are distributed in our Universe we would find a high level of consistency between the dark matter profiles from observed weak lensing data and what EG predicts for the apparent dark matter (see Figure 8 left). This is just a toy model, but it is an example of how one could achieve closer agreement between the EG predictions and the current observations.
V.2 Modifying EG
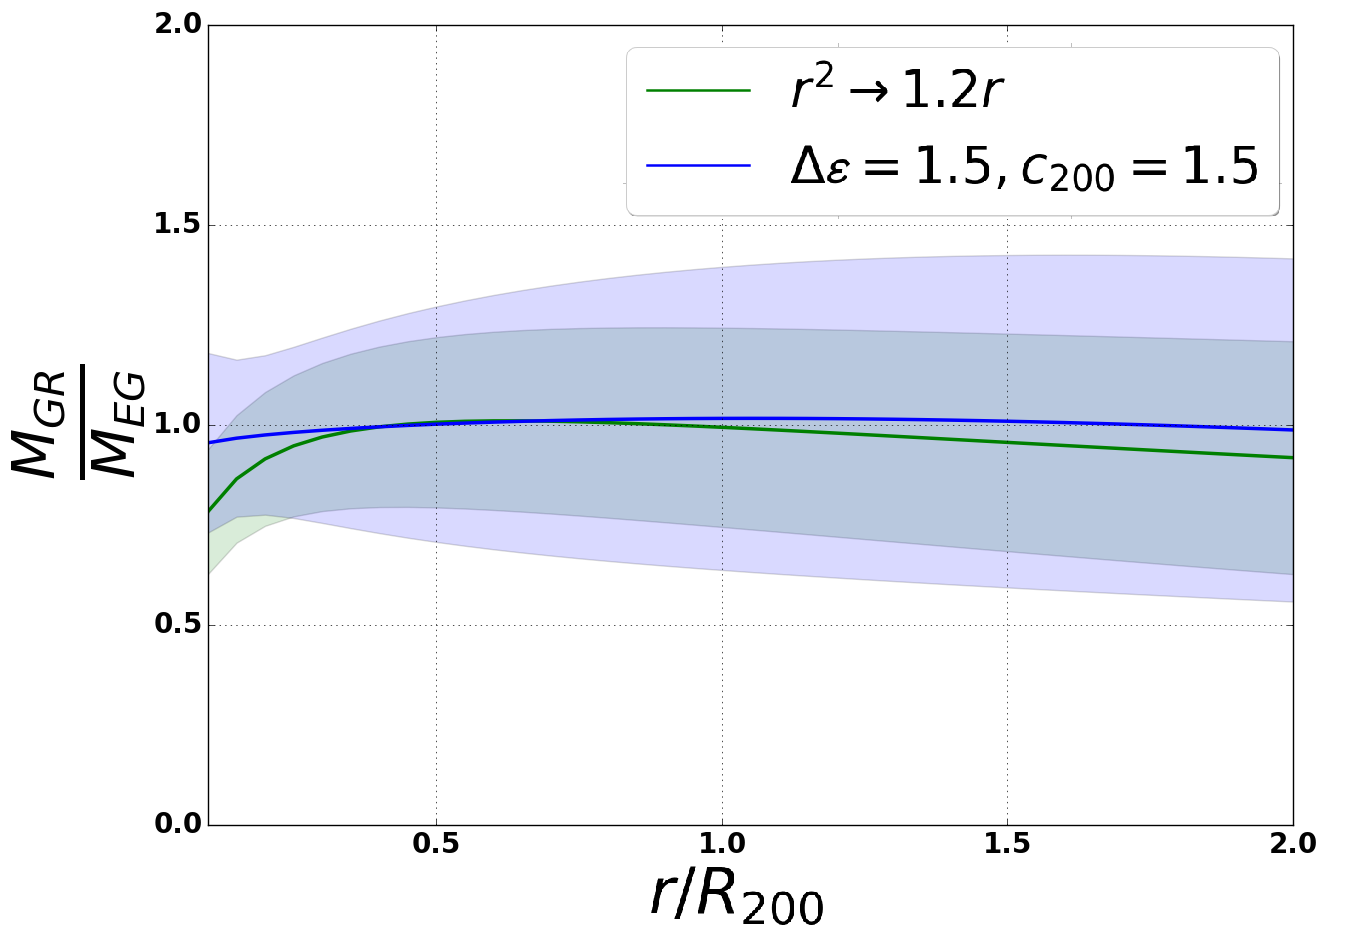
As opposed to reconsidering the distribution of the baryons inside clusters, one could alter the maximal strain of the EG model as described in Sec. II in Eq. (5). Recall that we chose equality in the inequality of the EG model in Eq. (5). We could have chosen some form away from its maximum value. As a new toy model, we propose a modification to the EG model which consists in changing in the denominator of the r.h.s. of the Eq. (7). For Mpc, the l.h.s. is smaller than its maximum value until beyond this radius. In the case Mpc the result is consistent with the observations (see Fig. 9). While the modification is based purely on phenomenological ground it might help in developing the theory of the EG model as we can see that the data favor the proposed form instead of the original form (7). This result leads to the conclusion that while by default equality is chosen in most of the works related to the testing and development of the EG theory, it is not necessarily the right or only choice.
V.3 Combining systematics
As it was mentioned in the section IV, concentration parameter () of the weak lensing and the steepness parameter () could be changed to make EG be more compatible with the observed data. Moreover, by adjusting both of these parameters at the same time the prediction of the EG model correlates nicely with the observed data (see Fig. 9).
VI Conclusions
The first attempt to test emergent gravity was done by Nieuwenhuizen (2017), where in contrast to our approach of using only weak lensing in determining matter profiles, combination of strong and weak lensing data (which compliment each other and overall better than weak lensing along determine matter profiles (Umetsu, 2013)) of one cluster A1689 showed that EG does not work in the region up to , while inclusion of neutrinos into EG framework helps to achieve a very good fit. Brouwer et al. (2017) showed that the EG model is in good agreement with the galaxy data. Ettori et al. (2019) tested the EG theory with 13 clusters in the narrow small redshifts range () with reconstructed hydrostatic mass profiles which have non-negligible hydrostatic bias due to nonthermal pressure sources. By analyzing 4 clusters, ZuHone and Sims (2019) confirmed conclusion of current manuscript as well as supported results of Nieuwenhuizen (2017) that at small radii ( kpc), EG produces a bad fit to the data.
In this work, the cluster data set was extended and resulted in utilization of 23 galaxy clusters in wider radial () and redshift () ranges. In addition to testing the nominal EG model, we consider an extension to the basic predictions of the framework (see also Hossenfelder (2017)).
EG provides good results only in the area near the virial radius and by taking into account the cores and the outskirts, the mass profile shape differences allow us to rule out EG at . However, given our current level of systematic errors in the observed shape profiles, our results lead to the conclusion that the EG model is a viable alternative to dark matter in the range R200. Under the nominal assumptions (i.e., without systematics), EG favors a radially decreasing baryon fraction which peaks in the cluster core (this effect could be slightly amplified due to the BCG not always taking into account by weak lensing data). This is a different baryon fraction profile when compared the standard dark matter model (see Ade et al. (2016)).
The EG model predicts a flatter shape of the dark matter mass distribution than the observed data, as well as steep x-ray gas density profiles. One of the successes of the model is that the observed weak lensing data and the predicted apparent dark matter are almost identical in the region close to .
Finally, we investigate the level of systematic errors needed to reach good agreement between EG and the data. We find that within the current systematic limits, there are combinations of shape profiles which can match EG to the data. Likewise, we investigate whether the EG model itself has the flexibility to better match the data and we find that it does through a lowering of the maximal strain. Given the level of systematic uncertainties in the data, as well as the depth of the theoretical framework, we are unable to formally rule out in the wide region (i.e. R200) the EG model as an alternative to dark matter in galaxy clusters.
VII Acknowledgments
This material is based upon work supported by the National Science Foundation under grant no. 181273. This research has made use of the VizieR catalogue access tool, CDS, Strasbourg, France.
References
- Verlinde (2017) E. P. Verlinde, SciPost Phys. 2, 016 (2017), arXiv:1611.02269 [hep-th] .
- Frieman et al. (2008) J. Frieman, M. Turner, and D. Huterer, Ann. Rev. Astron. Astrophys. 46, 385 (2008), arXiv:0803.0982 [astro-ph] .
- Zwicky (1933) F. Zwicky, Helv. Phys. Acta 6, 110 (1933), [Gen. Rel. Grav.41,207(2009)].
- Rubin and Ford (1970) V. C. Rubin and W. K. Ford, Jr., Astrophys. J. 159, 379 (1970).
- Freese (2017) K. Freese, Proceedings, 14th Marcel Grossmann Meeting on Recent Developments in Theoretical and Experimental General Relativity, Astrophysics, and Relativistic Field Theories (MG14) (In 4 Volumes): Rome, Italy, July 12-18, 2015, Int. J. Mod. Phys. 1, 325 (2017), arXiv:1701.01840 [astro-ph.CO] .
- Milgrom (1983) M. Milgrom, Astrophys. J. 270, 365 (1983).
- Milgrom (2008) M. Milgrom, arXiv e-prints , arXiv:0801.3133 (2008), arXiv:0801.3133 [astro-ph] .
- Famaey and McGaugh (2012) B. Famaey and S. McGaugh, Living Rev. Rel. 15, 10 (2012), arXiv:1112.3960 [astro-ph.CO] .
- Jacobson (1995) T. Jacobson, Phys. Rev. Lett. 75, 1260 (1995), arXiv:gr-qc/9504004 [gr-qc] .
- Verlinde (2011) E. P. Verlinde, JHEP 04, 029 (2011), arXiv:1001.0785 [hep-th] .
- Nieuwenhuizen (2017) T. M. Nieuwenhuizen, Proceedings, Conference on Frontiers of Quantum and Mesoscopic Thermodynamics (FQMT 15): Prague, Czech Republic, July 27-August 1, 2015, Fortsch. Phys. 65, 1600050 (2017), arXiv:1610.01543 [astro-ph.CO] .
- Ettori et al. (2019) S. Ettori, V. Ghirardini, D. Eckert, E. Pointecouteau, F. Gastaldello, M. Sereno, M. Gaspari, S. Ghizzardi, M. Roncarelli, and M. Rossetti, Astron. Astrophys. 621, A39 (2019), arXiv:1805.00035 [astro-ph.CO] .
- Broadhurst et al. (2005) T. J. Broadhurst, M. Takada, K. Umetsu, X. Kong, N. Arimoto, M. Chiba, and T. Futamase, Astrophys. J. 619, L143 (2005), arXiv:astro-ph/0412192 [astro-ph] .
- Sereno et al. (2012) M. Sereno, S. Ettori, and A. Baldi, Mon. Not. Roy. Astron. Soc. 419, 2646 (2012), arXiv:1109.2732 [astro-ph.CO] .
- Gifford et al. (2013) D. Gifford, C. J. Miller, and N. Kern, Astrophys. J. 773, 116 (2013), arXiv:1307.0017 [astro-ph.CO] .
- Stark et al. (2017) A. Stark, C. J. Miller, and D. Huterer, Phys. Rev. D 96, 023543 (2017), arXiv:1611.06886 [astro-ph.CO] .
- Halenka et al. (2020) V. Halenka, C. J. Miller, and P. Vansickle, arXiv e-prints , arXiv:2003.02733 (2020), arXiv:2003.02733 [astro-ph.CO] .
- Tortora et al. (2018) C. Tortora, L. V. E. Koopmans, N. R. Napolitano, and E. A. Valentijn, Mon. Not. Roy. Astron. Soc. 473, 2324 (2018), arXiv:1702.08865 [astro-ph.CO] .
- Sereno (2015) M. Sereno, Mon. Not. Roy. Astron. Soc. 450, 3665 (2015), arXiv:1409.5435 [astro-ph.CO] .
- Hoekstra et al. (2015) H. Hoekstra, R. Herbonnet, A. Muzzin, A. Babul, A. Mahdavi, M. Viola, and M. Cacciato, Mon. Not. R. Astron. Soc. 449, 685 (2015), arXiv:1502.01883 .
- Okabe and Umetsu (2008) N. Okabe and K. Umetsu, Publ Astron Soc Jpn 60, 345 (2008), astro-ph/0702649 .
- Okabe et al. (2010) N. Okabe, M. Takada, K. Umetsu, T. Futamase, and G. P. Smith, Publ Astron Soc Jpn 62, 811 (2010), arXiv:0903.1103 .
- Okabe and Smith (2016) N. Okabe and G. P. Smith, Mon. Not. R. Astron. Soc. 461, 3794 (2016), arXiv:1507.04493 [astro-ph.CO] .
- Applegate et al. (2014) D. E. Applegate, A. von der Linden, P. L. Kelly, M. T. Allen, S. W. Allen, P. R. Burchat, D. L. Burke, H. Ebeling, A. Mantz, and R. G. Morris, Mon. Not. R. Astron. Soc. 439, 48 (2014), arXiv:1208.0605 .
- Cypriano et al. (2004) E. S. Cypriano, L. Sodré, Jr., J.-P. Kneib, and L. E. Campusano, Astrophys. J. 613, 95 (2004), astro-ph/0310009 .
- Dahle (2006) H. Dahle, Astrophys. J. 653, 954 (2006), arXiv:astro-ph/0608480 [astro-ph] .
- Pedersen and Dahle (2007) K. Pedersen and H. Dahle, Astrophys. J. 667, 26 (2007), astro-ph/0603260 .
- Umetsu et al. (2015) K. Umetsu, M. Sereno, E. Medezinski, M. Nonino, T. Mroczkowski, J. M. Diego, S. Ettori, N. Okabe, T. Broadhurst, and D. Lemze, Astrophys. J. 806, 207 (2015), arXiv:1503.01482 .
- Giles et al. (2017) P. A. Giles, B. J. Maughan, H. Dahle, M. Bonamente, D. Landry, C. Jones, M. Joy, S. S. Murray, and N. van der Pyl, Mon. Not. Roy. Astron. Soc. 465, 858 (2017), arXiv:1510.04270 [astro-ph.CO] .
- Vikhlinin et al. (2006) A. Vikhlinin, A. Kravtsov, W. Forman, C. Jones, M. Markevitch, S. S. Murray, and L. Van Speybroeck, Astrophys. J. 640, 691 (2006), arXiv:astro-ph/0507092 [astro-ph] .
- Giacintucci et al. (2017) S. Giacintucci, M. Markevitch, R. Cassano, T. Venturi, T. E. Clarke, and G. Brunetti, Astrophys. J. 841, 71 (2017), arXiv:1701.01364 [astro-ph.HE] .
- Navarro et al. (1996) J. F. Navarro, C. S. Frenk, and S. D. M. White, Astrophys. J. 462, 563 (1996), arXiv:astro-ph/9508025 [astro-ph] .
- Merritt et al. (2006) D. Merritt, A. W. Graham, B. Moore, J. Diemand, and B. Terzić, Astro. Journal 132, 2685 (2006), astro-ph/0509417 .
- Miller et al. (2016) C. J. Miller, A. Stark, D. Gifford, and N. Kern, Astrophys. J. 822, 41 (2016), arXiv:1612.05565 [astro-ph.CO] .
- Einasto (1965) J. Einasto, Trudy Astrofizicheskogo Instituta Alma-Ata 5, 87 (1965).
- Navarro et al. (1997) J. F. Navarro, C. S. Frenk, and S. D. M. White, Astrophys. J. 490, 493 (1997), arXiv:astro-ph/9611107 [astro-ph] .
- Duffy et al. (2008) A. R. Duffy, J. Schaye, S. T. Kay, and C. Dalla Vecchia, Mon. Not. R. Astron. Soc. 390, L64 (2008), arXiv:0804.2486 .
- Sereno et al. (2016) M. Sereno, C. Fedeli, and L. Moscardini, JCAP 1601, 042 (2016), arXiv:1504.05183 [astro-ph.CO] .
- Giodini et al. (2009) S. Giodini, D. Pierini, A. Finoguenov, G. W. Pratt, H. Boehringer, A. Leauthaud, L. Guzzo, H. Aussel, M. Bolzonella, P. Capak, M. Elvis, G. Hasinger, O. Ilbert, J. S. Kartaltepe, A. M. Koekemoer, S. J. Lilly, R. Massey, H. J. McCracken, J. Rhodes, M. Salvato, D. B. Sanders, N. Z. Scoville, S. Sasaki, V. Smolcic, Y. Taniguchi, D. Thompson, and COSMOS Collaboration, Astrophys. J. 703, 982 (2009), arXiv:0904.0448 [astro-ph.CO] .
- Andreon (2010) S. Andreon, Mon. Not. R. Astron. Soc. 407, 263 (2010), arXiv:1004.2785 .
- Laganá et al. (2013) T. F. Laganá, N. Martinet, F. Durret, G. B. Lima Neto, B. Maughan, and Y.-Y. Zhang, A&A 555, A66 (2013), arXiv:1304.6061 [astro-ph.CO] .
- ZuHone and Sims (2019) J. A. ZuHone and J. R. Sims, Astrophys. J. 880, 145 (2019), arXiv:1905.03832 [astro-ph.CO] .
- Schellenberger and Reiprich (2017) G. Schellenberger and T. H. Reiprich, Mon. Not. Roy. Astron. Soc. 469, 3738 (2017), arXiv:1705.05842 [astro-ph.CO] .
- Groener et al. (2016) A. M. Groener, D. M. Goldberg, and M. Sereno, Mon. Not. Roy. Astron. Soc. 455, 892 (2016), arXiv:1510.01961 [astro-ph.CO] .
- Ade et al. (2016) P. A. R. Ade et al. (Planck), Astron. Astrophys. 594, A13 (2016), arXiv:1502.01589 [astro-ph.CO] .
- Klypin et al. (2016) A. Klypin, G. Yepes, S. Gottlober, F. Prada, and S. Hess, Mon. Not. Roy. Astron. Soc. 457, 4340 (2016), arXiv:1411.4001 [astro-ph.CO] .
- Correa et al. (2015) C. A. Correa, J. S. B. Wyithe, J. Schaye, and A. R. Duffy, Mon. Not. Roy. Astron. Soc. 452, 1217 (2015), arXiv:1502.00391 [astro-ph.CO] .
- Ettori and Balestra (2009) S. Ettori and I. Balestra, A&A 496, 343 (2009), arXiv:0811.3556 .
- Eckert et al. (2012) D. Eckert, F. Vazza, S. Ettori, S. Molendi, D. Nagai, E. T. Lau, M. Roncarelli, M. Rossetti, S. L. Snowden, and F. Gastaldello, A&A 541, A57 (2012), arXiv:1111.0020 .
- Umetsu (2013) K. Umetsu, Astrophys. J. 769, 13 (2013), arXiv:1302.0514 [astro-ph.CO] .
- Brouwer et al. (2017) M. M. Brouwer et al., Mon. Not. Roy. Astron. Soc. 466, 2547 (2017), arXiv:1612.03034 [astro-ph.CO] .
- Hossenfelder (2017) S. Hossenfelder, Phys. Rev. D95, 124018 (2017), arXiv:1703.01415 [gr-qc] .