Lattice dynamics and phase transition in single crystals
Abstract
The vibrational properties of single crystals were investigated using Raman spectroscopy and were analyzed with respect to the changes of the crystal structure. All but one mode are observed for both the low-temperature and the high-temperature C2/ phase. For all observed modes the energies and symmetries are in good agreement with DFT calculations. The symmetry of a single-layer was identified as . In contrast to previous studies we observe the transition from the to the phase at 180 K and find no evidence for coexistence of both phases over a wide temperature range.
pacs:
63.20.-e, 63.20.dk, 78.30.-j,I Introduction
Two-dimensional layered materials have gained attention due to their unique properties, the potential for a wide spectrum of applications and the opportunity for the development of functional van der Waals heterostructures. is a member of the chromium-trihalide family which are ferromagnetic semiconductors B. Huang et al. (2017). Recently, they have received significant attention as candidates for the study of magnetic monolayers. The experimental realization of ferromagnetic monolayers B. Huang et al. (2017) motivated further efforts towards their understanding. features electric field controlled magnetism Jiang et al. (2018) as well as a strong magnetic anisotropy McGuire et al. (2015); Ladno and Fernández-Rossier (2017). With the main absorption peaks lying in the visible part of the spectrum, it is a great candidate for low-dimensional semiconductor spintronics Zhang et al. (2015). In its ground state, is a ferromagnetic semiconductor with a Curie temperature of 61 K Jr. and Olson (1965); B. Huang et al. (2017) and a band-gap of 1.2 eV Jr. and Olson (1965). It was demonstrated that the magnetic properties of mono- and bilayers can be controlled by electrostatic doping Jiang et al. (2018). Upon cooling, undergoes a phase transition around 220 K from the high-temperature monoclinic () to the low-temperature rhombohedral () phase McGuire et al. (2015); Larson and Kaxiras (2018). Although the structural phase transition is reported to be of the first-order, it was suggested that the phases may coexist over a wide temperature range McGuire et al. (2015). Raman spectroscopy can be of use here due to its capability to simultaneously probe both phases in a phase-separated system Lazarević et al. (2012); Ryu et al. (2015a, b).
A recent theoretical study predicted the energies of all Raman active modes in the low-temperature and high-temperature structure of suggesting a near degeneracy between the and modes in the monoclinic () structure. Their energies match the energies of modes in the rhombohedral () structure Larson and Kaxiras (2018).
In this article we present an experimental and theoretical Raman scattering study of lattice dynamics. In both phases all but one of the respective modes predicted by symmetry were observed. The energies for all modes are in good agreement with the theoretical predictions for the assumed crystal symmetry. Our data suggest that the first-order transition occurs at K without evidence for phase coexistence over a wide temperature range.
II Experiment and numerical method
The preparation of the single crystal sample used in this study is described elsewhere Liu and Petrovic (2018). The Raman scattering experiment was performed using a Tri Vista 557 spectrometer in backscattering micro-Raman configuration with a 1800/1800/2400 groves/mm diffraction grating combination. The 532 nm line of a Coherent Verdi G solid state laser was used as an excitation source. The direction of the incident light coincides with the crystallographic axis. The sample was oriented so that its principal axis of the phase coincides with the axis of the laboratory system. A KONTI CryoVac continuous Helium flow cryostat with a 0.5 mm thick window was used for measurements at all temperatures under high vacuum ( mbar). The sample was cleaved in air before being placed into the cryostat. The obtained Raman spectra were corrected by the Bose factor and analysed quantitatively by fitting Voigt profiles to the data whereby the Gaussian width reflects the resolution of the spectrometer.
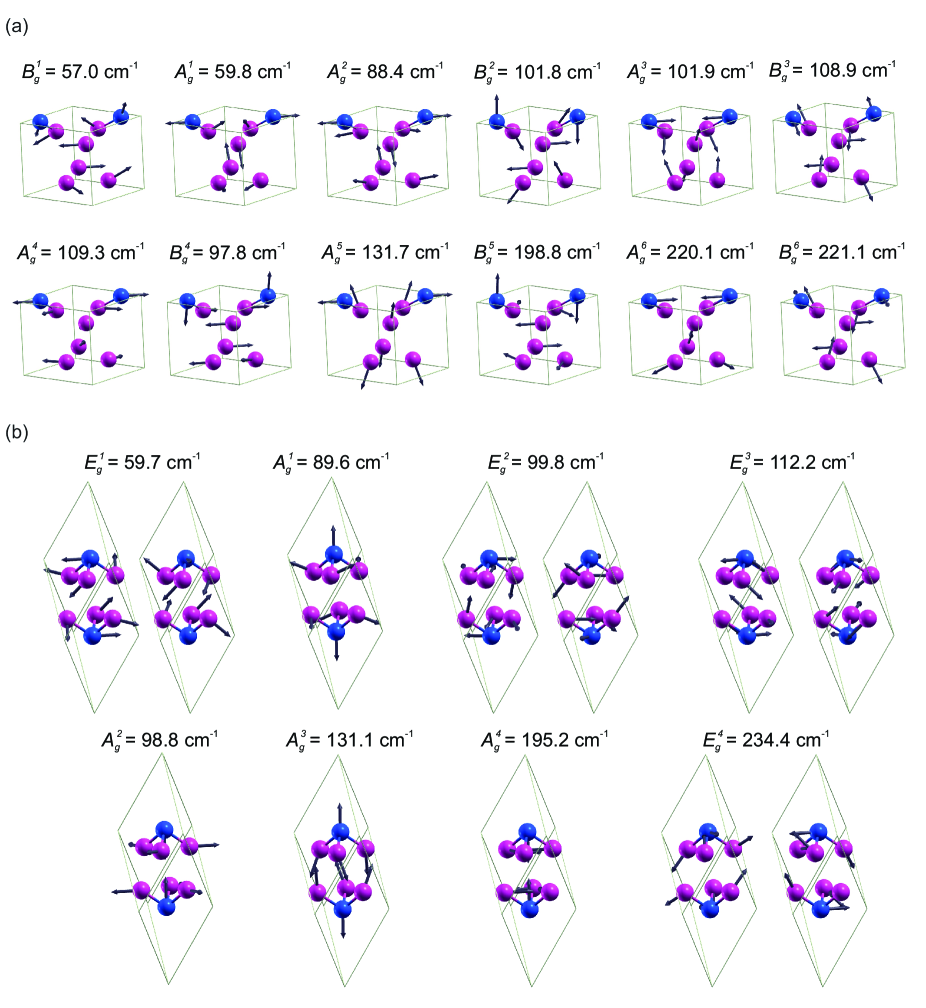
The spin polarized density functional theory (DFT) calculations have been performed in the Quantum Espresso (QE) software package Giannozzi et al. (2009), using the Perdew-Burke-Ernzehof (PBE) exchange-correlation functional Perdew et al. (1996) and PAW pseudopotentials Blöchl (1994); Kresse and Joubert (1999). The energy cutoffs for the wavefunctions and the charge density were set to be 85 Ry and 425 Ry, respectively, after convergence tests. For -point sampling, the Monkhorst-Pack scheme was used with a grid centered around the point. Optimization of a atomic positions in the unit cell was performed until the interatomic forces were smaller than . To treat the van der Waals (vdW) interactions a Grimme-D2 correction Stefan is used in order to include long-ranged forces between the layers, which are not properly captured within LDA or GGA functionals. This way, the parameters are obtained more accurately, especially the interlayer distances. Phonon frequencies were calculated at the point using the linear response method implemented in QE. The phonon energies are compiled in Table 3 together with experimental values. Eigenvectors of Raman active modes for both low- and high-temperature phases are depicted in Figure A1 of the Appendix.
III Results and Discussion
| Space group | Diperiodic space group | Space group: | |||
| Atoms | Irreducible representations | Atoms | Irreducible representations | Atoms | Irreducible representations |
| Cr () | + + + | Cr () | + + + | Cr () | |
| I (18f) | 3 + 3 + 3 + 3 | I () | I () | ||
| I () | 3 | ||||
| Space group | Space group | |||||||
|---|---|---|---|---|---|---|---|---|
| Symm. | Exp. () | Calc. () | Calc. () Larson and Kaxiras (2018) | Symm. | Exp. () | Calc. () | Calc. Larson and Kaxiras (2018) () | |
| 54.1 | 59.7 | 53 | 52.0 | 57.0 | 52 | |||
| 53.6 | 59.8 | 51 | ||||||
| 73.33 | 89.6 | 79 | 78.6 | 88.4 | 79 | |||
| 102.3 | 99.8 | 98 | 101.8 | 101.9 | 99 | |||
| 102.4 | 101.8 | 99 | ||||||
| 106.2 | 112.2 | 102 | 106.4* | 108.9 | 101 | |||
| 108.3 | 109.3 | 102 | ||||||
| 108.3 | 98.8 | 88 | 106.4* | 97.8 | 86 | |||
| 128.1 | 131.1 | 125 | 128.2 | 131.7 | 125 | |||
| - | 195.2 | 195 | - | 198.8 | 195 | |||
| 236.6 | 234.4 | 225 | 234.6 | 220.1 | 224 | |||
| 235.5 | 221.1 | 225 | ||||||
* observed as two peak structure
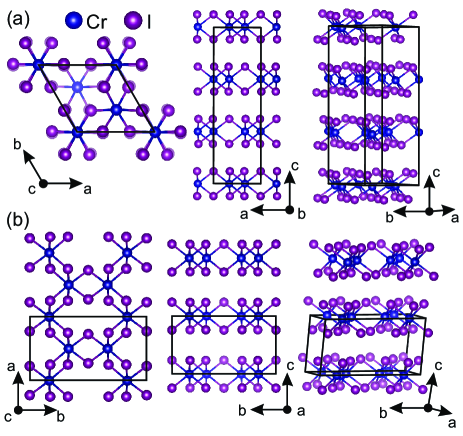
adopts a rhombohedral () crystal structure at low temperatures and a monoclinic () crystal structure at room temperature McGuire et al. (2015), as shown in Figure 1. The main difference between the high- and low-temperature crystallographic space groups arises from different stacking sequences, with layers being almost identical. In the rhombohedral structure the Cr atoms in one layer are placed above the center of a hole in the Cr honeycomb net of the two adjacent layers. When crossing the structural phase transition at to the monoclinic structure the layers are displaced along the direction so that every fourth layer is at the same place as the first one. The interatomic distances, mainly the interlayer distance, and the vdW gap, are slightly changed by the structural transition. The crystallographic parameters for both phases are presented in Table 1. The numerically obtained values are in good agreement with reported X-ray diffraction data Liu and Petrovic (2018).
The vibrational properties of layered materials are typically dominated by the properties of single layers composing the crystal. The symmetry of a single layer can be described by one of the 80 diperiodic space groups (DG) obtained by lifting translational invariance in the direction perpendicular to the layer A. . In the case of , the symmetry analysis revealed that the single layer structure is fully captured by the () diperiodic space group DG71, rather than by as proposed in Ref. Larson and Kaxiras (2018).
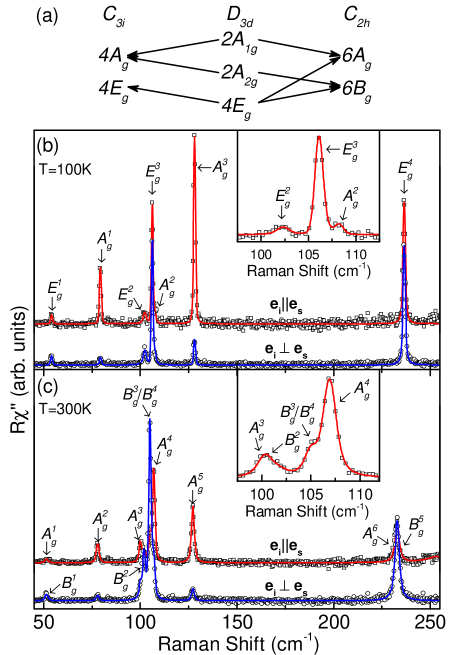
According to the factor group analysis (FGA) for the single layer, six modes () are expected to be observed in the Raman scattering experiment (see Table 2). By stacking the layers the symmetry is reduced and, depending on the stacking sequence, FGA yields a total of eight Raman active modes () for the and twelve Raman active modes () for the crystal symmetry. The correlation between layer and crystal symmetries for both cases is shown in Figure 2 (a) G. Fateley et al. (1971); Lazarević et al. (2011).
Fig. 2(b) shows the single crystal Raman spectra measured at 100 K in two scattering channels. According to selection rules for the rhombohedral crystal structure (Table 2) the modes can be observed only in the parallel polarization configuration, whereas the modes appear in both parallel and crossed polarization configurations. Based on the selection rules, peaks at about 78 , 108 and 128 were identified as symmetry modes, whereas peaks at about 54 , 102 , 106 and 235 are assigned as symmetry. The weak observation of the most pronounced modes in crossed polarisations [Fig. 2 (b)] is attributed to the leakage due to a slight sample misalignment and/or the presence of defects in the crystal. The energies of all observed modes are compiled in Table 3 together with the energies predicted by our calculations and by Ref. Larson and Kaxiras (2018) and are found to be in good agreement for the modes. The discrepancy is slightly larger for the low energy modes. Our calculations in general agree with those from Ref. Larson and Kaxiras (2018). The mode of the rhombohedral phase, predicted by calculation to appears at about 195 , was not observed in the experiment, most likely due to its low intensity.
When the symmetry is lowered in the high-temperature monoclinic phase [Fig. 2(c)] the modes split into an and a mode each, whereas the rhombohedral and modes are predicted to switch to the monoclinic symmetry. The correspondence of the phonon modes across the phase transition is indicated by the arrows in Table 3. The selection rules for C2/ (see Table 2) predict that and modes can be observed in both parallel and crossed polarization configurations. Additionally, the sample forms three types of domains which are rotated with respect to each other. We therefore identify the phonons in the C2/ phase in relation to the calculations and find again good agreement of the energies. The and modes overlap and therefore cannot be resolved separately. As can be seen from the temperature dependence shown below [Fig. 4(b)] the peak at 106 broadens and gains spectral weight in the monoclinic phase in line with the expectance that two modes overlap. The missing rhombohedral mode corresponds to the monoclinic mode, which is likewise absent in the spectra.
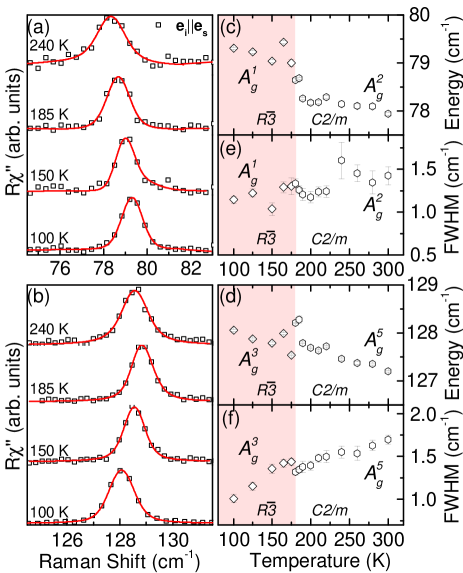
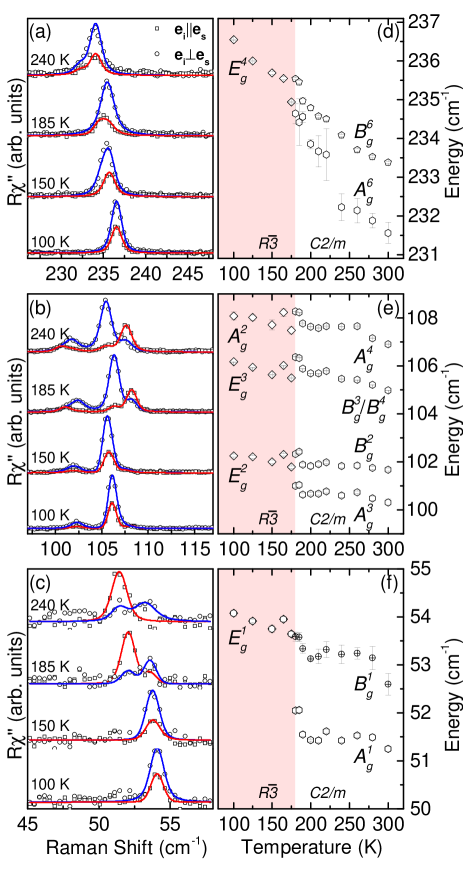
The temperature dependence of the observed phonons is shown in Figs. 3 and 4. In the low-temperature rhombohedral phase all four modes as well as and soften upon warming, whereas hardens up to before softening again. Crossing the first order phase transition from to crystal symmetry is reflected in the spectra as a symmetry change and/or renormalization for the non-degenerate modes and lifting of the degeneracy of the modes as shown in Table 2. In our samples, this transition is observed at . The splitting of the phonons into and modes at the phase transition is sharp [Fig. 4]. The rhombohedral and phonons show a jump in energy and a small discontinuity in the line width at [Fig. 3]. Our spectra were taken during warming in multiple runs after cooling to 100 K each time. We found that the temperature dependence for the phonon modes obtained this way was smooth in each phase. McGuire et al. McGuire et al. (2015, 2017) reported in the range of 220 K, a coexistence of both phases and a large thermal hysteresis. However, they also noted that the first and second warming cycle showed identical behaviour and only found a shift of the transition temperature to higher values of the cooling cycles. We therefore consider the difference between the reported transition around 220 K and our significant. To some extent this difference may be attributed to local heating by laser. More importantly, we find no signs of phase coexistence in the observed temperature range. The spectra for the low-temperature and high-temperature phases are distinctly different [Fig. 2] and the modes exhibit a clearly resolved splitting which occurs abruptly at . We performed measurements in the small temperature steps (see Figs. 3 and 4). This limits the maximum temperature interval where the phase coexistence could occur to approximately 5 K, much less than the roughly 30 to 80 K reported earlier McGuire et al. (2015, 2017).
IV Conclusion
We studied the lattice dynamics in the single crystalline using Raman spectroscopy supported by numerical calculations. For both the low-temperature and the high-temperature C2/ phases, all except one of the predicted phonon modes were identified and the calculated and experimental phonon energies were found to be in good agreement. We determined that the symmetry of the single layers is . Abrupt changes to the spectra were found at the first-order phase transition which was located at , lower than in previous studies. In contrast to the prior reports we found no sign of phase coexistence over temperature ranges exceeding 5 K.
Acknowledgement
The work was supported by the Serbian Ministry of Education, Science and Technological Development under Projects III45018 and OI171005. DFT calculations were performed using computational resources at Johannes Kepler University, Linz, Austria. Work at Brookhaven is supported by the U.S. DOE under Contract No. DESC0012704.
References
- B. Huang et al. (2017) E. Navarro-Moratalla B. Huang, G. Clark et al., “Layer-dependent ferromagnetism in a van der Waals crystal down to the monolayer limit,” Nature 546, 270–273 (2017).
- Jiang et al. (2018) Shengwei Jiang, Lizhong Li, Zefang Wang, Kin Fai Mak, and Jie Shan, “Controlling magnetism in 2D CrI3 by electrostatic doping,” Nat. Nanotechnol. (2018), 10.1038/s41565-018-0135-x.
- McGuire et al. (2015) Michael A. McGuire, Hemant Dixit, Valentino R. Cooper, and Brian C. Sales, “Coupling of Crystal Structure and Magnetism in the Layered, Ferromagnetic Insulator CrI3,” Chem. Mater. 27, 612–620 (2015).
- Ladno and Fernández-Rossier (2017) J. L. Ladno and J. Fernández-Rossier, “On the origin of magnetic anisotropy in two dimensional ,” 2D Materials 4, 035002 (2017).
- Zhang et al. (2015) Wei-Bing Zhang, Qian Qu, Peng Zhu, and Chi-Hang Lam, “Robust intrinsic ferromagnetism and half semiconductivity in stable two-dimensional single-layer chromium trihalides,” J. Mater. Chem. C 3, 12457–12468 (2015).
- Jr. and Olson (1965) J. F. Dillon Jr. and C. E. Olson, “Magnetization, resonance, and optical properties of the ferromagnet ,” Chem. Mater. 36, 1259 (1965).
- Larson and Kaxiras (2018) D. T. Larson and E. Kaxiras, “Raman Spectrum of CrI3: an ab-initio study,” ArXiv e-prints (2018), arXiv:1803.10825 [cond-mat.mtrl-sci] .
- Lazarević et al. (2012) N. Lazarević, M. Abeykoon, P. W. Stephens, Hechang Lei, E. S. Bozin, C. Petrovic, and Z. V. Popović, “Vacancy-induced nanoscale phase separation in KxFe2-ySe2 single crystals evidenced by Raman scattering and powder x-ray diffraction,” Phys. Rev. B 86, 054503 (2012).
- Ryu et al. (2015a) Hyejin Ryu, Milinda Abeykoon, Kefeng Wang, Hechang Lei, N. Lazarevic, J. B. Warren, E. S. Bozin, Z. V. Popovic, and C. Petrovic, “Insulating and metallic spin glass in Ni-doped single crystals,” Phys. Rev. B 91, 184503 (2015a).
- Ryu et al. (2015b) Hyejin Ryu, Kefeng Wang, M. Opacic, N. Lazarevic, J. B. Warren, Z. V. Popovic, Emil S. Bozin, and C. Petrovic, “Sustained phase separation and spin glass in Co-doped single crystals,” Phys. Rev. B 92, 174522 (2015b).
- Liu and Petrovic (2018) Yu Liu and C. Petrovic, “Three-dimensional magnetic critical behavior in ,” Phys. Rev. B 97, 014420 (2018).
- Giannozzi et al. (2009) Paolo Giannozzi, Stefano Baroni, Nicola Bonini, Matteo Calandra, Roberto Car, Carlo Cavazzoni, Davide Ceresoli, Guido L Chiarotti, Matteo Cococcioni, Ismaila Dabo, Andrea Dal Corso, Stefano de Gironcoli, Stefano Fabris, Guido Fratesi, Ralph Gebauer, Uwe Gerstmann, Christos Gougoussis, Anton Kokalj, Michele Lazzeri, Layla Martin-Samos, Nicola Marzari, Francesco Mauri, Riccardo Mazzarello, Stefano Paolini, Alfredo Pasquarello, Lorenzo Paulatto, Carlo Sbraccia, Sandro Scandolo, Gabriele Sclauzero, Ari P Seitsonen, Alexander Smogunov, Paolo Umari, and Renata M Wentzcovitch, “Quantum espresso: a modular and open-source software project for quantum simulations of materials,” J. Phy. Condens. Mat. 21, 395502 (19pp) (2009).
- Perdew et al. (1996) John P. Perdew, Kieron Burke, and Matthias Ernzerhof, “Generalized gradient approximation made simple,” Phys. Rev. Lett. 77, 3865–3868 (1996).
- Blöchl (1994) P. E. Blöchl, “Projector augmented-wave method,” Phys. Rev. B 50, 17953–17979 (1994).
- Kresse and Joubert (1999) G. Kresse and D. Joubert, “From ultrasoft pseudopotentials to the projector augmented-wave method,” Phys. Rev. B 59, 1758–1775 (1999).
- (16) Grimme Stefan, “Semiempirical GGA-type density functional constructed with a long-range dispersion correction,” J. Comput. Chem. 27, 1787–1799.
- (17) Wood Elizabeth A., “The 80 diperiodic groups in three dimensions,” Bell Syst. Tech. J. 43, 541–559.
- G. Fateley et al. (1971) W G. Fateley, Neil T. McDevitt, and Freeman F. Bentley, “Infrared and raman selection rules for lattice vibrations: The correlation method,” Appl. Spectrosc., 25, 155–173 (1971).
- Lazarević et al. (2011) N. Lazarević, Z. V. Popović, Rongwei Hu, and C. Petrovic, “Evidence of coupling between phonons and charge-density waves in ErTe3,” Phys. Rev. B 83, 024302 (2011).
- McGuire et al. (2017) Michael A. McGuire, Genevieve Clark, Santosh KC, W. Michael Chance, Gerald E. Jellison, Valentino R. Cooper, Xiaodong Xu, and Brian C. Sales, “Magnetic behavior and spin-lattice coupling in cleavable van der Waals layered crystals,” Phys. Rev. Materials 1, 014001 (2017).
Appendix A Eigenvectors
In addition to the phonon energies we also calculated the phonon eigenvectors which are shown in Fig. A1(a) for the high-temperature monoclinic phase and in Fig. A1(b) for the low-temperature rhombohedral phase. The energies, as given, are calculated for zero temperature. The relative displacement of the atoms is denoted by the length of the arrows.