Tycho’s supernova: the view from Gaia
Abstract
SN 1572 (Tycho Brahe’s supernova) clearly belongs to the Ia (thermonuclear) type. It was produced by the explosion of a white dwarf in a binary system. Its remnant has been the first of this type to be explored in search of a possible surviving companion, the mass donor that brought the white dwarf to the point of explosion. A high peculiar motion with respect to the stars at the same location in the Galaxy, mainly due to the orbital velocity at the time of the explosion, is a basic criterion for the detection of such companions. Radial velocities from the spectra of the stars close to the geometrical center of Tycho’s supernova remnant, plus proper motions of the same stars, obtained by astrometry with the Hubble Space Telescope, have been used so far. In addition, a detailed chemical analysis of the atmospheres of a sample of candidate stars had been made. However, the distances to the stars remained uncertain. Now, the Second Gaia Data Release (DR2) provides unprecedented accurate distances and new proper motions for the stars can be compared with those obtined from the HST. We consider the Galactic orbits that the candidate stars to SN companion would have in the future. We do this to explore any kinematic peculiarity. We also locate a representative sample of candidate stars in the Toomre diagram. Using the new data, we reevaluate here the status of the candidates suggested thus far, as well as the larger sample of the stars seen in the central region of the remnant.
Subject headings:
Supernovae, general; supernovae, Type Ia1. Introduction
Type Ia supernovae (SNe Ia) are the calibrated standard candles used in the discovery of the accelerated expansion of the Universe (Riess et al. 1998; Perlmutter et al. 1999) and they remain a powerful tool in exploring the nature of dark energy. Although a lot of progress has been made in disentangling the nature of the explosions, there are still many points to be addressed concerning the progenitors (see reviews by Wang & Han 2012; Maoz et al. 2014, and Ruiz–Lapuente 2014, for instance). They appear to be thermonucler explosions of white dwarfs (WDs) made of C+O, and accretion of material by the WD from a companion in a close binary system should be the basic mechanism to induce the explosion, but here the consensus stops. The companion could either be a still thermonuclearly active star in any stage of its evolution (the single–degenerate, SD channel) or another WD (the double–degenerate, DD channel. The explosion could also result from the merging of a WD with the electron–degenerate core of an asymptotic giant branch (AGB) star. The mode of the accretion could range from steady accretion to violent merger, and the explosion either arise from central ignition of C, when the WD grows close to the Chandrasekhar mass, or be induced by detonation of a He layer near the surface, the mass of the WD being smaller in this case. Observed different type Ia SNe may have different origins.
No binary system has ever been discovered in which a SN Ia has later taken place, but some binary systems are however considered to be excellent candidates for SN Ia progenitors, such as U Sco, which contains a WD already close to the Chandrasekhar mass. A general prediction for the SD channel is that the companion star of the WD should survive the explosion and present revealing characteristics.
There are remnants (SNRs) of the explosions of SNe Ia, close and recent enough that their exploration can either detect the presence of a surviving companion or confirm its absence (Ruiz–Lapuente 1997). This has been done for several SNRs of the Ia type, in our own Galaxy and in the LMC (Ruiz–Lapuente et al. 2004; González Hernández et al. 2009; Kerzendorf et al. 2009; Schaefer & Pagnotta 2012; Edwards et al. 2012; González Hernández et al. 2012; Kerzendorf et al. 2012, 2013, 2014, 2018a,b; Bedin et al. 2014; Pagnotta & Schaefer 2015; Ruiz–Lapuente et al. 2018).
The remnant of SN 1572 (Tycho Brahe’s SN) was the first to be explored (Ruiz–Lapuente et al. 2004, RL04 hereafter), and the findings there have later been the subject of several studies (González Hernández et al. 2009, GH09 henceforth; Kerzendorf et al. 2009; Kerzendorf et al. 2013, hereafter K13; Bedin et al. 2014, B14 hereafter).
Now the Gaia Data Release 2 is providing an unprecedented view of the kinematics of the Galactic disk (Brown et al. 2018). It not only gives the 3D location of a very large sample of stars in the Galaxy, but also full velocity information (proper motion and radial velocity) for 7.2 million stars brighter than = 12 mag, and transverse velocity for an unprecedently large number of stars. Gaia DR2 provides astrometric parameters (positions, parallaxes and proper motions) for 1.3 billion sources. The median uncertainty for the sources brighter than = 14 mag is 0.03 mas for the parallax and 0.07 mas yr-1 for the proper motions. The reference frame is aligned with the International Celestial Reference System (ICRS) and non–rotating with respect to the quasars to within 0.1 mas yr-1. The systematics are below 0.1 mas and the parallax zeropoint uncertainty is small, about 0.03 mas (Brown et al. 2018).
Previously, the distances to the stars could only be estimated from comparison of the absolute magnitudes deduced from their spectral types and luminosity classes with their photometry, assuming some interstellar extinction in the direction of the SNR. That left considerable uncertainty in many cases (see RL04 and B14). It is here where the Gaia DR2 is most useful.
The situation was better concerning proper motions, where HST astrometry, based on images taken at different epochs, had allowed high precision (see B14). HST proper motions are always relative to a local frame, whereas Gaia DR2 proper motions are absolute, referred to the ICRS. Moreover, Gaia DR2 allows to calculate the Galactic orbits of the stars. In addition, without a precise knowledge of the distances, the conversion of proper motions into tangential velocities remained uncertain and so was the reconstruction of the total velocities.
The paper is organized as follows. First we describe the characteristcs of Tycho’s SNR. In Section 3, we examine the distances given by the parallaxes from Gaia, for the surveyed stars, and we compare them with previous estimates. In Section 4, the proper motions from Gaia are compared with the HST ones. Section 5 discusses the position in the Toomre diagram of possible companion stars to SN 1572, as compared with a large sample. In Section 6, we calculate the Galactic orbits of 4 representative stars and we discuss their characteristics. In Section 7 our whole sample is discussed. Section 8 compares the observations with the predictions of models of the evolution of SN Ia companions. Finally, Section 9 gives a summary and the conclusions.
2. Tycho SN remnant
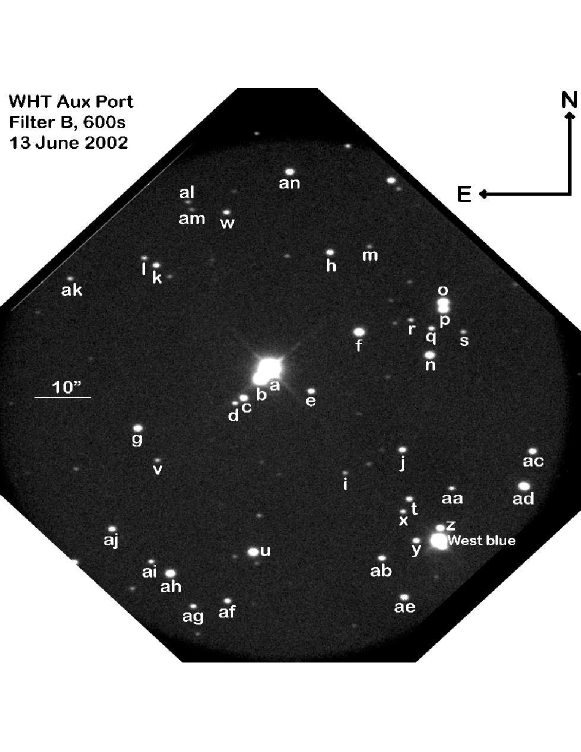
Tycho’s SNR lies close to the Galactic plane ( = 1.4 degrees, which means 59–78 pc above the Galactic plane). The remnant has angular radius of 4 arcmin. In RL04 a search was performed covering the innermost 0.65 arcmin radius centered on the Chandra X–ray observatory center of the SN, up to an apparent visual magnitude of 22. Presently we will discuss more stars, roughly doubling the radius of the searched area (see Figure 1). The coordinates of the Chandra geometrical center of the remnant are: RA = 00h 25m 19.9s, DEC = 64o 08’ 18.2” (J2000). This is the preferred center, which pratically coincides with that of ROSAT (Hughes 2000), that differs by only 6.5 arcsec. The centroid in radio, from VLA (Reynoso et al. 1997), is also nearby. The stars closest to the center are A, B, C, D, E, F and G. They are the preferred candidates because of that.
The distance to SN 1572 has been subject to study using different methods. The estimated value is converging into a value in the middle of the range from 2 to 4 kpc. Chevalier, Kirshner & Raymond (1980) using the the expansion of the filaments in the remnant and the shock velocity obtained a distance of 2.30.5 kpc. A similar distance was obtained by Albinson et al. (1986) through the observation of neutral hydrogen towards the supernova. They place the distance in the range of 1.7–3.7 kpc. Just one year later, Kirshner, Winkler & Chevalier (1987) revisited the distance through the expansion of the filaments of the remnant and found it to be between 2.0 and 2.8 kpc.
In 2004, Ruiz–Lapuente (2004) attempted a different approach. By assembling the records of the historical observations of this supernova in 1572–1574 and evaluating the uncertanties, it was possible to reconstruct the light curve of the SNIa and the colour. After applying the stretch factor fitting of light curves of SNe, it was possible to classify this SN within the family of SNe Ia. The derived absolute magnitude was found to be consistent with a distance of 2.8 0.4 kpc for the scale of 65 km s-1 Mpc-1. In this determination, the extinction towards the supernova was derived from the reddening as shown in the color curve of the SN. Given that present estimates of H0 are 67 km s-1 Mpc-1, this impacts into a somehow smaller value around 2.7 kpc.
With the acknowledgement of those uncertainties, we take a range of possible distance, in this paper, between 1.7 and 3.7 kpc (2.7 1 kpc) and we study all the stars within this distance range as derived by Gaia as potential candidates. We discuss the distance to the stars in the next section and we come back to it when talking about candidate stars. We now see a difference in the distance towards some stars, and we compare with that published before.
3. Parallaxes and Gaia distances
| Star | Gaia ID | cos | |||
|---|---|---|---|---|---|
| [mas] | [mas/yr] | [mas/yr] | [mag] | ||
| (1) | (2) | (3) | (4) | (5) | (6) |
| A | 431160565571641856 | 1.0310.052 | -5.3210.076 | -3.5170.065 | 12.4040.001 |
| B | 431160569875463936 | 0.4910.051 | -4.5050.063 | -0.5070.049 | 15.1130.001 |
| C1 | 431160359417132800 | 5.3100.483 | -2.4150.735 | -0.2060.576 | 18.0270.006 |
| D | 431160363709280768 | 1.6230.318 | -4.5660.636 | -2.2480.376 | 19.3710.003 |
| E | 431160565573859584 | 0.1380.220 | 0.2320.377 | -0.6990.265 | 18.9700.002 |
| F | 431160569875460096 | 0.4660.079 | -5.7390.130 | -0.2920.097 | 17.0360.001 |
| G | 431160359413315328 | 0.5120.021 | -4.4170.191 | -4.0640.143 | 17.9880.001 |
| H | 431160599931508480 | 0.6200.203 | -4.8390.341 | -0.5770.248 | 18.8950.002 |
| I | 431160569867713152 | -0.0140.566 | -1.4790.970 | -0.8550.761 | 20.3510.006 |
| J | 431160565571749760 | 0.1340.240 | -3.9000.373 | -1.0540.292 | 18.9650.002 |
| K | 431160393780294144 | -0.2660.290 | -1.7350.601 | -0.8150.350 | 19.3130.003 |
| L | 431160398076768896 | 0.6890.457 | -2.4710.876 | 0.5140.578 | 20.0720.005 |
| M | 431160604230502400 | -2.2821.316 | 3.4721.943 | -1.6242.070 | 20.9000.011 |
| N | 431160565571767552 | 0.2460.096 | 0.0920.148 | 0.1340.121 | 17.6120.001 |
| O | 431160569875457792 | 1.1690.063 | 2.6070.098 | 2.1080.076 | 16.5420.001 |
| P | 431160565571767424 | 0.1680.092 | -0.8890.139 | -0.3890.106 | 16.9980.001 |
| Q | 431160565575562240 | 0.6630.334 | 0.4380.643 | 1.4090.404 | 19.4960.004 |
| S | 431160565573859840 | 1.2350.417 | 2.0910.771 | -0.4370.491 | 19.5680.003 |
| T | 431159088102994432 | 0.5650.289 | -5.1770.563 | 0.0040.353 | 19.3200.003 |
| U | 431159092406721280 | 0.5040.070 | -1.8770.113 | -5.0960.083 | 17.0640.001 |
| V | 431160359413311616 | 0.0591.023 | -2.2011.184 | 1.6451.279 | 20.2350.007 |
| W | 431160393773079808 | 0.1930.283 | -2.7600.600 | 0.1630.343 | 19.3120.003 |
| X | 431159092398964992 | 0.1920.427 | -1.1870.812 | -0.8360.511 | 19.8120.004 |
| Y | 431159092406717568 | 0.6310.223 | 0.1440.347 | -2.2610.290 | 18.9230.002 |
| Z | 431159092398966400 | 0.1760.146 | -1.4980.233 | -0.2940.193 | 18.0820.002 |
| AA | 431159088102995968 | 0.9570.467 | -2.2770.977 | -1.1840.595 | 19.9730.005 |
| AB | 431159088102989056 | -0.0900.267 | -2.0110.445 | -1.6000.316 | 19.0460.002 |
| AC | 431159088103003520 | 0.4900.160 | -2.3760.249 | -1.4450.195 | 18.3990.001 |
| AE | 431159088102986880 | 0.2790.173 | -0.9070.268 | -0.2410.227 | 18.5590.002 |
| AF | 431158881944551424 | 1.3230.324 | -2.3810.644 | 0.4890.400 | 19.3990.003 |
| AG | 431158881944550272 | 0.7030.382 | -2.4120.779 | 0.6260.453 | 19.7680.004 |
| AH | 431158881944553216 | 0.2060.087 | -0.7040.139 | -0.5790.107 | 17.4860.001 |
| AI1/HP1 | 431160359417132928 | 2.8310.273 | 71.5580.530 | -3.0300.322 | 19.1590.003 |
| AJ | 431160359413306368 | 0.1870.206 | -1.1020.333 | 0.2220.249 | 18.8830.002 |
| AK | 431160393773068032 | -0.4760.447 | -1.3060.938 | -0.1420.518 | 20.0080.005 |
| AL | 431160398072078592 | 0.3830.618 | -2.8271.199 | 0.7270.789 | 20.4610.006 |
| AM | 431160398073281792 | 0.7520.825 | 0.3031.636 | -2.9401.114 | 20.6050.008 |
| AN | 431160599931516288 | 0.6050.138 | -4.5600.221 | -1.3300.168 | 18.2840.001 |
| Star | B | V | R | d (B14) | d | cos | cos (B14) | (B14) | |
|---|---|---|---|---|---|---|---|---|---|
| [mag] | [mag] | [mag] | [kpc] | [kpc] | [mas/yr] | [mas/yr] | [mas/yr] | [mas/yr] | |
| (1) | (2) | (3) | (4) | (5) | (6) | (7) | (8) | (9) | (10) |
| A | 14.820.03 | 13.290.03 | 12.240.03 | 1.10.3 | 0.97 | -3.630.08 | — | -3.060.07 | — |
| B | 16.350.03 | 15.410.03 | — | 2.60.5 | 2.03 | -2.900.06 | -1.670.06 | -0.090.05 | 0.590.08 |
| C1 | 21.060.12 | 19.060.05 | 17.770.03 | 0.750.5 | 0.18 | -0.820.73 | -1.980.07 | 0.390.58 | -1.090.06 |
| C2 | 22.910.20 | 20.53015 | — | 40 | — | — | -1.750.07 | — | -1.070.07 |
| C3 | — | — | — | — | — | — | 0.080.11 | — | -0.140.10 |
| D | 22.970.28 | 20.700.10 | 19.380.06 | 0.80.2 | 0.62 | -2.970.64 | -2.030.09 | -1.650.38 | -1.280.07 |
| E | 21.240.13 | 19.790.07 | 18.840.05 | 20 | 7.22 | 1.830.38 | 1.740.05 | -0.100.26 | 0.280.05 |
| F | 19.020.05 | 17.730.03 | 16.940.03 | 1.50.5 | 2.15 | -4.140.13 | -3.310.15 | 0.310.10 | 0.250.07 |
| G | 20.090.08 | 18.710.04 | 17.830.03 | 2.5-5.0 | 1.95 | -2.820.19 | -2.630.06 | -3.460.14 | -3.980.04 |
| H | 21.390.14 | 19.800.07 | 18.780.05 | 1.8/24 | 1.61 | -3.240.34 | -3.130.07 | -0.020.25 | -0.840.03 |
| I | — | 21.750.16 | 20.360.09 | 4 | 1.81 | 0.120.97 | 0.690.06 | -0.250.76 | -0.200.06 |
| J | 21.150.12 | 19.740.07 | 18.840.05 | 9 | 7.46 | -2.300.37 | -2.350.06 | -0.450.29 | -0.280.03 |
| K | 21.640.15 | 20.110.08 | 19.150.05 | 2.4/27 | 41.67 | -0.140.60 | 0.240.12 | -0.210.35 | 0.030.07 |
| L | 22.770.26 | 21.080.12 | 20.000.07 | 4 | 1.45 | -0.870.88 | 0.360.12 | 1.110.58 | -0.080.04 |
| M | 23.490.36 | 21.820.16 | 20.720.10 | 4 | — | 5.071.94 | -0.610.12 | -1.022.07 | 0.440.08 |
| N | 19.590.06 | 18.290.04 | 17.470.03 | 1.5-2 | 4.06 | 1.690.15 | 2.640.13 | 0.740.12 | 0.960.04 |
| O | 18.620.04 | 17.230.03 | 16.370.03 | 1 | 0.85 | 4.210.10 | 5.130.20 | 2.710.08 | 2.850.14 |
| P1 | — | 17.610.03 | 16.780.03 | 1 | 5.96 | — | 1.390.36 | — | 0.200.09 |
| P2 | — | — | — | — | — | — | -0.270.20 | — | -1.640.21 |
| Q | 22.350.21 | 20.590.09 | 19.410.06 | 2 | 1.51 | 2.040.64 | 1.340.09 | 2.710.40 | 2.380.04 |
| R | 22.910.28 | 21.380.13 | 20.260.08 | 3.30.2 | — | — | -0.180.10 | — | 0.250.05 |
| S | — | 21.300.13 | 19.740.07 | 1.30.1 | 0.81 | 3.690.77 | 3.680.09 | 0.160.49 | 0.930.05 |
| T | 21.820.17 | 20.230.08 | 19.200.05 | 2/30 | 1.77 | -3.580.56 | -2.960.04 | 0.610.35 | -0.530.05 |
| U | 19.030.05 | 17.730.03 | 16.950.03 | 1 | 1.98 | -0.280.11 | 0.390.10 | -4.490.08 | -4.310.07 |
| V | 23.320.33 | 21.410.13 | 20.200.08 | 3 | 16.81 | -1.161.18 | -0.670.08 | 2.251.28 | 0.490.08 |
| W | 22.130.19 | 20.440.09 | 19.270.05 | 2 | 5.17 | -1.160.60 | -0.310.09 | 0.760.34 | 0.090.04 |
| Star | G | d | cos | cos (B14) | (B14) | |
|---|---|---|---|---|---|---|
| [mag] | [kpc] | [mas/yr] | [mas/yr] | [mas/yr] | [mas/yr] | |
| (1) | (2) | (3) | (4) | (5) | (6) | (7) |
| X | 19.81 | 5.20 | 0.410.81 | 1.320.06 | -0.240.51 | -0.260.06 |
| Y | 18.92 | 1.58 | 1.740.35 | 2.520.03 | -1.660.29 | -1.750.07 |
| Z | 18.08 | 5.68 | 0.100.23 | 0.780.04 | 0.310.19 | 0.060.07 |
| AA | 19.97 | 1.04 | -0.681.00 | -3.190.07 | -0.580.60 | -1.420.04 |
| AB | 19.05 | 5.65 | -0.410.45 | -0.370.03 | -1.000.32 | -1.010.06 |
| AC | 18.40 | 2.04 | -0.780.25 | -1.090.07 | -0.840.20 | -0.870.04 |
| AD1 | 17.22 | 1.04 | 0.850.59 | -1.240.14 | — | -1.580.16 |
| AD2 | — | — | — | -1.120.04 | — | -2.250.07 |
| AE | 19.05 | 3.58 | 0.690.27 | 1.070.06 | 0.360.23 | -0.050.06 |
| AF | 19.40 | 0.76 | -0.780.64 | -0.380.04 | 1.090.40 | 0.010.07 |
| AG | 19.77 | 1.42 | -0.810.78 | -1.110.06 | 1.230.45 | 0.930.08 |
| AH | 17.49 | 4.85 | 0.890.14 | 1.260.20 | 0.020.11 | -0.200.26 |
| AI1/HP-1 | 19.16 | 0.35 | 73.160.53 | 73.070.09 | -2.430.32 | -2.820.07 |
| AI2 | — | — | — | 1.760.28 | — | 0.160.21 |
| AJ | 18.88 | 5.35 | 0.500.33 | 0.180.05 | 0.820.25 | 0.730.07 |
| AK | 20.01 | — | 0.290.94 | -0.250.09 | 0.460.52 | 0.950.08 |
| AL | 20.46 | 2.61 | -1.231.20 | -0.140.09 | 1.330.73 | -0.350.09 |
| AM | 20.61 | 1.33 | 1.901.64 | -1.360.10 | -2.341.11 | -0.600.10 |
| AN | 18.28 | 1.65 | -2.960.22 | -2.830.11 | -0.730.17 | -0.960.05 |
Distances to the stars targeted as possible surviving companions of SN 1572 had first been estimated by RL04 (see their Table 1), for 13 of them. Those estimates were made by fitting synthetic spectra (under the assumption of local thermodynamic equilibrium, LTE) to the observed ones. The grids of model atmospheres and the atomic data from Kurucz (1993), in combination with the Uppsala Synthetic Spectrum Package (1975), were used in the spectrum synthesis. The atmospheric parameters effective temperature and surface gravity were thus determined. Intrinsic colours and absolute visual magnitudes were then deduced from the relationships between spectral type and colour and spectral type and absolute magnitude for the different luminosity classes (Schmidt–Kahler 1982). Comparison with photometry obtained with the 2.5m Isaac Newton Telescope, in La Palma, yielded the reddening , from which the visual extinction and the corrected apparent visual magnitude were calculated. The high–resolution spectra had been obtained with the UES and ISIS spectrographs, in the 4.2m William Herschel Telescope, in La Palma. Low–resolution spectra came, in addition, from the LRIS imaging spectrograph in the 10m Keck Telescopes, in Hawaii. They were compared, after dereddening, with template spectra from Lejeune et al. (1997), and that supplemented the information obtained from the high–resolution spectra.
The detailed characterization of Tycho G (singled out as a likely SN companion in RL04) was done by GH09 using a high–resolution HIRES spectrum obtained at the Keck I telescope. The stellar parameters, effective temperature and gravity, were derived using the excitation and ionization equilibria of Fe together with the fit of the wings of the H line compared to different synthetic spectra computed. The result pointed to a G2 IV star with metallicity slightly below solar. The individual magnitudes in the different filters were used to estimate a range of possible distances of star G. In addition, low–resolution LIRIS spectra of the stars E, F, G, and D were obtained, which confirmed the spectral types of these stars. The best fit for Tycho G gave Teff = 5900 150 K, log = 3.85 0.35 dex, and [Fe/H] = -0.05 0.09 (see GH09). This result is consistent with that obtained by K13.
K13 recalculated spectrophotometric distances to 5 of the stars (A, B, C, E and G). Many of them had large error bars and are compatible with the distance estimate in B14 and the distance values implied by Gaia parallaxes, except for the value given for their star C (star C is in fact three stars. Star C1 has a measured Gaia parallax corresponding to a distance of d 0.18 kpc. The estimate in B14 is compatible with that value, whereas K13 found a too large distance of 5.53.5 kpc.) Finally, in B14 there is a list of distances to 23 stars (A to W) (their Table 3), completing the work of RL04. The distances in B14 are in reasonable agreeement (within 1 ) with the Gaia parallaxes (see Table 2).
Now the DR2 from Gaia has provided us with precise parallaxes for almost all the stars included in those previous studies. The corresponding distances and their errors are given in columnn 6 of Table 2, for the stars for which we already had estimates of the distances (column 5), and in column 3 of Table 3 for those for which there were none. Gaia DR2 distances are estimated as the inverse of the parallax.
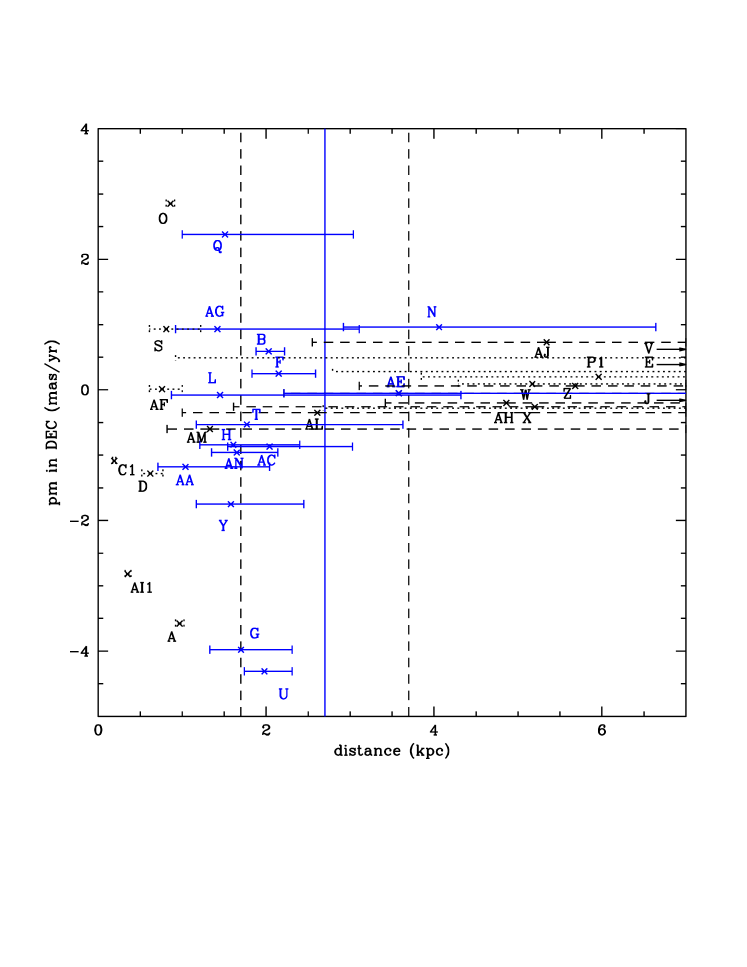
In Figure 2 are shown the Gaia DR2 distances and their error bars, and they are compared with the estimated distance to Tycho’s SNR (blue vertical line) and its error bars (black dashed vertical lines). Proper motions in declination are on the vertical axis. Solid (blue) error bars mark the stars that, within reasonable uncertainties, might be inside Tycho’s SNR. Dashed (black) error bars correspond to stars that, although the error bars of their distances reach the range of distances to the SNR, the errors are so large as to make their association with the SNR very unlikely. Finally, dotted (black) lines correspond to the stars that have incompatible distances with the SNR or parallax errors larger than 100.
There are 15 stars within the range of possible distances to the SNR (1.7 d 3.7 kpc). These are stars B, F, G, H, L, N, Q, T, U, Y, AA, AC, AE, AG and AN. From this list of stars, stars G and U have significant proper motions in declination. Proper motions of all the targeted stars will be discussed in the next Section.
In Table 1, the Gaia DR2 data on parallaxes, proper motions, and magnitudes G are given as in the Gaia DR2. The proper motions are absolute, referred in the ICRS (as mentioned above).
In Table 2, the Gaia DR2 distances, as we announced, are compared with the distances deduced in B14 from determination of the stellar atmospheric parameters and comparison of the resulting luminosities with the available photometry. We see that there is reasonable agreement in most cases, with a tendency to place the stars at longer distances in B14 as compared with Gaia, which can be attributed to an underestimate, in B14, of the extinction in the direction of Tycho’s SNR. Based only on the stars with distance errors 0.5 kpc in both sets, the underestimate would be by mag. Exceptions are stars N, P1, U, V and W, although in the two latter cases the Gaia error bars are so large that the comparison is not really meaningful.
4. Proper motions from Gaia compared with the HST
High velocities, mainly due to their orbital motion at the time of explosion, must be a salient characteristic of SNe Ia companions. Unless they were mostly moving along the line of sight when the binary system was disrupted, the components of the velocity on the plane of the sky should be observed as high proper motions relative to the stars around the location of the SN. It might happen that the star were moving at some angle with the line of sight and thus the components of the velocity would be distributed accordingly.
The location of the supernova explosion, in the case of SNe whose remnants still exist, is given in a first, rough approximation, by the centroid of the remnant. High–precision astrometric measurements of the proper motions of the stars within some angular distance from the centroid are the tool needed to detect or discard the presence of possible companions. Until the advent of Gaia, this was only possible with HST astrometry. Radial velocities obtained from high resolution spectra give the complementary information on the velocity along the line of sight.
A first set of measurements of the proper motions of the stars around the centroid of Tycho’s SNR was made in RL04. It included 26 stars, labelled from A to W (see their Fig. 1). Images from the WFPC2 aboard the HST, taken two months apart (within Cycle 12), were used. It was found that star G was at compatible distance to the supernova (the distance estimate for Tycho G, (most widely named star G) was 3.0 kpc and its motion was mostly perpendicular to the Galactic plane, with = 6.111.34 mas/yr ( = -2.61.34 mas/yr only). That meant a heliocentric tangential velocity 94 km/s, which combined with a high measured radial velocity of -87.4 0.5 km/s it gave a total heliocentric velocity 128 km/s 9 km/s, making star G a likely candidate to have been the companion star of SN 1572.
In B14, proper motions cos = -2.630.18 mas/yr, and = -3.980.10 mas/yr were measured. That, for a distance of 2.830.79 kpc, taken as the SN distance, give a heliocentric tangential velocity = 6411 km/s. Given the heliocentric radial velocity, = -87.40.5, the total velocity is = 1089 km/s.
Now, from the Gaia DR2, cos = -4.4170.191 mas/yr and = -4.0640.143 mas/yr. The parallax being = 0.5120.021, we have cos = -40.882.44 km/s, = -37.612.03 km/s, and = 55.552.26 km/s (heliocentric).
For the corresponding , it results a = 103.69 7.52 km/s. We thus see that, as compared with B14, there is no significant change with the new results. As in B14, they can be interpreted in the framework of a binary model similar to that for U Sco. The excess velocity of star G with respect to the average of the stars at the same location in the Galaxy could come from the orbital velocity it had when the binary was disrupted by the SN explosion.
Taking as a reference the Besançon model of the Galaxy (Robin et al. 2003), the average heliocentric tangential velocity of disc stars, at the position and distance of star G, is almost negligible, while the average radial velocity, is km/s. Then, attributing the excess over average in radial velocity ( -56 28 km/s) to orbital motion and the full tangential velocity ( 55 2 km/s) to it, we obtain that 78 20 km/s (the inclination of the plane of the orbit with respect to the line of sight would thus be = 44o).
The evolutionary path giving rise to SN 1572 might have started from a WD with a mass 0.8 M⊙ plus a somewhat evolved companion of 2.0-2.5 M⊙ filling its Roche lobe (RL04), the system ending up as a WD with the Chandrasekhar mass ( 1.4 M⊙), plus a companion of 1 M⊙. Using Kepler’s law, that (with in years, in astronomical units, and in solar masses), and since , we find a separation , the period being days. Using Eggleton’s (1983) formula
( being the mass ratio ) for the effective Roche lobe radius of the companion just before the explosion, it would thus have been 9 R⊙. At present, the radius of the star is only of 1-2 R⊙ (GH09), and would have resulted from the combination of mass stripping and shock heating by the impact of the SN ejecta, plus subsequent fast cooling of the outer layers up to the present time.
However, an alternative to this hypothesis is discussed later in the paper.
In B14, the proper motions of 872 stars were measured from astrometry, using images taken in up to four different epochs and spanning a total of 8 yr. Much higher precision than in RL04 was achieved. The results for 45 of them (all the stars with names in Figure 1) are given in Table 2 and Table 3 of B14. The full version was provided as supplementary electronic material.
When comparing the proper motions given by the Gaia DR2 with those obtained by B14 from the astrometry done with the HST, one must take into account that the former are absolute measurements, in the ICRS system, while the latter are relative measurements. This means that the local frame used for the HST astrometry should, in general, move with respect to the ICRS frame. Such systematic effect is actually seen when we make the comparison. In Tables 2 and 3, the Gaia proper motions have been transformed to the HST frame.
Including only the stars with proper motion errors smaller than 0.25 mas/yr in B14, we find that, on average, and .
In Table 2 (columns 7 and 9) and Table 3 (columns 4 and 6), we have transformed the Gaia proper motions to the B14 HST frame according to these relations. For our purposes, the local, relative proper motions are most meaningful, since we are interested in the motions of the stars with respect to the average motions of those around their positions. After applying these zero–point shifts, there still are residual differences between the two proper motion sets. On average, and . The whole set is included here, the dispersion being mainly due to stars which have substantial errors in their Gaia proper motions (see columns 7 and 9 in Table 2 and columns 4 and 6 in Table 3, as well as columns 5 and 6 in Table 4).
5. Toomre diagram
Gaia provides a five–parameter astrometric solution and for some stars line–of–sight velocities (, , , , , Vr), together with their associated uncertainties and correlations between the astrometric quantities. For the 13 stars for which we also know their radial velocities, the total space velocities can be derived. It is most useful to see their components in the Galactic coordinate system: U (positive in the direction of the Galactic center), V (positive in the direction of Galactic rotation) and W (positive in the direction of the North Galactic Pole) in the LSR. In Table 4 we give the U, V and W components of the space velocities, as well as the total velocities on the Galactic meridian plane, in the Local Standard of Rest, of these 13 stars, based on the Gaia DR2 parallaxes and proper motions and on the radial velocities from B14 (save for star A, which has a quite precise radial velocity from Gaia). For the transformation of the motions from heliocentric to the LSR, we have adopted, as the peculiar velocity of the Sun with respect to the LSR, (U⊙, V⊙, W⊙) = (11.1, 12.24, 7.25) km s-1 (Schönrich et al. 2010).
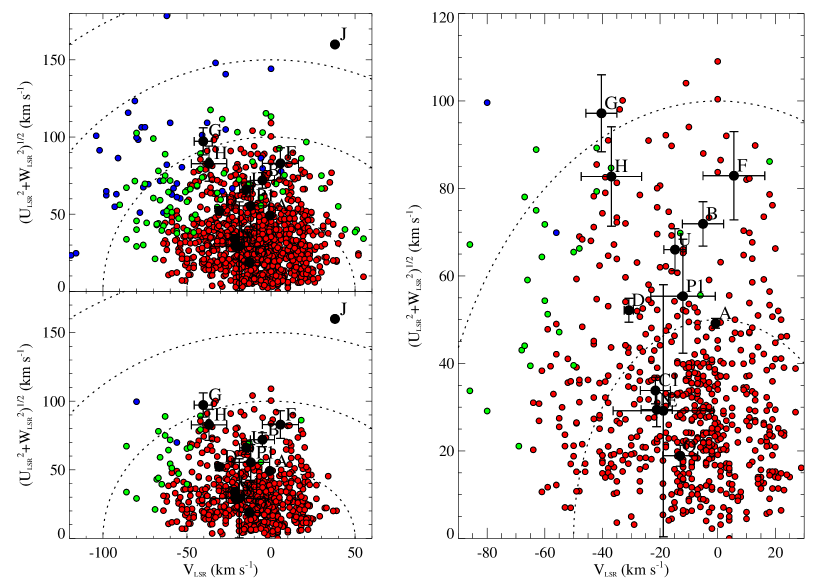
The Toomre diagram shows the distribution of U,V,W velocities in the LSR. This diagram combines quadratically U and W versus V and allows to distinguish between stars belonging to different Galactic stellar components (thin disk, transition thin–-thick, thick disk, and halo). Adibekyan et al. (2012) sample, with very high quality spectroscopic data from the HARPS exoplanet search program, is used as a reference in Figure 3. The data have very high precision on radial velocities, stellar parameters and metallicities. Therefore, the Toomre diagram obtained from this sample combines kinematics information such as orbital motion together with the information derived from the spectroscopic analysis on element abundances. The sample covers a wide range of metallicities [Fe/H] from -1.2 to 0.4.
The sample in the upper left panel of Figure 3 has no imposed boundaries on metallicity, while those in the lower left and the right panels include only stars with metallicities equal to or higher than that of star G minus the 1 uncertainty, i.e. for [Fe/H] -0.14. One sees there that (with the exception of star J, whose kinematics is very unreliable, with large errors in the Gaia DR2 data), no other star in our sample moves as fast as star G.
The Gaia DR2 data place star G above the region where most thin disk stars are. The kinematics of star G would locate it among the thick disk stars but its metallicity is that of a thin disk star, while at its location, only 48 pc above the Galactic plane, the density of thick disk stars is very low. Using the Adibekyan et al. (2012) sample, the probability that star G belonged to the thick disk, given its metallicity, is only of 2 .
There are some thin disk stars, however, that move fast on the Galactic meridian plane, and thus star G might belong to this group, although, as we will see, it includes only a small fraction of the thin disk stars.
Quantitatively, in the sample from Adibekyan et al. (2012), of 1111 FGK dwarf stars, there are 601 thin disk stars with metallicities [Fe/H] -0.14. 446 of them (74,2%) are inside the circle 50 km/s, and 596 are inside the 100 km/s circle. Only 5 (0.8%) have velocities higher than 100 km/s. That is, therefore, (0.8%), the probability, from kinematics alone, that star G were just a fast–moving thin disk star.
In Section 6 the orbits of the stars are discussed and the question of the detailed chemical abundances of star G will be addressed.
| Star | DR2 number | U | V | W | |||||
|---|---|---|---|---|---|---|---|---|---|
| (4311 …) | (mas) | (km/s) | (mas/yr) | (mas/yr) | (km/s) | (km/s) | (km/s) | (km/s) | |
| (1) | (2) | (3) | (4) | (5) | (6) | (7) | (8) | (9) | (10) |
| A | 60565571641856 | 1.030.05 | -301 | -5.3210.076 | -3.5180.065 | 48.651.12 | -0.740.74 | -7.120.82 | 49.171.11 |
| B | 60569875463936 | 0.490.04 | -458 | -4.5050.063 | -0.5070.049 | 71.695.08 | -5.107.15 | 5.720.53 | 71.915.07 |
| C1 | 60359417132800 | 5.310.48 | -406 | -2.4150735 | -0.2060.576 | 33.223.06 | -23.005.20 | 6.290.54 | 33.813.05 |
| D | 60363709280768 | 1.620.32 | -58 0.8 | -4.5660.636 | -2.2480.376 | 52.162.73 | -30.831.61 | 0.641.68 | 52.162.73 |
| E | 60565573859584 | 0.140.22 | -3318 | 0.2320.377 | -0.6990.265 | 22.8017.45 | -18.8717.43 | -18.2042.45 | 29.1828.82 |
| F | 60569875460096 | 0.470.08 | -4111 | -5.7390.130 | -0.2920.097 | 82.4010.16 | 5.6310.72 | 9.191.02 | 82.9110.10 |
| G | 60359413315328 | 0.510.12 | -870.5 | -4.4170.191 | -4.0640.143 | 93.018.85 | -40.335.37 | -28.208.28 | 97.198.80 |
| H | 60599931508480 | 0.620.20 | -7810 | -4.8390.341 | -0.5770.248 | 82.6111.38 | -36.8910.49 | 4.672.02 | 82.7411.36 |
| J | 60565571749760 | 0.130.24 | -526 | -3.9000.373 | -1.0540.292 | 159.03214.99 | 38.04125.88 | -17.1045.78 | 159.94213.81 |
| N | 60565571767552 | 0.250.10 | -376 | 0.0920.148 | 0.1340.121 | 28.124.02 | -21.185.41 | 8.712.25 | 29.443.90 |
| O | 60569875457792 | 1.170.05 | -227 | 2.6070.098 | 2.1080.076 | 12.573.57 | -13.006.07 | 14.120.47 | 18.902.40 |
| P1 | 60565571767424 | 0.170.09 | -4310 | -0.8890.139 | -0.3890.106 | 55.1313.04 | -11.7111.20 | -2.176.32 | 55.1713.03 |
| U | 59092406721280 | 0.500.07 | -454 | -1.8770.113 | -5.0960.083 | 52.703.32 | -14.823.86 | -39.776.62 | 66.024.78 |
6. Star’s orbits
Using the Gaia DR2 data system, we can calculate the orbits of the stars in the Galaxy. With known distances, proper motions can be translated into tangential velocities. From that and from the radial velocities already obtained, the total velocities of the targeted stars are reconstructed and their orbits as they move across the Galaxy can then be calculated.
The stellar orbits are obtained by integration of the equations of motion. A 3D potential of the Galaxy is required for that. Here we use an axysimmetric potential consisting of a spherical central bulge, a disk and a massive spherical halo, developed by Allen & Santillán (1991). It is an analytic potential that allows an efficient and accurate numerical computation of the orbits. In the present case, the total mass of the Galaxy is assumed to be 9 M⊙. We take the Sun to be at 8.5 kpc from the Galactic center and moving circularly with a frequency = 25.88 km s-1 kpc-1. We do not consider a Galactic bar nor a spiral arms potential.
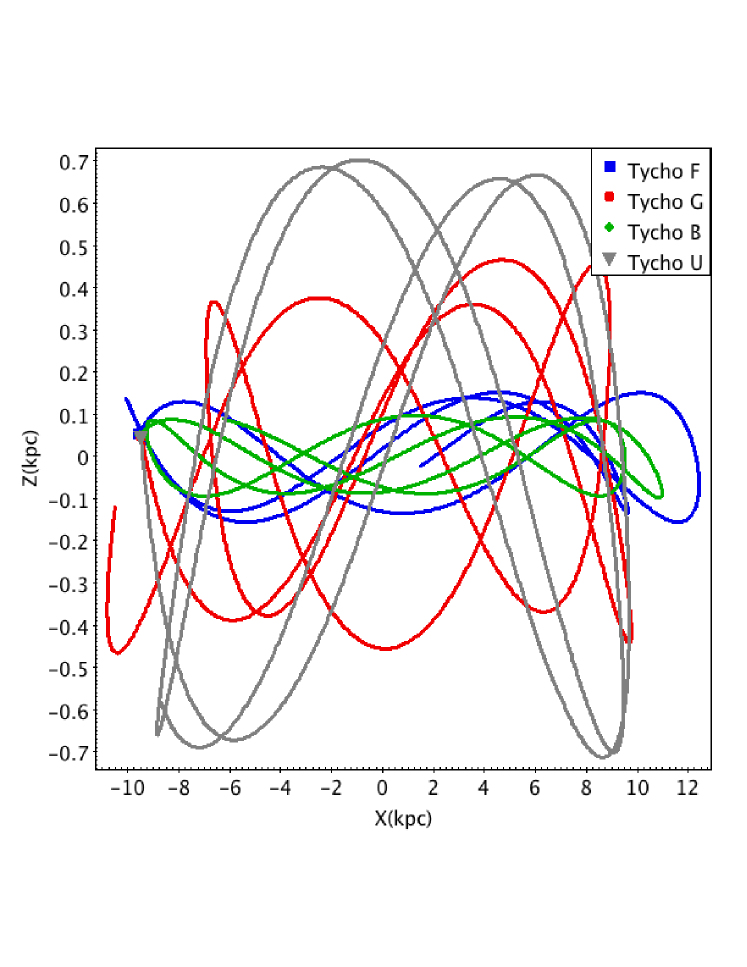
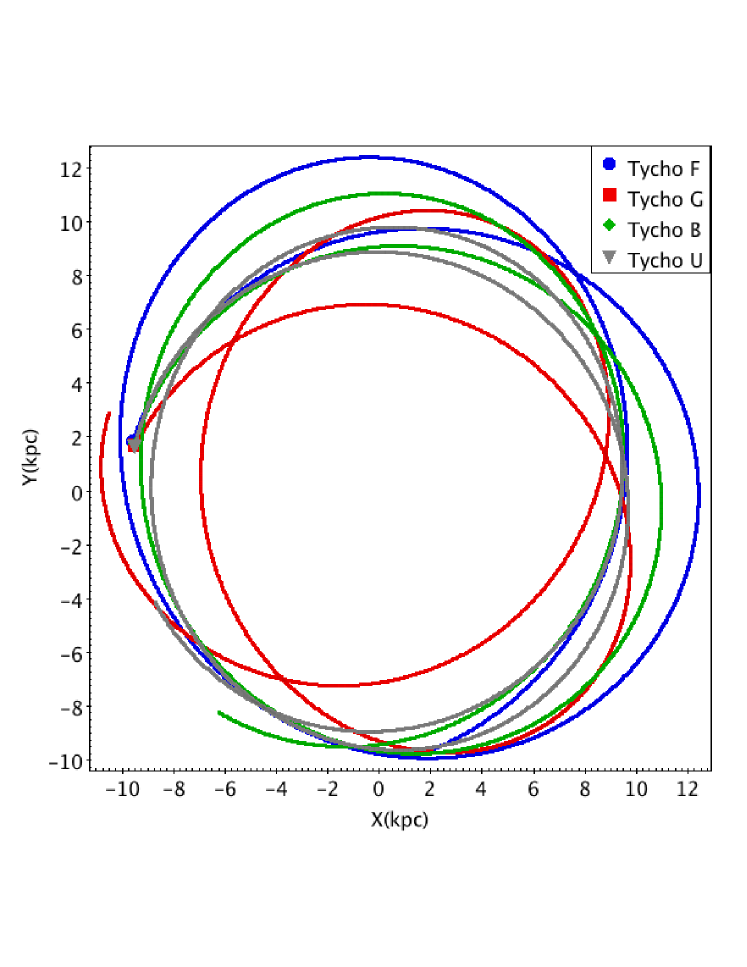
In Figure 4 we show the orbits of stars B, G, F and U. We see that only stars G and U do reach large distances above and below the Galactic plane, while the other two stars, in contrast, do not appreciable leave it. It can also be noted, in the motion parallel to the Galactic plane, the large eccentricity of the orbit of star G.
The Figure is meant to show how far from the Galactic plane do reach the stars with significant proper motions in and . We take four stars with distance compatible with that of the SN. We see that star G will reach up to 500 pc and star U up to almost 700 pc above the Galactic plane within the next 500 Myr. In contrast, Tycho B and Tycho F (which have an insignificant ) do not reach 200 pc in their orbits in any lapse of time. We have shown Tycho B and Tycho F, because those have 4 mas yr-1 but negligible . Their orbits do not look peculiar. These are example of the many stars in a similar situation, which can be seen in our Tables. They will be thin disk stars (as seen in the Toomre diagram). The case of star U is unique, in the sense that it has a slighly larger than Tycho G. Tycho U has a negligible . This makes its orbit very circular. Tycho G has about the same proper motions in and in . This is why it reaches 500 pc above the Galactic plane but, at the same time, unlike star U, its orbit is eccentric.
The total velocity of star G is larger than that of star U. This can already be seen from the orbit and more explicitly in the Toomre diagram. When we add the radial velocity vector to obtain the total velocity for star G, we have a vr = -87.40 km s-1 (heliocentric), which is larger than that of star U (-45.40 km s-1). Thus total velocity for star G is 103.69 km s-1 while for U is only 68.63 km s-1.

In Figure 5, we have made an histogram of the heliocentric radial velocities of the stars at distances between 1.7 d 3.7 within 1 degree from the geometrical center of the SN. We see there that the position of star G is anomalous. We also see that around 1 degree in the SN position the heliocentric radial velocities are small.
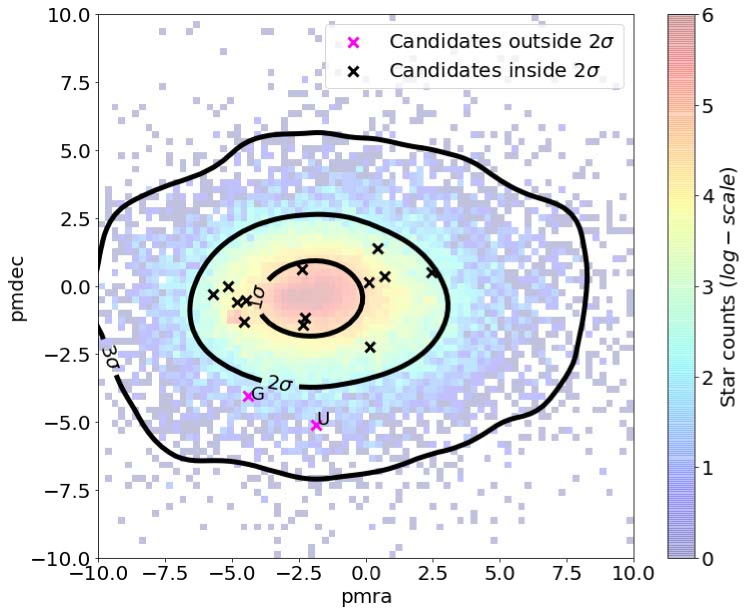
In Figure 6 we show the position of the stars compatible with the distance of SN 1572 in proper motions in right ascension and declination. All stars are those from the Gaia DR2 within 1 degree from the SN 1572 center and 1.7 d 3.7 kpc. It is worth noting the logarithmic scale. Basically within 1 degree of the center of SN 1572 and those distances the large majority of stars have very low proper motions.
Readers might ask what happens with the stars, in the full sample of Tables 2 and 3, that do not have measured heliocentric radial velocities because they were far from the 15% of the radius of the remnant explored in RL04. The Gaia DR2 data show no significant proper motions for any of them.
7. Candidate stars
In order to evaluate the likelyhood that a given star were the companion of the SN, we look at the distances provided by Gaia parallaxes and to the proper motions. For some of the stars, we also have radial velocities, obtained from high resolution spectra. Parallaxes and proper motions allow to discern whether a given star has received extra momentum from the disruption of a binary system to which it belonged. Such extra momentum (relative to the motion of the center of mass of the binary) mostly comes from the orbital motion of the star when the system was disrupted by the SN explosion. There is also some kick due to the impact of the SN ejecta on the companion, but it is comparatively small and depends on orbital separation and on how compact the companion is. In the hydrodynamic simulations of Marietta, Burrows & Fryxell (2000), the momentum gained from the kick ranges from 12% to 50% of the momentum the star had before explosion, for main-sequence and subgiant companions, the kick being much smaller in the case of red giants. Similar values are found by Pan, Ricker & Taam (2014).
We examine first the stars closest to the geometrical center of the remnant.
Stars A to G
Star A is the closest star to the geometrical center of the SN remnant. From its stellar atmosphere parameters, this star is at the foreground of the SN. The Gaia parallax places it at 0.97 kpc. By comparison of the absolute magnitude corresponding to the stellar parameters with the photometric data, we had derived = 1.1 0.3 kpc (R04, B14).
Star B has recently been thought to be a foreground star (Kerzendorf et al. 2018). It is a hot star close to the geometrical center of the remnant. Gaia DR2 places this star at a distance compatible with that of the SNR. = 2.03 kpc, is now compatible with the SN distance. We already pointed out, in R04 and B14, that the star likely was at a distance compatible with that of the SNR. We can discard star B, however, on the basis of having no peculiar proper motions nor radial velocity. We have made a reconstruction of the orbit of star B and it moves on the Galactic plane without any disturbance towards upper or lower Galactic latitudes.
Stars C1, C2 and C3 have been observed by the HST. Gaia could only observe C1, and has determined it to be a very nearby star, at a distance of 0.18 kpc. From the stellar parameters, a distance of 0.750.5 kpc was estimated. For C2 and C3, RL04 and B14 could not estimate any distance, due to their faint magnitudes. The proper motion values for these three stars obtained from HST images in B14 show that they are moving close to the Galactic plane.
Star D is also very nearby. It is at a distance of 0.62 kpc according to Gaia. We had calculated a distance of = 0.80.2 kpc. Most of the targeted stars close to the geometrical center of the SNR are at distances below 1.5 kpc.
Star E, though, is at a very large distance. Gaia indicates a = 7.22 kpc (the upper limit correponds to a negative parallax). Star E was suggested as the SN companion by Ihara et al. (2007). The authors detected absorption lines in the blue side, of the spectrum, at 3720 Å, consistent with Fe absorption from Tycho’s SNR. They concluded that this might either be due to the Fe I in the SN ejecta or to a peculiarity of the star. In GH09 it was pointed out that it is likely a very distant star. In fact, both its distance and its kinematics do exclude it as a possible companion of the SN.
Star F is compatible with the distance to Tycho’s SN. Gaia measures a distance of = 2.15 kpc. We had calculated a distance = 1.50.5 kpc. It is not moving at high radial velocity nor does it have a high proper motion perpendicular to the Galactic plane. Its orbit does not depart from the Galactic plane.
Star G can also be considered among those close the center of the SNR. Gaia has measured a distance = 1.95 kpc, which is within the range of distances suggested for the Tycho SN. This star has been a proposed companion in R04, GH09, and B14. Its kinematics corresponds to that of a thick disk star, but it has a thin disk composition. It was found an enhanced in GH09 and questioned in K13. A new calculation was done in B14, which still shows a value larger than the solar. We leave this point aside and refer only to the agreed solar metallicity of the star.
All the previous stars have measured vr. They have been placed in the Toomre diagram (Figure 3 and Table 4).
Proposed stars at the NW of the geometrical center
Xue and Schaefer (2015) place the site of the explosion of Tycho’s SN at the NW of the geometrical center of the SNR. They base their claim, in part, on a reconstruction of the historical center using observations of astronomers that wrote records on SN 1572 in the year of its discovery. Their position is at odds with a previous historically based reconstruction of the location in the sky of SN 1572 from Stephenson & Clark (1977). On the other hand, Xue and Schaefer (2015) use a substitute of a 2D hydrodynamical simulation that, as noted by Williams et al. (2016), would only be valid for perfectly spherical remnants.
Xue & Schaefer (2015) give as the position of the explosion site R.A = 00h 25m 15.36s and Dec= 64o 08’ 40.2”. From it, they suggest that the companion star should be in a small circle around stars O and R. In their Figure 2 they point to stars O, Q, S and R. From the Gaia DR2 data, we see that stars O, Q and S are at too short distances, incompatible with the distance to Tycho’s SN. Star O is at a distance of 0.85 kpc. Star Q is at a distance of 1.51 kpc, only the upper limit being compatible with the distance to the SNR, but it has no high proper motions. Star S is also at a small distance of 0.81 kpc. Star R has no distance measurement nor proper motions in the Gaia DR2. However, we have proper motions measured with the HST (B14) and they are small. Star P is, as seen in the images of the HST, two stars P1 and P2. In the Gaia DR2 we have only the P1 parallax, though not very well determined but no proper motions are given. In B14, though, we have the proper motions of the stars and they are relatively small. P1 has a vr of –43 10 and it has been possible to place it in the Toomre diagram (Figure 3 and Table 4) where it shows no kinematic peculiarity. Star N is in the same area of he sky as stars O, P1 and P2, Q, R and S. It has small proper motions and it is possible to place it in the Toomre diagram, where it lies in the region of low kinematical values. In that corner of the sky suggested by Xue & Schaefer (2015), there is no star looking as a companion of Tycho’s SN in any way.
The NE proposed center
In a recent paper by Williams et al. (2016), the expansion center of the remnant is suggested to be at the NE of the geometrical center. These authors use an extrapolation of the trajectories of different regions of the SNR, but also a 2D hydrodynamical simulation of the expansion of the ejecta in an inhomegeneous medium. They also assume cylindrical symmetry in the initial ejection of the supernova material. However, Krause et al (2008), from the spectrum of the light echo of SN 1572, suggest that the explosion was aspherical and thus not cylindrically symmetric.
Their suggested center is at R.A. = 00h 25m 22.6s and Dec = 640 08 32.7. This would be close to stars L and K. L is a star at a distance of = 1.45 kpc, but with small proper motions. K has no distance determined by Gaia. In B14 we suggest it to be around 4 Kpc. The kinematics of the star, with small proper motions, makes it a non–suitable companion of Tycho’s SN. In the NE center there are other stars like W, AK, AL, and AM. These stars do not have accurate parallaxes in the Gaia DR2 release. They have upper limits in distance with negative parallaxes. We have looked at their kinematics and they have moderate and low proper motions.
Therefore, given the various candidates proposed, the best approach is to look for those that are within the range of the possible distance to Tycho’s SN, show a peculiar kinematics and are within the region of the sky already explored.
We have placed in Table 5 the different stars and evaluated their viability as possible companions.
| Star | 1.7 kpc 3.7 kpc | High Velocity | High |
|---|---|---|---|
| (1) | (2) | (3) | (4) |
| A | No ( = 0.97 kpc) | — | — |
| B | Yes ( = 2.03 kpc) | No ( = 725 km/s) | No ( = -0.5 0.6 km/s) |
| C1 | No ( = 0.18 kpc) | — | — |
| D | No ( = 0.62 kpc) | — | — |
| E | No ( = 7.22 kpc) | — | — |
| F | Yes ( = 2.15 kpc) | Yes ( = 8310 km/s) | No ( = 3 1 km/s) |
| G | Yes ( = 1.95 kpc) | Yes ( = 1037 km/s) | Yes ( = -33 9 km/s) |
| H | Yes ( = 1.61 kpc) | Yes ( = 9111 km/s) | No ( = -0.5 2.5 km/s) |
| I | — | — | — |
| J | No ( = 7.46 kpc) | — | — |
| K | — | — | — |
| L | Yes ( = 1.45 kpc) | No ( = 10 km/s) | No ( = -2 8 km/s) |
| M | — | — | — |
| N | Yes ( = 4.06 kpc) | No ( = 364 km/s) | No ( = 2 3 km/s) |
| O | No ( = 0.85 kpc) | — | — |
| P1 | No ( = 5.96 kpc) | — | — |
| Q | Yes ( = 1.51 kpc) | No ( = 24 km/s) | No ( = 10 10 km/s) |
| R | — | — | — |
| S | No ( = 0.81 kpc) | — | — |
| T | Yes ( = 1.77 kpc) | No ( = 30 km/s) | No ( = 4 3 km/s) |
| U | Yes ( = 1.98 kpc) | No ( = 685 km/s) | Yes ( = -46 8 km/s) |
| V | No ( = 16.81 kpc) | — | — |
| W | No ( = 5.17 kpc) | — | — |
| X | No ( = 5.20 kpc) | — | — |
| Y | Yes ( = 1.58 kpc) | No ( = 18 km/s) | No ( = -17 9 km/s) |
| Z | No ( = 5.68 kpc) | — | — |
| AA | Yes ( = 1.04 kpc) | No ( = 4 km/s) | No ( = -5 6 km/s) |
| AB | — | — | — |
| AC | Yes ( = 2.04 kpc) | No ( = 11 km/s) | No ( = -12 7 km/s) |
| AE | Yes ( = 3.58 kpc) | No ( = 16 km/s) | No = 6 km/s) |
| AF | No ( = 0.76 kpc) | — | — |
| AG | Yes ( = 1.42 kpc) | No ( = 10 km/s) | No ( = -6 6 km/s) |
| AH | No ( = 4.85 kpc) | — | — |
| AI1/HP-1 | No ( = 0.35 kpc) | — | — |
| AI2 | — | — | — |
| AJ | No ( = 5.35 kpc) | — | — |
| AK | — | — | — |
| AL | No ( = 2.61 kpc) | — | — |
| AM | No ( = 1.33 kpc) | — | — |
| AN | Yes ( = 1.65 kpc) | No ( = 24 km/s) | No ( = -7 3 km/s) |
8. Luminosities and models
There are significant differences in the predictions of the characteristics of the surviving companions of the supernova explosion. Podsiadlowski (2003) found that, for a subgiant companion, the object 400 years after the explosion might be either significantly overluminous or underluminous, relative to its pre-SN luminosity, depending on the amount of heating and the amount of mass stripped by the impact of the SN ejecta. More recently Shappee, Kochanek & Stanek (2013) have also followed the evolution of luminosity for years after the impact of the ejecta on a main–sequence the companion. The models first rise in temperature and luminosity, peaking at 104 L⊙ to start cooling and dimming down to 10 L⊙ some 104 yr after the explosion. Around 500 days after explosion the companion luminosity would be 103 L⊙. Pan, Ricker & Taam (2012, 2013, 2014) criticize the two preceding approaches for the arbitrary of the initial models. Starting from their hydrodynamic 3D models, they find lower luminosities for the companions than the previous authors. They find luminosities of the order of only 10 L⊙ for the companions, several hundred days after the explosion.
Now, knowing the distances from Gaia, we can derive the luminosities of the stars compatible with being inside the SNR. We take a distance to the SNR coming from the measurements from various reliable approaches, which means a value 1.7 d 3.7 kpc. We have 15 candidates compatible with that distance. We already had UBV photometry for some of them and now Gaia photometry for all. From that we find that there is no clearly overluminous candidate.
It has been suggested that, within the double–degenerate channel to produce SNe Ia, the explosion can be triggered just at the beginning of the coalescence process of the two WDs, by detonation of a thin helium layer coming from the surface of the less masive one. That would induce a second detonation in the core of the more massive WD. This hypotetical process has been dubbed as the “dynamically driven double–degenerate double–detonation scenario” (see Shen et al. 2018 and references therein). In this case, the less massive WD would survive the SN explosion and be ejected at the very high orbital velocity ( 1000 km s-1) it had at the moment of the explosion. Those would be seen as “hypervelocity WDs” (Shen et al. 2018). The number of hypervelocity WDs detectable by Gaia depends on the assumed luminosity of these objects. Shen et al. (2018) conclude that, taking into account tidal heating undergone by the WD before the explosion, a typical object would have, after subsequently cooling for 106 yr, a luminosity 0.1 , and thus be detectable by Gaia up to a distance of 1 kpc. Based on that, they predict that 30 potentially detectable hypervelocity WDs should be found within 1 kpc from the Sun. They have actually found, from Gaia DR2, three objects that, after having been followed up with ground–based telescopes, although not looking as typical WDs might be the result of heating and bloating of a SN Ia WD companion.
In the case of Tycho’s SN, the cooling time of a possible surviving WD companion is only 450 yr, and thus the luminosity should be significantly higher than the 0.1 adopted by Shen et al. (2018) for a typical companion having cooled for 106 yr.
In order to look for a possible hypervelocity WD companion to Tycho, we must considerably enlarge the search area around the center of the SNR. Taking as an upper limit a velocity perpendicular to the line of sight of 4000 km s-1, the maximum distance traveled in 450 yr, 5.7 km, translates, at a distance of the SNR, into an angular displacement of 2.1 arcmin (that is slightly more than 50% of the average radius of the SNR, which is about 4 arcmin).
We have checked that there is no object with unusually high proper motion in the Gaia DR2 data release, within the searched area and up to a –magnitude of 20.7 (V 22). For an extinction = 2.4 mag (GH09), and at the distance of Tycho, that means a luminosity , similar to the lower limit adopted by Shen et al. (2018). That does not take into account the capture of radioactive material by the companion WD predicted by Shen & Schwab (2017). Objects such as the three candidates to hypervelocity former SN Ia companions found by Shen et al. (2018), with G–magnitudes 17–18 mag, would be clearly seen.
9. Summary and conclusions
We have reexamined the distances and proper motions of the stars close to the center of Tycho’s SNR, using the data provided by the Gaia DR2. Previously, the distances were only know from determination of the stellar atmosphere parameters and comparison of the corresponding luminosities with the observed apparent magnitudes, with only an approximative knowledge of the extinction and uncertainty about the luminosity classes in a number of cases. More accurate were the proper motions, coming from astrometry made with the HST, but the DR2 has allowed a cross–check here. Besides, only a precise knowledge of the distances allows to convert proper motions into tangential velocities reliably.
Gaia now provides the last word about the distances and kinematics of the previously proposed companions of Tycho’s SN.
A good agreement between the distances from Gaia DR2 and those reported in B14 has been found in many cases, but with a general trend to shorter Gaia distances as compared with B14, which can be attributed to an underestimate of extinction in the direction of the remnant, in B14. In a few cases, however, the discrepancies are large.
Concerning proper motions, the agreement is very good once due account is made of the systematic effect of the motion of the local frame to which the HST measurements are referred with respect to Gaia’s absolute frame.
We find that, within the remaining uncertainties, up to 15 stars are at distances compatible with that of the SNR. The case for Tycho G is that in samples such as the one shown in Figure 3, this star has a thick disk kinematics, but has thin disk metallicity. There is only a 0.8% of star having similar characteristics. We have inspected the proper motions of all the stars visible up to limit of the Gaia DR2 in magnitude, and we have found no one with the same peculiar total velocity. We have presented a scenario in which Tycho G could be the companion of the SN 1572. There is, however, the possibility that after performing several orbits around the Galactic center, and encountering globular clusters and spiral arms, the star orbit becomes eccentric and migrates towards higher Galactic latitudes. This is a suggested explanation for the characteristics of Tycho G. A counterargument is why the other stars that could have performed as well several Galactic orbits, in close locations, would not have migrated.
We agree with Kerzendorf et al. (2018) that Tycho B is not a good candidate to companion of the explosion. We can also exclude, in view of the Gaia DR2 data, that star E could be a companion, since it lies very far away.
In case that Tycho G were not the companion star, the double–degenerate scenario or the core degenerate scenario are favored, since we have gone well below solar luminosities.
With Gaia DR2, we have also looked for the hypervelocities stars predicted by some scenarios, but within the magnitudes reached by Gaia we have found none.
10. Acknowledgements
This work has made use of data from the European Space Agency (ESA) mission Gaia (https://www.cosmos.esa.int/gaia), processed by the Gaia Data Processing and Analysis Consortium (DPAC, https//www.cosmos.esa.int/web/gaia/dpac/consortium). Funding for the DPAC has been provided by national institutions, in particular the institutions participating in the Gaia Multilateral Agreement. P.R.–L. is supported by AYA2015–67854–P from the Ministry of Industry, Science and Innovation of Spain and the FEDER funds. J.I.G.H. acknowledges financial support from the Spanish MINECO (Ministry of Economy of Spain) under the 2013 Ramón y Cajal program MINECO RyC–2013–14875, also from the MINECO AYA2014–56359–P and AYA2017-86389-P. This work was supported as well by the MINECO through grant ESP2016–80079–C2–1–R (MINECO/FEDER, UE) and ESP2014–55996—C2–1–R (MINECO/FEDER, UE) and MDM–2014–0369 of ICCUB (Unidad de Excelencia ’Maria de Maeztu).
References
- (1) Adibekyan, V.Zh., Sousa, S.G., Santos, N.C., et al. 2012, A&A, 545, A32
- (2) Allen, C., & Santillán, A. 1991, RMA&A, 22, 255
- (3) Bedin, L.R., Ruiz–Lapuente, P., González Hernández, J.I., Canal, R., Filippenko, A.V., & Méndez, J. 2014, MNRAS, 439, 354 (B14)
- (4) Brown, A. G. A et al. The Gaia collaboration. 2018, (arXiv: 1804.09365)
- (5) Eggleton, P.P., 1983, ApJ, 268, 368
- (6) Edwards, Z.I., Pagnotta, A., & Schaefer, B.E. 2012, ApJ, 747, L19
- (7) González Hernández, J.I., Ruiz–Lapuente, P., Filippenko, A.V., Foley, R.J., Gal–Yam, A., & Simon, J.D. 2009, ApJ, 691, 1 (GH09)
- (8) González Hernández, J.I., Ruiz–Lapuente, P., Tabernero, H.M., et al. 2012, Nature, 489, 533
- (9) Gustaffson, B., Bell, R.A., Eriksson, K., & Nordlund, Å. 1975, A&A, 42, 407
- (10) Jiang, J., Doi, M., Maeda, K., et al. 2017, Nature, 550, 801
- (11) Kerzendorf, W.E., Schmidt, B.P., Asplund, M., et al. 2009, ApJ, 701, 1665
- (12) Kerzendorf, W.E., Schmidt, B.P., Laird, J.B., Podsiadlowski, P., & Bessell, M.S. 2012, ApJ, 759, 7
- (13) Kerzendorf, W.E., Yong, D., Schmidt, B.P., et al. 2013, ApJ, 774, 99 (K13)
- (14) Kerzendorf, W., Childress, M., Scharwächter, J., Do, T., & Schmidt, B.P. 2014, ApJ, 782, 27
- (15) Kerzendorf, W.E., Strampelli, G., Shen, K.J., et al. 2018a, MNRAS, 479, 192
- (16) Kerzendorf, W.E., Long, K.S., Winkler, P.F., & Do, T. 2018b, MNRAS, 479, 5696
- (17) Kurucz, R.L. 1993, ATLAS9 Stellar Atmospheres Programs, Grids of Model Atmospheres and Line Data [CD-ROM] (Smithsonian Astrophysical Observatory, Cambridge, MA)
- (18) Lejeune, Th., Cuisinier, F., & Buser, R. 1997, A&ASS, 125, 229
- (19) Maoz, D., Mannucci, F., & Nelemans, G. 2014, ARA&A, 52, 107
- (20) Marietta, E., Burrows, A., & Fryxell, B. 2000, ApJS, 128, 615
- (21) Miret–Roig, N., Antoja, T., Romero–Gómez, M., & Figueras, F. 2018, preprint arXiv:1803.00573
- (22) Pagnotta, A., Walker, E., & Schaefer, B.E. 2014, ApJ, 788, 173
- (23) Pagnotta, A., & Schaefer, B.E. 2015, ApJ, 799, 101
- (24) Pan, K.–C., Ricker, P.M., & Taam, R.E. 2012a, ApJ, 750, 151
- (25) Pan, K.–C., Ricker, P.M., & Taam, R.E. 2012b, ApJ, 760, 21
- (26) Pan, K.–C., Ricker, P.M., & Taam, R.E. 2014, ApJ, 792, 71
- (27) Perlmutter, S., Aldering, G., Goldhaber, G., et al. 1999, ApJ, 517, 565
- (28) Podsiadlowski, P., Mazzali, P., Lessafre, P., Han, Zh., & Förster, F. 2008, New AR, 52, 381
- (29) Riess, A.G., Filippenko, A.V., Challis, P., et al. 1998, AJ, 116, 1009
- (30) Robin, A.C., Reylé, C., Derrière, S., et al. 2003, A&A, 409, 523
- (31) Ruiz–Lapuente, P. 1997, Science, 276, 1813
- (32) Ruiz–Lapuente, P. 2004, ApJ, 612, 357
- (33) Ruiz–Lapuente, P., Comerón, F., Méndez, J., et al. 2004, Nature, 431, 1069 (RL04)
- (34) Ruiz–Lapuente, P. 2014, New AR, 62, 15
- (35) Ruiz–Lapuente, P., Damiani, F., Bedin, L.R., et al. 2018, ApJ, 862, 124
- (36) Schaefer, B.E., & Pagnotta, A. 2012, Nature, 481, 164
- (37) Schönrich, R., Binney, J., & Dehnen, W. 2010, MNRAS, 403, 1829
- (38) Schmidt–Kaler, Th. 1982, in Landolt–Börnstein, New Ser. VI, Vol. 2b, ed. Hellwege, K.-H., 1 (Springer, Berlin)
- (39) Shappee, B.J., Kochanek, C.S., & Stanek, K.Z. 2013, ApJ, 765, 150
- (40) Shen, K.J., & Schwab, J. 2017, ApJ, 834, 180
- (41) Shen, K.J., Boubert, D., Gänsicke, B.T., et al. 2018, ApJ, 865, 15
- (42) Wang, B., & Han, Zh. 2012, New AR, 56, 122
- (43) Williams, B.J., Chomiuk, L., Hewitt, J.W., et al. 2016, ApJ, 823, L32
- (44) Xue, Zh., & Schaefer, B.E. 2015, ApJ, 809, 183