Chain Length Dispersity Effects on Mobility of Entangled Polymers
Abstract
While nearly all theoretical and computational studies of entangled polymer melts have focused on uniform samples, polymer synthesis routes always result in some dispersity, albeit narrow, of distribution of molecular weights ( 1.02-1.04). Here the effects of dispersity on chain mobility are studied for entangled, disperse melts using a coarse-grained model for polyethylene. Polymer melts with chain lengths set to follow a Schulz-Zimm distribution for the same average kg/mol with = to , were studied for times of s using molecular dynamics simulations. This time frame is longer than the time required to reach the diffusive regime. We find that dispersity in this range does not affect the entanglement time or tube diameter. However, while there is negligible difference in the average mobility of chains for the uniform distribution and , the shortest chains move significantly faster than the longest ones offering a constraint release pathway for the melts for larger .
The dynamics of macromolecules drive the unique viscoelastic properties that underline their strength and flexibility. Polymer chains consist of a large number of atoms that often exceeds , constituting entropic objects whose properties scale with their molecular weight. Variations in molecular weights, or the dispersity, have an immense effect on their phase behavior and dynamics and consequently affect numerous technologies, particularly those that incorporate entangled polymers with controlled elasticity.
The variability in molecular weights stems from inherent polymerization synthesis routes that yield dispersity in polymer chain length. This dispersity is a result of the statistical process that determines the polymerization path which is manifested in the differences of the number average molecular weight and the weight average molecular weight Rubinstein and Colby (2003). The degree of dispersity is defined as the ratio of Gilbert et al. (2009). Among the lowest dispersity polymers are those made by anionic and atom-transfer radical polymerization Matyjaszewski and Xia (2001); Chiefari et al. (1998), which exhibit relatively narrow distributions . The dispersity of these polymers is well captured by the Schulz-Zimm distribution Rubinstein and Colby (2003); Zimm (1948); Hiemenz and Lodge (2007). Seemingly a small number, this variability in chain lengths reflects a wide distribution of molecular weights where the ratio of the shortest to the longest chain length for the Schulz-Zimm distribution is three even for . This corresponds to a difference in relaxation times of 27 assuming a standard reptation exponent of 3.0, larger if one uses the experimentally observed value of 3.4. The effect of systematically varying on the dynamics of entangled melts is not easily accessible experimentally and remains an open question theoretically notwithstanding immense effort Graessley (1967); Graessley and Struglinski (1986); Schieber et al. (1986); Doi et al. (1987); Rubinstein and Colby (1988); Tsenoglou (1991); Milner (1996); Wang et al. (2003); Leonardi et al. (2000); Wagner et al. (2001); Cassagnau et al. (1993); Des Cloizeaux (1988). Most of these studies has focused on blending mixtures of two chain lengths. Here with the power of new computational tools, we address the effects of narrow distributions of within the framework anionic and atom-transfer radical polymerization on chain mobility in entangled melts. This fundamental aspect of polymer physics has not been thoroughly explored, and the understanding of the constraint release pathways in which dispersity affects polymer response remains an open question. Consistent with earlier dynamic theories and simulations Rubinstein and Colby (2003); Dorgan and Rorrer (2013); Des Cloizeaux (1988), our molecular dynamics (MD) simulations show that the presence of highly mobile short chains leads to constraint release for longer chains.
The significance of polymeric mechanical response has resulted in thorough efforts to resolve the effects of the dispersity of molecular weights on the flow of entangled melts. The flow characteristics are often captured in terms of the dependence of the viscosity on shear rate and linear viscoelastic response which are sensitive to chain dispersity. The effects become particularity significant for high molecular weights Struglinski and Graessley (1985); Wasserman and Graessley (1992). Dispersed melts have been treated theoretically by extending models of melts with uniform chain length Rubinstein and Colby (2003); Doi and Edwards (1988). These models focused on linear viscoelasticity of entangled polymer melts Graessley and Struglinski (1986); Schieber et al. (1986); Doi et al. (1987); Rubinstein and Colby (1988); Tsenoglou (1991); Milner (1996); Wang et al. (2003); Leonardi et al. (2000); Cassagnau et al. (1993).
These theories clearly demonstrate that the dynamics of linear chains in dispersed polymeric melts cannot be described by the classical reptation theory. Only models which explicitly consider the effects of the disperse surroundings of a chain through tube renewal can describe the dispersity effects on observed rheological response. While essentially all previous theoretical work on dispersed polymer melts have focused on linear viscoelastic response, few have discussed the effect of polymer dispersity on chain mobility that underlines the viscoelastic response Rubinstein and Colby (1988). Molecular dynamic simulations allow us to study dispersed entangled polymer melts, bridging the gap between average behavior captured by viscoelastic theories and chain mobility.
Numerical simulations are optimally positioned to study chain mobility in disperse melts. Previous numerical studies of disperse polymers melts have largely focused on binary blends Baschnagel et al. (1998); Masubuchi et al. (2008); Martínez-Veracoechea and Escobedo (2005); Barsky (2000); Picu and Rakshit (2007); Read et al. (2012); Barsky and Slater (1999). However, due to computational limitations, only the longer of the two chain lengths was well above the entanglement molecular weight . There have been few studies of polymer melts with a distribution of chains lengths, though mostly for short, unentangled polymers Harmandaris et al. (1998); Mavrantzas et al. (1999); Baschnagel et al. (1998); Pant and Theodorou (1995); Daoulas et al. (2003); Rorrer and Dorgan (2014a, b); Dorgan and Rorrer (2013); Rorrer and Dorgan (2014c); Li et al. (2016). Rorrer et al. Dorgan and Rorrer (2013); Rorrer and Dorgan (2014c, a, b) mapped a distribution of chain lengths on a small number of chain lengths and showed that for the same weight-averaged molecular weight, increasing the dispersity in chain lengths gives a lower Rouse time and introduces a broadening of the transition to reptation of the chains. Li et al. Li et al. (2016) have shown that even very large dispersity has little effect on the polymer glass transition.
With the significance of understanding the dispersity of polymers on chain mobility in entangles melts, this study has used polyethylene (PE), a well-studied macromolecule, as a model system. Computationally, coarse-grained (CG) models with 3-48 methylene groups per CG pseudo-atom Padding and Briels (2001, 2002); Fukunaga et al. (2002); Ashbaugh et al. (2005); Chen et al. (2006); Salerno et al. (2016a, b) have been developed, providing an essential tool to probe a sufficiently large melt that will allow the distinction of dispersity effects. Using a CG model for PE with four methylene groups per CG bead Salerno et al. (2016a, b); Peters et al. (2017), we examine chain mobility of disperse entangled polymer melts with dispersity in the range of the best synthetic routes and compare the results to a uniform polymer melt. This CG model was chosen since for more than 5 methylene groups per CG bead, one has to include extra beads or other constraints to avoid chains cutting through each other Padding and Briels (2001, 2002); Salerno et al. (2016a, b). The CG PE model used here has previously derived from fully atomistic simulations Salerno et al. (2016a, b). The nonbonded and bonded potentials were determined using an iterative Boltzmann inversion method. Additional details of the methodology can be found in Salerno et al. Salerno et al. (2016a, b). Melts with an average molecular weight kg/mol ( CG beads) for dispersity =1.0, 1.02, 1.04, 1.08, and 1.16 were studied. Using this CG models, we could reach times of order s. In comparison with earlier simulations of broader dispersity, we focus exclusively on low dispersity to understand its effects on chain mobility.
To model narrow molecular weight distributions in polymer melts synthesized by anionic and atom-transfer radical polymerization, the chain lengths were chosen to follow a Schulz-Zimm distribution Rubinstein and Colby (2003); Zimm (1948); Hiemenz and Lodge (2007),
| (1) |
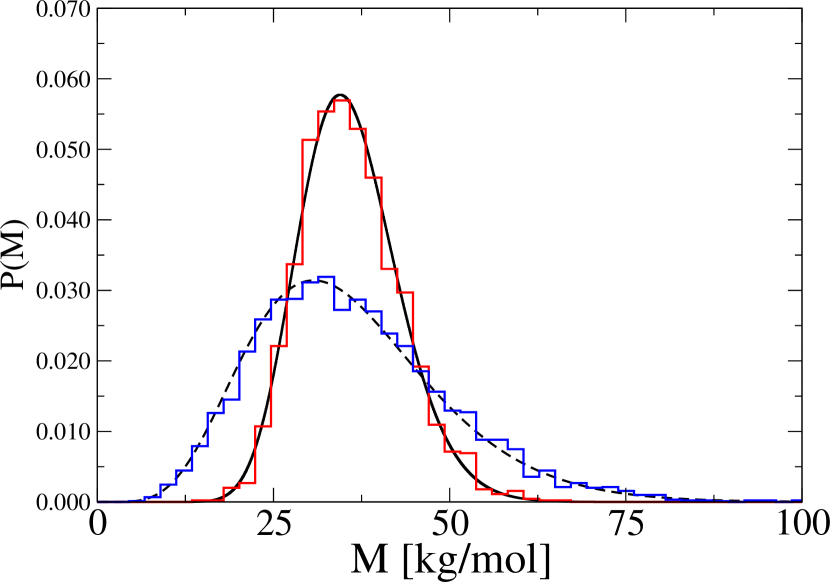
where Hiemenz and Lodge (2007). This distribution captures well the experimental observed molecular weight dispersity as resolved by chromatography Rubinstein and Colby (2003). All systems had the same weight-average molecular weight kg/mol. Experimentally the entanglement molecular weight - kg/mol Fetters et al. (1999a); Vega et al. (2004) or about 20 CG beads for PE. Here we use chains for and 4000 chains for to represent the Schulz-Zimm distribution, as shown in Figure 1. For , . For the largest dispersity , the shortest chain () is well entangled. Within these distributions, there are 398, 524, 671, and 940 unique chain lengths for = 1.02, 1.04, 1.08, and 1.16 respectively. Details of the systems studied here are listed in Table 1.
| [kg/mol] | [kg/mol] | [s] | D x [m2/s] | x [m2/s] | ||||
|---|---|---|---|---|---|---|---|---|
| 1.0 | 800 | 512000 | 35.8 | 35.8 | 1.0 | 790 | 1.15 | 1.15 |
| 1.02 | 2000 | 1251799 | 35.8 | 35.2 | 1.019 | 830 | 1.16 | 1.22 |
| 1.04 | 2000 | 1237358 | 35.6 | 34.4 | 1.036 | 800 | 1.23 | 1.29 |
| 1.08 | 2000 | 1176236 | 35.8 | 32.9 | 1.087 | 680 | 1.39 | 1.53 |
| 1.16 | 4000 | 2203172 | 36.0 | 30.8 | 1.169 | 600 | 1.77 | 2.04 |
The simulations were performed using the Large Atomic Molecular Massive Parallel Simulator (LAMMPS) molecular dynamics code Plimpton (1995). The melts were constructed following the procedure outlined in Auhl et al. Auhl et al. (2003) with periodic boundary conditions in all three directions. The simulation was performed at constant volume with the velocity-Verlet integrator and a Langevin thermostat with a damping constant of ps to maintain the temperature at K and a time step of fs. Coarse graining reduces the number of degrees of freedom in a system, creating a smoother free-energy landscape compared with fully atomistic simulations. This results in faster dynamics for the CG polymer chain than for the fully atomistic model Depa et al. (2011); Lyubimov and Guenza (2013); Harmandaris and Kremer (2009); Fritz et al. (2011). For the model used here with 4 methylene groups/CG bead, the dynamic scaling factor Salerno et al. (2016a, b); Peters et al. (2017) at K and at an experimentally relevant density, Fetters et al. (1999b). For all the results presented here, time is scaled by , and all five systems were run for - time steps. These run times are equivalent to - s and are listed in Table 1 for each system.
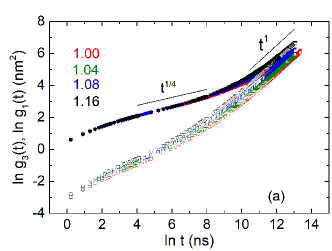
The mean-squared displacements (MSD) of the center of mass (cm) and the center four CG beads of the chain are shown in Figure 2a for four values of . The data shown in Figure 2a are averaged over all chains in the system. The two quantities allow the distinction of local motions at short times and macroscopic motion at long times. For long times, the average chain mobility increases and the terminal time , when the MSDs become diffusive, decreases as increases from to . As seen from the results for the weight averaged diffusion constant for listed in Table 1, increases by 50% over the range of studied. Results for a uniform melt () and the lowest dispersity are nearly indistinguishable. As seen from , the motion of the inner monomers at early times does not depend on , as all the chains, even for , are much longer than the entanglement length. From , we find that the crossover from the early Rouse relaxation regime to the reptation regime at which topological constraints set in, is at ns. Assuming that the distribution of segment displacement along the tube is Gaussian on the scale of the tube diameter Hou (2017), one can determine the entanglement time from = . This gives ns. The MSD of the center monomers at the crossover Hou (2017) gives a tube diameter nm. Fits to the tube model of the dynamic structure function from neutron spin-echo experiments by Richter et al. Richter et al. (1992) and Schleger et al. Schleger et al. (1998) for PE of the same at K give ns and nm.
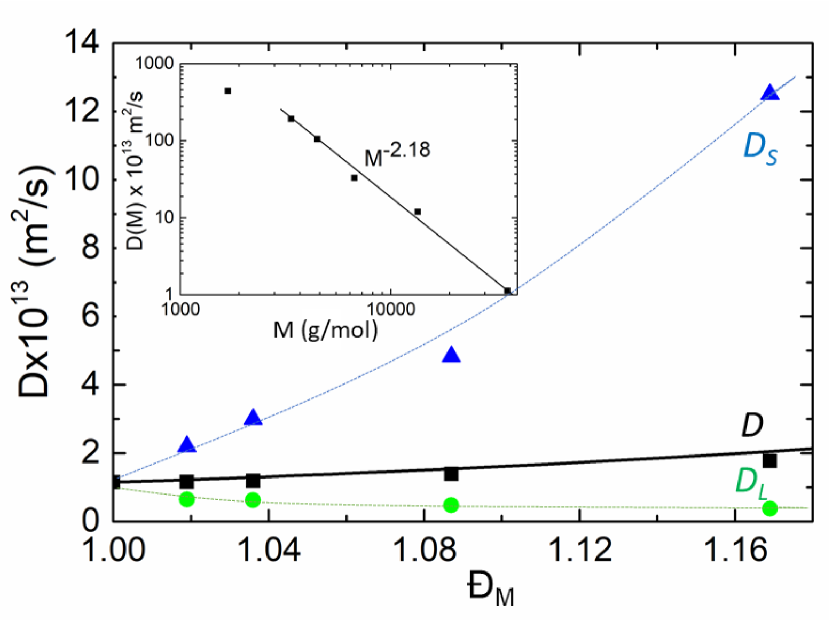
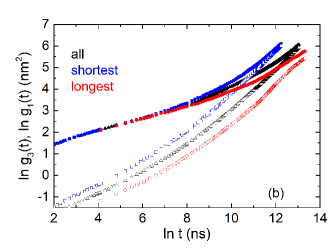
The effect of the dispersity is captured through measurements of the mobility of the shortest and longest chains in each melt. Figure 2b presents results for the MSD of the shortest and longest of the chains compared to the average MSD for all chains for . While there is little difference in the motion of the center beads of the chain at early times, at later times the mobility of the beads for the shortest of the chains deviate more from the mean than do the longest of the chains. For , for the shortest of the chains kg/mol while kg/mol for the longest , compared to the number average molecular weight of the system kg/mol. The diffusion constants directly extracted from the simulations are presented in Figure 3, averaged over all chains , the shortest and longest . These results show that the shorter chains move significantly faster than the average and as the dispersity increases, deviates considerably more from than does . For comparison, for , x m2/s for a uniform melt of chains with kg/mol is larger than x m2/s, whereas x m2/s for a uniform melt of chains with kg/mol is 13 smaller than x m2/s. These results for are obtained from simulations for uniform systems presented in the inset of Figure 3 Grest et al. (2018). The ratio of for a uniform melt of the same as the shortest chains and increases as increases whereas the ratio between for a uniform melt of long chains and does not. For , , while , where kg/mol is molecular weight of the shortest of the chains and kg/mol is the molecular weight for the longest of the chains for . We also measured the static structure factor for the entire melt and for the shortest and longest of the chains. These measurements show no evidence of phase separation of the chains for all studied. The divergence of the motion of the shortest and longest chains suggest that the short chain enable a constraint release mechanism for the dynamics Doi and Edwards (1988); Rubinstein and Colby (2003), which is the disentanglement of a chain due to other polymers reptating away.
The diffusion constant of the disperse melts is estimated from the diffusion constant of uniform melts by incorporating the distribution of the chains using
| (2) |
From a series of simulations of uniform polymer melts for kg/mol kg/mol, shown in inset of Figure 3, we find that for large , is well described by a power law , where x m2/s and kg/mol Grest et al. (2018). The decay of with a power law exponent greater than 2 for large is consistent with experimental results Lodge (1999). Using this power law for and the Schulz-Zimm distribution (eq. 1) for , we estimate using eq. 2. As seen from the inset in Figure 3 and Table 1, for all . For small , gives a very good estimate of the measured diffusion constant as the center of the distribution dominates. However as increases, the two begin to diverge as the local environment that a chain in uniform melt begins to deviate from that in the dispersed melt.
This study probed directly the mobility of dispersed entangled polymer melts with distribution as narrow as experimentally attainable for long entangled polymers. Overall the average mobility of the chains increases as the dispersity increases. We observe that though the average mobility is hardly affected within this dispersity range, the mobility of the shortest and longest chains deviates considerably from the average. The increase diffusion of the shorter chains results in constraint release for the longer chains, leading to faster motion of the longer chains in the dispersed melt than in a uniform melt. This large variation in mobility of chains within entangled melts offers a means to tune the viscoelasticity of these melts by manipulating chain mobility through dispersity. One would expect that the frequency dependence rheological response of the viscosity will be strongly affected by the fact that the shortest and longest changes move at significantly faster and slower rates compare with a uniform system. Studies of this effect are currently on the way.
KMS was supported in part by the National Research Council Associateship Program at the US Naval Research Laboratory. DP kindly acknowledged NSF DMR 1611136 for partial support. This work was supported by the Sandia Laboratory Directed Research and Development Program. This work was performed, in part, at the Center for Integrated Nanotechnologies, an Office of Science User Facility operated for the U.S. Department of Energy (DOE) Office of Science. Sandia National Laboratories is a multi-mission laboratory managed and operated by National Technology and Engineering Solutions of Sandia, LLC, a wholly owned subsidiary of Honeywell International, Inc., for the U.S. Department of Energy’s National Nuclear Security Administration under Contract DE-NA-0003525.
References
- Rubinstein and Colby (2003) M. Rubinstein and R. H. Colby, Polymer Physics (Oxford University Press, New York, 2003).
- Gilbert et al. (2009) R. Gilbert, M. Hess, A. Jenkins, R. Jones, P. Kratochvil, and R. Stepto, Pure App. Chem. 81, 351 (2009).
- Matyjaszewski and Xia (2001) K. Matyjaszewski and J. Xia, Chem. Rev. 101, 2921 (2001).
- Chiefari et al. (1998) J. Chiefari, Y. Chong, F. Ercole, J. Krstina, J. Jeffery, T. P. Le, R. T. Mayadunne, G. F. Meijs, C. L. Moad, G. Moad, et al., Macromolecules 31, 5559 (1998).
- Zimm (1948) B. H. Zimm, J. Chem. Phys. 16, 1093 (1948).
- Hiemenz and Lodge (2007) P. C. Hiemenz and T. P. Lodge, Polymer Chemistry (CRC Press, 2007).
- Graessley (1967) W. W. Graessley, J. of Chem. Phys. 47, 1942 (1967).
- Graessley and Struglinski (1986) W. W. Graessley and M. J. Struglinski, Macromolecules 19, 1754 (1986).
- Schieber et al. (1986) J. D. Schieber, C. F. Curtiss, and R. B. Bird, Ind. Eng. Chem. Fund. 25, 471 (1986).
- Doi et al. (1987) M. Doi, W. Graessley, E. Helfand, and D. Pearson, Macromolecules 20, 1900 (1987).
- Rubinstein and Colby (1988) M. Rubinstein and R. H. Colby, J. Chem. Phys. 89, 5291 (1988).
- Tsenoglou (1991) C. Tsenoglou, Macromolecules 24, 1762 (1991).
- Milner (1996) S. T. Milner, J. Rheo. 40, 303 (1996).
- Wang et al. (2003) S. Wang, S.-Q. Wang, A. Halasa, and W.-L. Hsu, Macromolecules 36, 5355 (2003).
- Leonardi et al. (2000) F. Leonardi, J.-C. Majeste, A. Allal, and G. Marin, J. Rheo. 44, 675 (2000).
- Wagner et al. (2001) M. Wagner, P. Rubio, and H. Bastian, J. Rheo 45, 1387 (2001).
- Cassagnau et al. (1993) P. Cassagnau, J. Montfort, G. Marin, and P. Monge, Rheo. Acta 32, 156 (1993).
- Des Cloizeaux (1988) J. Des Cloizeaux, EPL(Europhys. Lett.) 5, 437 (1988).
- Dorgan and Rorrer (2013) J. R. Dorgan and N. A. Rorrer, Phys. Rev. Lett. 110, 176001 (2013).
- Struglinski and Graessley (1985) M. J. Struglinski and W. W. Graessley, Macromolecules 18, 2630 (1985).
- Wasserman and Graessley (1992) S. Wasserman and W. Graessley, J. Rheo. 36, 543 (1992).
- Doi and Edwards (1988) M. Doi and S. F. Edwards, The Theory of Polymer Dynamics (Clarendon Press, Oxford, 1988).
- Baschnagel et al. (1998) J. Baschnagel, W. Paul, V. Tries, and K. Binder, Macromolecules 31, 3856 (1998).
- Masubuchi et al. (2008) Y. Masubuchi, H. Watanabe, G. Ianniruberto, F. Greco, and G. Marrucci, Macromolecules 41, 8275 (2008).
- Martínez-Veracoechea and Escobedo (2005) F. J. Martínez-Veracoechea and F. A. Escobedo, Macromolecules 38, 8522 (2005).
- Barsky (2000) S. Barsky, J. Chem. Phys. 112, 3450 (2000).
- Picu and Rakshit (2007) R. Picu and A. Rakshit, J. Chem. Phys. 127, 144909 (2007).
- Read et al. (2012) D. Read, K. Jagannathan, S. Sukumaran, and D. Auhl, J. Rheo. 56, 823 (2012).
- Barsky and Slater (1999) S. Barsky and G. W. Slater, Macromolecules 32, 6348 (1999).
- Harmandaris et al. (1998) V. A. Harmandaris, V. G. Mavrantzas, and D. N. Theodorou, Macromolecules 31, 7934 (1998).
- Mavrantzas et al. (1999) V. G. Mavrantzas, T. D. Boone, E. Zervopoulou, and D. N. Theodorou, Macromolecules 32, 5072 (1999).
- Pant and Theodorou (1995) P. K. Pant and D. N. Theodorou, Macromolecules 28, 7224 (1995).
- Daoulas et al. (2003) K. C. Daoulas, A. F. Terzis, and V. G. Mavrantzas, Macromolecules 36, 6674 (2003).
- Rorrer and Dorgan (2014a) N. A. Rorrer and J. R. Dorgan, J. Chem. Phys. 141, 214905 (2014a).
- Rorrer and Dorgan (2014b) N. A. Rorrer and J. R. Dorgan, Macromolecules 47, 3185 (2014b).
- Rorrer and Dorgan (2014c) N. A. Rorrer and J. R. Dorgan, Phys. Rev. E 90, 052603 (2014c).
- Li et al. (2016) S.-J. Li, S.-J. Xie, Y.-C. Li, H.-J. Qian, and Z.-Y. Lu, Phys. Rev. E 93, 012613 (2016).
- Padding and Briels (2001) J. T. Padding and W. J. Briels, J. Chem. Phys. 115, 2846 (2001).
- Padding and Briels (2002) J. T. Padding and W. J. Briels, J. Chem. Phys. 117, 925 (2002).
- Fukunaga et al. (2002) H. Fukunaga, J.-i. Takimoto, and M. Doi, J. Chem. Phys. 116, 8183 (2002).
- Ashbaugh et al. (2005) H. S. Ashbaugh, H. A. Patel, S. K. Kumar, and S. Garde, J. Chem. Phys. 122, 104908 (2005).
- Chen et al. (2006) L.-J. Chen, H.-J. Qian, Z.-Y. Lu, Z.-S. Li, and C.-C. Sun, J. Phys. Chem. B 110, 24093 (2006).
- Salerno et al. (2016a) K. M. Salerno, A. Agrawal, D. Perahia, and G. S. Grest, Phys. Rev. Lett. 116, 058302 (2016a).
- Salerno et al. (2016b) K. M. Salerno, A. Agrawal, B. L. Peters, D. Perahia, and G. S. Grest, Euro. Phys. J. Spec. Topics 225, 1707 (2016b).
- Peters et al. (2017) B. L. Peters, K. M. Salerno, A. Agrawal, D. Perahia, and G. S. Grest, J. Chem. Theory Comp. 13, 2890 (2017).
- Fetters et al. (1999a) L. J. Fetters, D. J. Lohse, S. T. Milner, and W. W. Graessley, Macromolecules 32, 6847 (1999a).
- Vega et al. (2004) J. F. Vega, S. Rastogi, G. W. M. Peters, and H. E. H. Meijer, J. Rheo. 48, 663 (2004).
- Plimpton (1995) S. Plimpton, J. Comput. Phys. 117, 1 (1995).
- Auhl et al. (2003) R. Auhl, R. Everaers, G. S. Grest, K. Kremer, and S. J. Plimpton, J. Chem. Phys. 119, 12718 (2003).
- Depa et al. (2011) P. Depa, C. Chen, and J. K. Maranas, J. Chem. Phys. 134, 014903 (2011).
- Lyubimov and Guenza (2013) I. Y. Lyubimov and M. G. Guenza, J. Chem. Phys. 138, 12A546 (2013).
- Harmandaris and Kremer (2009) V. A. Harmandaris and K. Kremer, Macromolecules 42, 791 (2009).
- Fritz et al. (2011) D. Fritz, K. Koschke, V. A. Harmandaris, N. F. A. van der Vegt, and K. Kremer, Phys. Chem. Chem. Phys. 13, 10412 (2011).
- Fetters et al. (1999b) L. J. Fetters, D. J. Lohse, and W. W. Graessley, J. Polym. Sci. Pol. Phys. 37 (1999b).
- Hou (2017) J.-X. Hou, J. Chem. Phys. 146, 026101 (2017).
- Richter et al. (1992) D. Richter, R. Butera, L. Fetters, J. Huang, B. Farago, and B. Ewen, Macromolecules 25, 6156 (1992).
- Schleger et al. (1998) P. Schleger, B. Farago, C. Lartigue, A. Kollmar, and D. Richter, Phys. Rev. Lett. 81, 124 (1998).
- Grest et al. (2018) G. S. Grest, K. M. Salerno, B. L. Peters, T. Ge, and D. Perahia, Handbook of Materials Modeling. 1 Methods: Theory and Modeling , in press (2018).
- Lodge (1999) T. P. Lodge, Phys. Rev. Lett. 83, 3218 (1999).