What Does “Metallicity” Mean When Interpreting Spectra of Exoplanetary Atmospheres?
1
One of the desired outcomes of studying exoplanetary atmospheres is to set decisive constraints on exoplanet formation theories (e.g., Madhusudhan et al. 2014). Specifically, astronomers often speak of the “metallicity” in broad terms. When modeling the bulk metallicity, workers refer to the elemental iron abundance (Fe/H). For example, Miller & Fortney (2011) and Thorngren et al. (2016) set constraints on the bulk metallicity of non-inflated gas-giant exoplanets by matching predictions from evolutionary models with the measured masses and radii. By contrast, when exo-atmospheric astronomers speak of the “metallicity” derived from analysing low-resolution Hubble and Spitzer spectrophotometry, they are referring to the elemental abundances of oxygen (O/H), carbon (C/H) and nitrogen (N/H)—in decreasing order of importance, since spectra from the Hubble Wide Field Camera 3 (WFC3) are primarily sensitive to water (H2O) with secondary contributions from hydrogen cyanide (HCN) and ammonia (NH3), while Spitzer photometry is sensitive to methane (CH4) and carbon monoxide (CO). From retrieving for the water abundances, workers such as Kreidberg et al. (2014), Wakeford et al. (2017, 2018), Arcangeli et al. (2018) and Mansfield et al. (2018) have published figures that show the “metallicity” (in units of “solar”) versus the masses of the exoplanets with entries from the Solar System ice and gas giants overplotted. (Nikolov et al. 2018 published a similar figure using retrieved sodium abundances.) Even if we assume that bulk and atmospheric elemental abundances are equal, the motivation behind this research note is to demonstrate that the conversion between the water abundance and O/H is not straightforward.
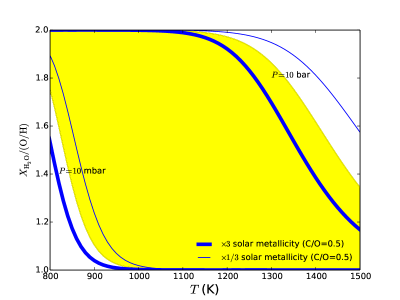
To demonstrate this claim, I use a simple and highly reproducible set of models that include only carbon (C), hydrogen (H) and oxygen (O). I further assume H2-dominated atmospheres, chemical equilibrium and pure-gas chemistry with the reasoning that the presence of nitrogen, photochemistry, atmospheric mixing and condensation will complicate the issue and not alleviate it. The water volume mixing ratio (relative abundance by number) is thus the number density of water divided by the number density of H2 (and not H). The analytical models are taken from Heng & Lyons (2016); their accuracy has been validated by comparison to numerical calculations using the Gibbs free energy minimisation method (Heng & Tsai, 2016). To mimic the effects of vertical atmospheric mixing, I assume a range of pressures ranging from 10 mbar to 10 bar. This is akin to water at chemical equilibrium being mixed up from deeper regions of the atmosphere, a phenomenon known as “quenching” (e.g., Tsai et al. 2017). Once mixed up to higher altitudes (lower pressures), the assumption is that the dynamical timescale is much shorter than the chemical timescale, which allows the water abundance to be frozen at its quenched value.
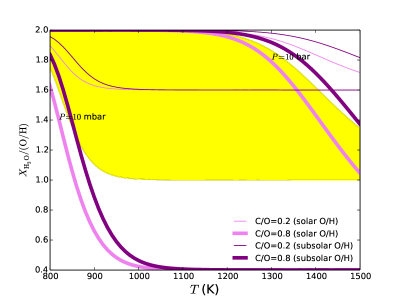
It remains unclear what the “metallicity” means in broad terms; I will work specifically with C/H and O/H. By “solar metallicity”, I mean that and (such that “solar C/O” is 0.5). Even with these definitions, Figure 1 shows that “water at solar metallicity” is a temperature- and pressure-dependent statement, because there is no single value of the water volume mixing ratio corresponding to and . By “ solar metallicity” and “ solar metallicity”, I mean that O/H and C/H are scaled up or down by the same factor of 3. I also consider subsolar O/H (reduced by a factor of 3 from its solar value for illustration) to mimic the effect of oxygen being sequestered in refractory molecules such as enstatite (Woitke et al., 2018). Overall, Figure 1 demonstrates that the conversion factor between the water volume mixing ratio and O/H is not unity and depends on temperature, pressure, O/H, C/H and C/O, even without invoking disequilibrium chemistry (photochemistry and/or atmospheric mixing). The conversion factor is a factor of several. It remains unproven that disequilibrium chemistry or condensation will always return a conversion factor of unity. It is thus a fair statement to say that the “metallicity” estimates inferred from atmospheric retrievals are model-dependent.
References
- Arcangeli et al. (2018) Arcangeli, J., Désert, J.-M., Line, M.R., et al. 2018, ApJL, 855, L30
- Heng & Lyons (2016) Heng, K., & Lyons, J.R. 2016, ApJ, 817, 149
- Heng & Tsai (2016) Heng, K., & Tsai, S.-M. 2016, ApJ, 829, 104
- Kreidberg et al. (2014) Kreidberg, L., Bean, J.L., Désert, J.-M., et al. 2014, ApJL, 793, L27
- Madhusudhan et al. (2014) Madhusudhan, N., Amin, M.A., & Kennedy, G.M. 2014, ApJL, 794, L12
- Mansfield et al. (2018) Mansfield, M., Bean, J.L., Line, M.R., et al. 2018, AJ, 156, 10
- Miller & Fortney (2011) Miller, N., & Fortney, J.J. 2011, ApJL, 736, L29
- Nikolov et al. (2018) Nikolov, N., Sing, D.K., Fortney, J.J., et al. 2018, Nature, 557, 526
- Thorngren et al. (2016) Thorngren, D.P., Fortney, J.J., Murray-Clay, R.A., & Lopez, E.D. 2016, ApJ, 831, 64
- Tsai et al. (2017) Tsai, S.-M., Lyons, J.R., Grosheintz, L., et al. 2017, ApJS, 228, 20
- Wakeford et al. (2017) Wakeford, H.R., Sing, D.K., Kataria, T., et al. 2017, Science, 356, 628
- Wakeford et al. (2018) Wakeford, H.R., Sing, D.K., Deming, D., et al. 2018, AJ, 155, 29
- Woitke et al. (2018) Woitke, P., Helling, Ch., Hunter, G.H., et al. 2018, A&A, 614, A1