VLBI radio structure and radio brightening of the high-energy neutrino emitting blazar TXS 0506+056
Abstract
We report on the radio brightening of the blazar TXS 0506+056 (at ), supporting its identification as source of the high-energy (HE) neutrino IC-170922A by the IceCube Neutrino Observatory. MOJAVE/VLBA data indicate its radio brightness abruptly increasing since January 2016. When decomposing the total radio flux density curve (January 2008 - July 2018) provided by the Owens Valley Radio Observatory into eight Gaussian flares, the peak time of the largest flare overlaps with the HE neutrino detection, while the total flux density exhibits a threefold increase since January 2016. We reveal the radio structure of TXS 0506+056 by analysing VLBI data from the MOJAVE/VLBA Survey. The jet-components maintain quasi-stationary core separations. The structure of the ridge line is indicative of a jet curve at the region mas ( pc projected) from the VLBI core. The brightness temperature of the core and the pc-scale radio morphology support a helical jet structure at small inclination angle (). The jet pointing towards the Earth is key property facilitating multimessenger observations (HE neutrinos, - and radio flares). The radio brightening preceding the detection of a HE neutrino is similar to the one reported for the blazar PKS 0723–008 and IceCube event ID5.
keywords:
galaxies: BL Lacertae objects: individual: TXS 0506+056 – physical data and processes: neutrinos –radio continuum: galaxies – techniques: interferometric1 Introduction
| F1 | F2 | F3 | F4 | F5 | F6 | F7 | f8 | |
|---|---|---|---|---|---|---|---|---|
| (Jy) | ||||||||
| (yr) | ||||||||
| (yr) |
| Epoch | VLBA Code | rms | |||
| (mas) | (mas) | (∘) | (mJy bm-1) | ||
| (1) | (2) | (3) | (4) | (5) | (6) |
| 2009-01-07 | BL149 | 1.396 | 0.635 | -3.9 | 0.153 |
| 2009-06-03 | BL149 | 1.341 | 0.584 | -6.9 | 0.182 |
| 2010-07-12 | BL149CL | 1.385 | 0.509 | -8.5 | 0.175 |
| 2010-11-13 | BL149CW | 1.369 | 0.576 | -9.1 | 0.148 |
| 2011-02-27 | BL149DC | 1.175 | 0.536 | -0.8 | 0.210 |
With the discovery of the cosmic high-energy (HE) neutrinos, extensive studies targeted their sources. Active galactic nuclei (AGN), driven by supermassive black holes (SMBHs), are prominent candidates, able to produce the dominant isotropic neutrino background between GeV (Stecker et al., 1991).
Blazars, a subclass of AGN Urry1995, are characterized by a relativistic jet at small inclination angle, appearing much brighter than they would be intrinsically due to relativistic boosting and beaming of their electromagnetic radiation. They are highly variable sources, many of them radiating from radio frequencies to the -ray regime. Very long baseline interferometry (VLBI) observations exposed outward moving bright spots of the surface brightness distribution in a number of jets, that propagate with apparently superluminal speeds (e.g. Vermeulen & Cohen, 1994; Lister et al., 2016). Such superluminal motion arises from projection effects.
A major -outburst of the blazar PKS B1424–418 has been reported by Kadler et al. (2016), found to occur in temporal and positional coincidence with a PeV-energy shower-type neutrino event (ID35) with average median angular error , observed by the IceCube Neutrino Observatory.
Cross-correlating available radio catalogues with the arrival direction of the track-type neutrinos detected by the IceCube (Aartsen et al., 2014; IceCube Collaboration et al., 2015; Schoenen & Raedel, 2015), we identified the blazar PKS 0723-008 as the source of the HE neutrino event ID5 (Kun, Biermann & Gergely, 2017). The positional identification was much stronger as for track-type events the median angular error of the parent neutrino is . Along with this blazar, three other candidates were found (the corresponding HE neutrino events are given in brackets; Kun, Biermann & Gergely, 2017): the BL Lac object PKS B1206–202 (, ID8), the quasar PKS B2300–254 (, ID18), the quasar PKS B2224+006 (4C+00.81; , ID44).
Recently the IceCube Collaboration et al. (2018) reported on the multimessenger observations of TXS 0506+056 (, Paiano et al., 2018). The HE neutrino event IceCube-170922A detected at 22/9/2018 was in temporal and positional coincidence with a prominent -ray flare. The deposited energy was TeV in a track-type event. Padovani et al. (2018) investigated multiband archival monitoring data of TXS0506+056 from radio to -rays (for mid-infrared archival data see Gabányi, Moór & Frey, 2018) and suggested the source underwent a hadronic flare with HE neutrino emission. Knowing the position of TXS 0506+056 as prior, the IceCube Collaboration (2018) also identified an excess of HE neutrinos from the direction of this AGN between September 2014 and March 2015.
Our aim was to investigate the radio characteristics of the jet of TXS 0506+056 by employing archival VLBI data and considering the full Owens Valley Radio Observatory (OVRO) flux density curve, that starts at 8/1/2008 and ends at 24/7/2018. For VLBI analysis we explored the radio interferometric data produced by the ”Monitoring Of Jets in Active galactic nuclei with VLBA Experiments” (MOJAVE) survey (Lister et al., 2009).
| Epoch | (mas) | (mas) | CO | ||
|---|---|---|---|---|---|
| (yr) | (Jy) | (mas) | (deg) | (mas) | |
| (1) | (2) | (3) | (4) | (5) | (6) |
| 2009.02 | cr | ||||
| C1 | |||||
| C2 | |||||
| C3 | |||||
| C4 |
2 Radio flux density variations of TXS 0506+056
The MOJAVE programme (Lister et al., 2009, 2013, 2016) provides archival calibrated data of TXS 0506+056 at 15 GHz, that were obtained for 16 epochs between and . The measurements were performed with the Very Long Baseline Array (VLBA) interferometer. It consists of radio telescopes each having a diameter of m. The array employs the VLBI technique, reaching a resolution better than milliarcsecs (mas) at GHz.
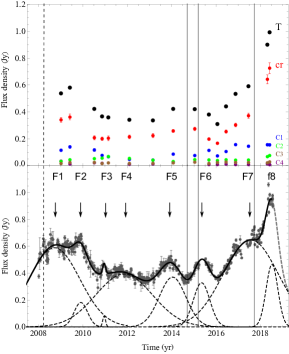
We plotted the total flux density of TXS 0506+056 from MOJAVE/VLBA data in the upper panel of Fig. 1. VLBI data indicate the radio brightness of the source is increasing since January 2016. We show the total flux density curve of TXS 0506+056 observed with the OVRO -m single dish radio telescope at GHz in the lower panel of Fig. 1. The figure suggests a close correspondence between the OVRO and the VLBA flux density curves, indicating that the source is highly core dominated at GHz, with minimal kpc-scale radio emission. Minimizing the , we decomposed it into Gaussian flares following the procedure discussed in Pyatunina et al. (2006) and Pyatunina et al. (2006) (see other examples of the Gaussian decomposition of flux density curves e.g. in Britzen et al., 2010; Kudryavtseva et al., 2011). The amplitude (), time of the peak-flux density () and full width at half maximum (FWHM, ) duration of the individual the individual flares are summarized in Table LABEL:table:flarefit.
The two largest flares ( Jy) peaked at (F1) and (F7), respectively. Moderately large flares peaked (0.3 Jy 0.5 Jy) at (F4), (F5), (F6), respectively. The two smallest flares peaked at (F2), (F3) respectively. Though we fitted flare f8 with a Gaussian, this flare might be still in its brightening phase therefore its indicated peak time should be considered with caution.
The IceCube Collaboration reported on the identification of an excess of cosmic neutrinos in the position of TXS 0506+056 between September 2014 and March 2015 (IceCube Collaboration, 2018), overlapping with radio flare F6. The radio emission of TXS 0506+056 started to increase after the HE neutrino-excess, in the beginning of 2016, and produced a 3-fold increase in flux density until the most recent OVRO observations. The peak time of flare F7, which has the largest amplitude of the fully sampled flares overlaps with the detection time of the HE neutrino event IceCube-170922A (Fig. 1).
3 VLBI radio structure of the jet

3.1 Analysis of archival MOJAVE/VLBA observations
We used standard Difmap tasks (Shepherd, Pearson & Taylor, 1994) to model-fit the VLBI data, such that circular Gaussian components were employed to build up the surface brightness distribution of the jet. Table LABEL:table_impars shows the the summary of the image parameters. We identified four components, C, C, C, C, in a region extending up to mas in projection from the core ( pc, using the cosmological parameters from Planck Collaboration et al., 2016). Component C1 (C4) has the smallest (largest) average distance to the VLBI core. The total flux density, sky position and width of the jet components are available in electronic format on-line, along with their observing epochs. The error of these parameters were estimated as in Kun et al. (2014).
3.2 Structural evolution and orientation of the VLBI jet
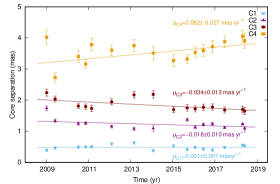
We plotted the core separation of the jet components against their observing epochs with the best-fit slopes of their linear proper motion in Fig. 2. Components C1 and C2 reside quasi-stationary across the observations. C3 showed some inward-directed, while C4 showed some outward-directed motion. The confidence level for the fits are (C1), (C2), (C3), (C4). They might have oscillatory motion, similar to that of the jet of S5 1803+784 (Britzen et al., 2010; Kun et al., 2018). This is reflected by the bad fit of the linear proper motion–model to the data. We note that in case of TXS 0506+056 more observation are needed to see how the component behave in a longer time-span.
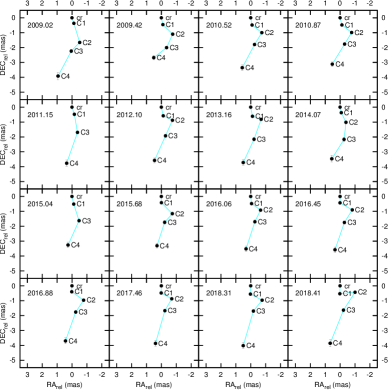
We plotted the right ascension () and declination () of the brightness peak of the jet components relative to the position of the VLBI core in Fig. 4. The average and standard deviation of the FWHM major and minor axis of the restoring beam is () mas and () mas, respectively. A jet curve appears in the region roughly between – mas (– pc) from the core, indicating helical jet ridge line, such that the jet components reside quasi-stationary.
Due to Doppler boosting, the apparent brightness temperature can exceed than the limiting intrinsic brightness temperature . The Doppler factor connects them as . The brightness temperature can be given in case of VLBI components as (e.g. Condon et al., 1982):
| (1) |
where is the flux density (in Jy), is the FWHM diameter of the component (in mas), is the observing frequency (in GHz) and is the red-shift of the source. We estimated the apparent core-brightness temperature from the total flux density and diameter of the respective Gaussian component at each of the epochs of MOJAVE data. We plotted the VLBI brightness temperature of the core in Fig. 3. The core VLBI brightness temperature was low during the HE neutrino excess observed between September 2014 and March 2015 and it was the highest nearly at the time of the peak flux density of the largest flare (F7), when HE neutrino IC170922A was also detected. Equating the intrinsic brightness temperature with the equipartition brightness temperature K (Readhead, 1994), we obtained for the core.
The lower limit on Doppler factor of the core limits the Lorentz factor as , resulting in characteristic jet speed larger than , and limits the inclination angle as , resulting in smaller than . The smaller (larger) value of the intrinsic temperature would yield larger(smaller) limit on the jet speed and smaller (larger) limit on the inclination angle .
The small inclination angle of the jet and the lack of obvious globally outward-directed motion of all of the jet components suggest they can be identified as ”lantern-regions”, highly Doppler-boosted parts of the jet. Two of the present authors and their collaborators explained the apparent brightness variations leading to the appearance of lantern regions as caused by variable inclination along a helical ridge line Kun et al. (2018). This was based on a model of the intrinsic ridge line (Steffen et al., 1995) relying on conservation laws for kinetic energy, momentum and jet opening angle. The quasi-stationary feature of the components of S5 1803+784 has been explained as follows: the plasma reaches the respective Doppler-boosted regions, then moves out, fading below the sensitivity of the interferometer.
4 Discussion and summary
In our earlier work (Kun, Biermann & Gergely, 2017), we have searched for the source of the track-type HE neutrinos detected by the Antarctic IceCube Neutrino Observatory (Aartsen et al., 2014; IceCube Collaboration et al., 2015; Schoenen & Raedel, 2015; IceCube Collaboration et al., 2018). For track-type events induced by a muon neutrino, the median angular error is . We remarked that binary SMBH evolution qualitatively explains the observed HE neutrino emission through the following sequence of events: (1) the dominant black hole spin-flips (presumably million years before the actual merger, Gergely & Biermann, 2009), (2) a new jet-channel plows through the surrounding material capturing seed particles, also feeding from the accretion disk, (3) the dominant jet accelerates ultrahigh-energy cosmic ray particles (UHECRs), and the most energetic proton collisions generate pions that decay further, producing neutrinos, (4) the SMBH merger occurs with accompanying emission of low-frequency gravitational waves.
The dominant jet reoriented after the spin-flip is responsible for the observable consequences of the merger: (i) increased radiation in all EM frequencies due to the high Lorentz factor of the freshly made jet, (ii) flat spectrum up to THz frequencies due to the energetic synchrotron-radiating electrons (see the Fermi LAT spectrum in IceCube Collaboration et al., 2018), (iii) increasing radio flux density due to enhanced synchrotron radiation (this Letter), (iv) emission of HE particles (neutrinos, UHECRs, -rays; IceCube Collaboration et al., 2018). The identification of the neutrino sources is enhanced by the strong Doppler boosting of the jet, therefore the flat-spectrum emission is a key selection criterion to find source candidates.
Considering the object of study of the present paper, the blazar TXS 0506+056, the post-merger SMBH binary scenario provides a consistent physical picture explaining the already occurred multimessenger observations (radio and flaring, HE neutrinos). In particular, the coincident radio brightening (OVRO) and HE neutrino detection is similar to the one reported for the blazar PKS 0723-008 and IceCube event ID5 (Kun, Biermann & Gergely, 2017).
Decomposing the total flux density of TXS 0506+056 observed with the OVRO 40-m single dish radio telescope at 15 GHz into 8 Gaussian flares, the peak flux density of the largest flare (F7) coincided with the detection of the HE neutrino IC-170922A. Calculating the VLBI brightness temperature of the core based on its flux density and width, it was found the highest nearly at the time of the peak flux density of the flare F7.
We also analysed its VLBI jet, finding that its radio structure, beyond the radio brightening, exhibits a prominent jet curve at 15 GHz, also that its components reside at quasi-stationary core separations. Such a property was already identified in the jet of the BL Lac object S5 1803+784 (Kun et al., 2018) and interpreted as “lantern regions” in a helical jet, indicative of small inclination angles with respect to the line-of-sight. The average Doppler factor of the core limits the inclination angle as being smaller than . The radio jet pointing towards the Earth facilitates the emission of HE neutrinos in coincidence with the observed -ray flare (IceCube Collaboration et al., 2018) and the recent substantial increase in the radio emission of the blazar TXS 0506+056.
Acknowledgements
We would like to thank the referee for valuable comments. EK thanks to K. É. Gabányi and S. Frey for the discussions on the topic. This work was supported by the Hungarian National Research Development and Innovation Office (NKFIH) in the form of the grant 123996 and based upon work from the COST action CA15117 (CANTATA), supported by COST (European Cooperation in Science and Technology). This research has made use of data from the OVRO 40-m monitoring programme (Richards, J. L. et al. 2011, ApJS, 194, 29) which is supported in part by NASA grants NNX08AW31G, NNX11A043G, and NNX14AQ89G and NSF grants AST-0808050 and AST-1109911. This research has made use of data from the MOJAVE database that is maintained by the MOJAVE team (Lister et al., 2009, AJ, 137, 3718). The National Radio Astronomy Observatory is a facility of the National Science Foundation operated under cooperative agreement by Associated Universities, Inc.
References
- Aartsen et al. (2014) Aartsen M. G. et al., 2014, Physical Review Letters, 113, 101101
- Britzen et al. (2010) Britzen S. et al., 2010, A&A, 511, 57
- Condon et al. (1982) Condon J. J., Condon M. A., Gisler G., Puschell J. J., 1982, ApJ, 252, 102
- Gabányi, Moór & Frey (2018) Gabányi K. É., Moór A., & Frey S., 2018, RNAAS, 2c, 130
- Gergely & Biermann (2009) Gergely L. Á., Biermann P. L., 2009, ApJ, 697, 1621
- IceCube Collaboration et al. (2015) IceCube Collaboration et al., 2015, ArXiv e-prints
- IceCube Collaboration et al. (2018) IceCube Collaboration et al., 2018, Science, 361, eeat1378
- IceCube Collaboration (2018) IceCube Collaboration, 2018, Science, 361, 147
- Kadler et al. (2016) Kadler M. et al., 2016, Nature Physics
- Kudryavtseva et al. (2011) Kudryavtseva N. A., Gabuzda D. C., Aller M. F., Aller H. D., 2011, MNRAS, 415, 1632
- Kun (2017) Kun E., 2017, PhD thesis, University of Szeged
- Kun, Biermann & Gergely (2017) Kun E., Biermann P. L., Gergely L. Á., 2017, MNRAS Lett., 466, L34
- Kun et al. (2014) Kun E., Gabányi K. É., Karouzos M., Britzen S., Gergely L. Á., 2014, MNRAS, 445, 1370
- Kun et al. (2018) Kun E., Karouzos M., Gabányi K. É., Britzen S., Kurtanidze O. M., Gergely L. Á., 2018, MNRAS, 478, 359
- Lister et al. (2016) Lister M. L., Aller M. F., Aller H. D., Homan D. C., Kellermann K. I., Kovalev Y. Y., Pushkarev A. B., Richards J. L., Ros E., Savolainen T., 2016, AJ, 152, 12
- Lister et al. (2013) Lister M. L. et al., 2013, AJ, 146, 120
- Lister et al. (2009) Lister M. L. et al., 2009, AJ, 138, 1874
- Padovani et al. (2018) Padovani P., Giommi P., Resconi E., Glauch T., Arsioli B., Sahakyan N., Huber M., 2018, MNRAS, 480, 192
- Paiano et al. (2018) Paiano S., Falomo R., Treves A., Scarpa R., 2018, ApJL, 854, L32
- Pyatunina et al. (2006) Pyatunina T. B., Kudryavtseva N. A., Gabuzda D. C., Jorstad S. G., Aller M. F., Aller H. D., Teräsranta H., 2006, MNRAS, 373, 1470
- Pyatunina et al. (2007) Pyatunina T. B., Kudryavtseva N. A., Gabuzda D. C., Jorstad S. G., Aller M. F., Aller H. D., Teräsranta H., 2007, MNRAS, 381, 797
- Planck Collaboration et al. (2016) Planck Collaboration et al., 2016, A&A, 594, A13
- Readhead (1994) Readhead A. C. S., 1994, ApJ, 426, 51
- Schoenen & Raedel (2015) Schoenen S., Raedel L., 2015, The Astronomer’s Telegram, 7856
- Shepherd, Pearson & Taylor (1994) Shepherd M. C., Pearson T. J., Taylor G. B., 1994, in BAAS, Vol. 26, Bulletin of the American Astronomical Society, pp. 987–989
- Stecker et al. (1991) Stecker F. W., Done C., Salamon M. H., Sommers P., 1991, Physical Review Letters, 66, 2697
- Steffen et al. (1995) Steffen W., Zensus J. A., Krichbaum T. P., Witzel A., Qian S. J., 1995, A&A, 302, 335
- Vermeulen & Cohen (1994) Vermeulen R. C., Cohen M. H., 1994, ApJ, 430, 467
- Urry & Padovani (1995) Urry C. M., Padovani P., 1995, PASP, 107, 803