The relation between Hi Gas and Star Formation Properties in Nearby Galaxies
Abstract
In this paper, we present some correlations of neutral hydrogen (Hi) gas and physical properties of galaxies to investigate the role of atomic gas in governing galaxy evolution. We build a Hi-detected sample including 70 galaxies that are detected by ALFALFA in a 15 deg2 region, and derive their star formation distribution based on the images of narrow-band observed here. In general, Hi-detected galaxies have low surface density of stellar mass and active star formation. Additionally, most of the galaxies are in good agreement with the star-forming main sequence, consistent with the previous findings. We confirm the dependence of star formation (SF) in galaxies on Hi gas at least on global scale, i.e., star formation rate (SFR) generally increases with Hi mass, specific star formation rate (SSFRSFR/M∗) increases with Hi fraction () even for a given stellar mass, and Hi-based star formation efficiency (SFE) mildly increases with the stellar mass and SFR surface density. Based on the distribution of stellar mass and star formation, we calculate the morphology indices of the sample, and analyze the dependence of and SFE on them. The weak correlations between SFE and morphological indexes imply a weak physical link between Hi and star formation in small scale. We find that mildly increases with the asymmetry and decreases with the concentration of galaxies, suggesting that the Hi gas supply and its effect are likely correlated with external processes in the extended disks of galaxies.
1 Introduction
The interstellar medium (ISM) is the fuel for the star formation and accretion processes in galaxies, and is fundamental to galaxy formation and evolution. The conversion of gas into stars is the basic process which governs the life of a galaxy. As an important cold ISM component, atomic hydrogen, is widespread in galaxy disks and can be traced by the 21-cm line of neutral hydrogen (Hi). Hi gas is able to convert to molecular gas in regions where Hi reaches high enough densities and metallicities to become shielded from interstellar ultraviolet (UV) photons (Krumholz2012). Because molecular gas is directly related to star formation, atomic gas can be regarded as the reservoir of future star formation in a galaxy (Kauffmann2015). Thus, investigating how and why the atomic gas content of a galaxy varies with stellar mass and other physical properties can provide initial clues to its growth history.
There have been many works that present the relationships of Hi content with galaxy properties, such as stellar mass, color, morphology, star formation, and environment (e.g., Fumagalli2008; Cortese2011; Wang2011; Hughes2013). In general, galaxies with more gas are bluer and more actively star forming. Observations have shown the well-known connection between the star formation rate (SFR) and gas content as parameterized by the Kennicutt-Schmidt Law (K-S Law; Kennicutt1998a; Kennicutt2012), indicating that integrated SFR surface density is regulated by the gaseous surface density. Motivated by the K-S star formation law, many investigations have explored the scaling relations of the Hi gas fraction with galaxy structure and properties, and calibrated a series of photometric estimators of Hi mass fraction with stellar mass, stellar surface mass density, colors, and specific SFR (SSFRSFR/M∗; e.g., Zhang2009; Catinella2010; Li2012). Huang2012 investigate the global scaling relations and fundamental planes linking stars and gas for a sample of Hi-bearing galaxies. They found that 96% of their sample belong to the blue cloud, with the average gas fraction fHI . Bothwell2013 found a three-dimensional fundamental relation between stellar mass, gas-phase metallicity, and Hi mass, with Hi-rich galaxies being more metal poor at a given stellar mass, which is likely more fundamental than the relation between metallicity, SFR and mass.
Blind Hi surveys in recent years have produced large, unbiased samples of galaxies selected by Hi mass, providing invaluable insights into the research of Hi gas in nearby galaxies (see Giovanelli2016, for a review), such as the Hi Parkes All-Sky Survey (HIPASS; Barnes2001; Meyer2004) and the Hi Jodrell All-Sky Survey (HIJASS; Lang2003). The Arecibo Legacy Fast ALFA (ALFALFA) survey, a wide-field Hi survey completed most recently, maps 7000 deg2, detects more than 30,000 extragalactic Hi sources, and provides the first full census of extragalactic Hi line sources over a cosmologically significant volume in the local universe out to 0.06 (Giovanelli2005; Haynes2011). Based on ALFALFA catalog, many samples are selected and analyzed in different galaxy regimes. For example, the HIghMass sample selected by Huang2014 includes Hi-massive and high-Hi-fraction galaxies, the Survey of Hi in Extremely Low-mass Dwarfs (SHIELD; Cannon2011) includes a sample of galaxies with Hi masses below outside the Local Group. Besides that, Sistine2016 utilizes a large sample of Hi-selected galaxies between 20100 Mpc from the ALFALFA survey to study star formation in the local universe based on the narrow-band imaging of emission line. Gavazzi2012 completed a similar narrow-band imaging survey of an Hi line flux-selected sample of Local Supercluster galaxies to probe the role of the environment in shaping the star formation properties of galaxies.
Most of the target selections in previous studies usually focused on certain types of galaxies with specific criteria of physical properties (Wang2017a), and missed a fraction of galaxies which are also detected in Hi surveys. Even in the .40-SDSS-GALEX sample of Huang2012, there are nearly one-third of galaxies excluded from the parent sample. Therefore, a complete, systematic sample of nearby galaxies is urgently needed to help investigate scaling relations between Hi gas and galactic properties, determine the differences in the physical properties of Hi-rich and -poor galaxies.
In this paper, we try to present more about the relations between cold gas and star formation in nearby galaxies. We focus on a 15 deg2 region of ALFALFA survey, select all galaxies detected by ALFALFA in this sky area, take the narrow-band imaging to trace their star formation activity, and analyze how the star forming properties correlate with Hi gas.
The paper is organized as follows. In Section 2, we introduce in detail the sample selection, the data used in this paper, narrow-band imaging, and data reduction. In Section 3 we describe our methodology for measurement the SFR and stellar mass () of Hi sample. Section 4 presents the physical properties of our sample, and analyzes the relations between the Hi content, star formation, stellar mass, and galactic morphology. We discuss our findings in Section 5 and summarize the results in Section 6.
In the following, we adopt a standard CDM cosmology with , , and .
2 Data and Sample
2.1 Samples and ALFALFA data
The ALFALFA survey presents a database of 21 cm Hi line sources over 7000 deg2 of the sky at high Galactic latitude, yielding a source density of 5.3 galaxies per deg2. This survey covers the recessional velocity range up to 18,000 km s-1 with the resolution of 5 km s-1, and can detect Hi masses as low as 106 and as high as 1010.8 with positional accuracies typically better than 20′′ (Haynes2011). In the ALFALFA catalog, the detections with signal-to-noise ratio S/N6.5 are categorized as “Code 1” which are nearly 100% reliable, the sources categorized as “Code 2” have low S/N () but coincide with likely optical counterparts at the same redshift. The Hi mass is computed via the formula , where is the distance to the galaxy in the unit of Mpc, and is the integrated Hi line flux density of the source, in Jy km s-1.
Our sample is selected from a 7.5 2 deg2 sky region of the ALFALFA survey (, ). It contains all detections with both the code 1 and 2, and adopts the Hi measures, distances, and Hi masses presented in the .40 catalog of Haynes2011. There are 70 extragalactic Hi sources in our sample, 58 with code 1 and 12 with code 2.
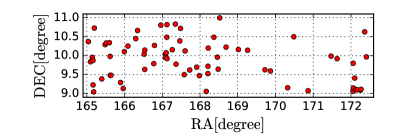
Figure 1 presents the distribution of the sample galaxies in the sky region. This region is located in the field near the Virgo cluster, and most of our samples are field galaxies. It should be noted that Hi galaxies used in this study are only the objects that can be detected by ALFALFA survey, and the Hi-undetected galaxies in the same region may also contain some Hi gas, but under the detection limiting of ALFALFA (Haynes2011). Beside that, based on the results from Gavazzi2013a, there are no clear difference in the physical properties for galaxies with projected distance 10∘ from M 87. Thus, although our sample is located in the sky region near the Virgo cluster, the effect of coherent structures from Virgo cluster on the property of our galaxies can be negligible.
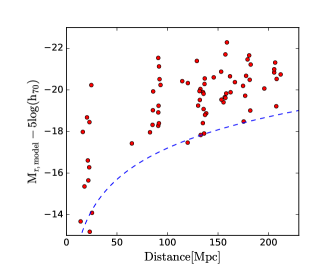
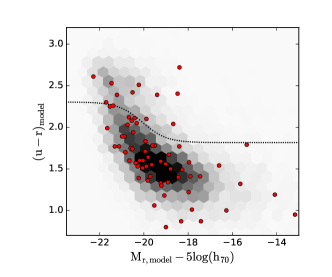
As shown in Figure 2, most of the galaxies in our sample are located at the distance of 20-230 Mpc with the median distance of 135 Mpc. The right panel of Figure 2 illustrates the distribution of the samples in the color-magnitude diagram with the gray background for all of the ALFALFA-SDSS overlap galaxies shown in Haynes2011. We also superpose the optimum divider used by Baldry2004 to separate the red sequence from the blue cloud. Hi-detected galaxies are clearly dominated by blue spiral galaxies.
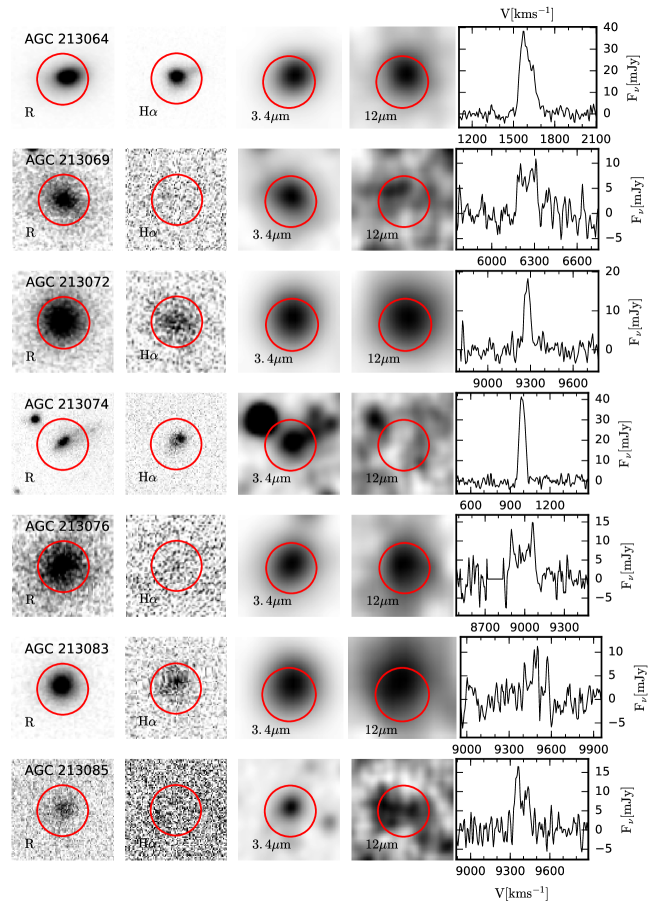
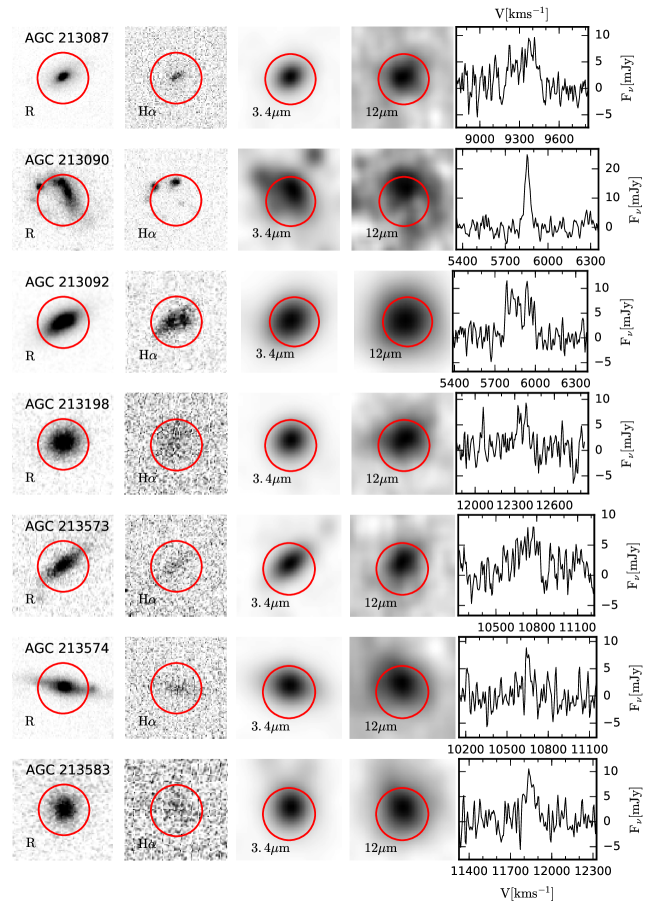
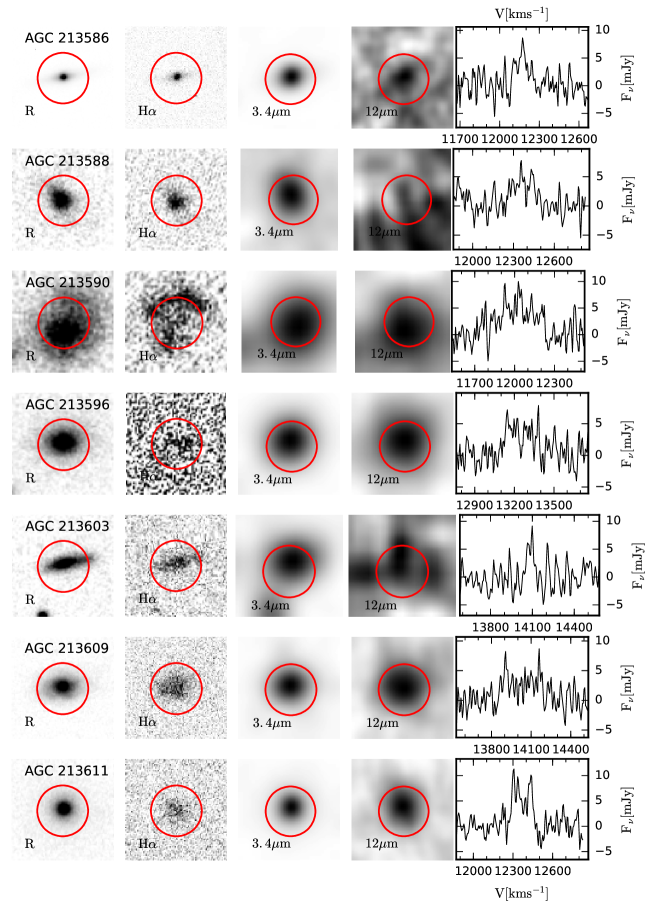
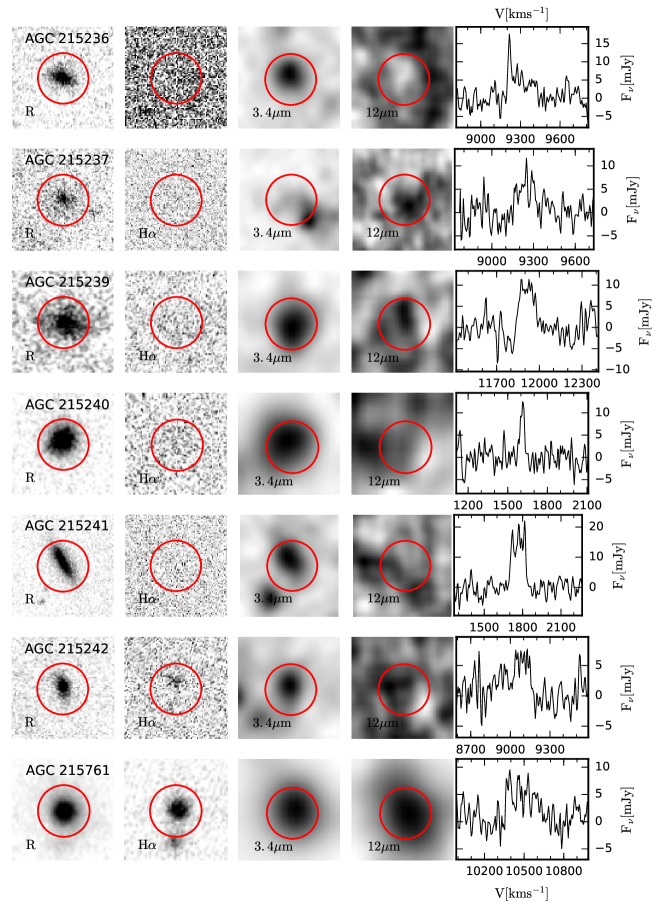
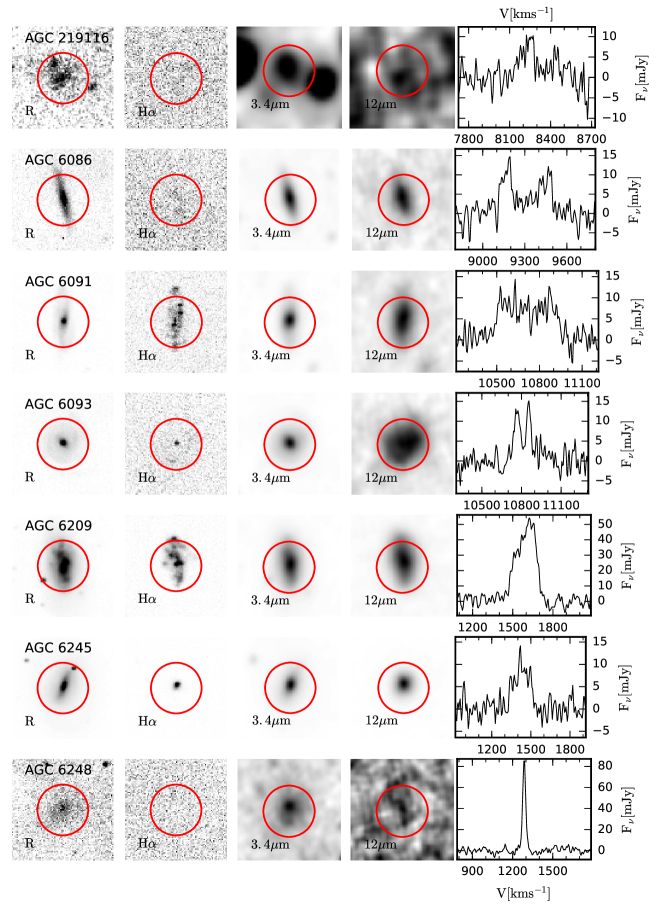
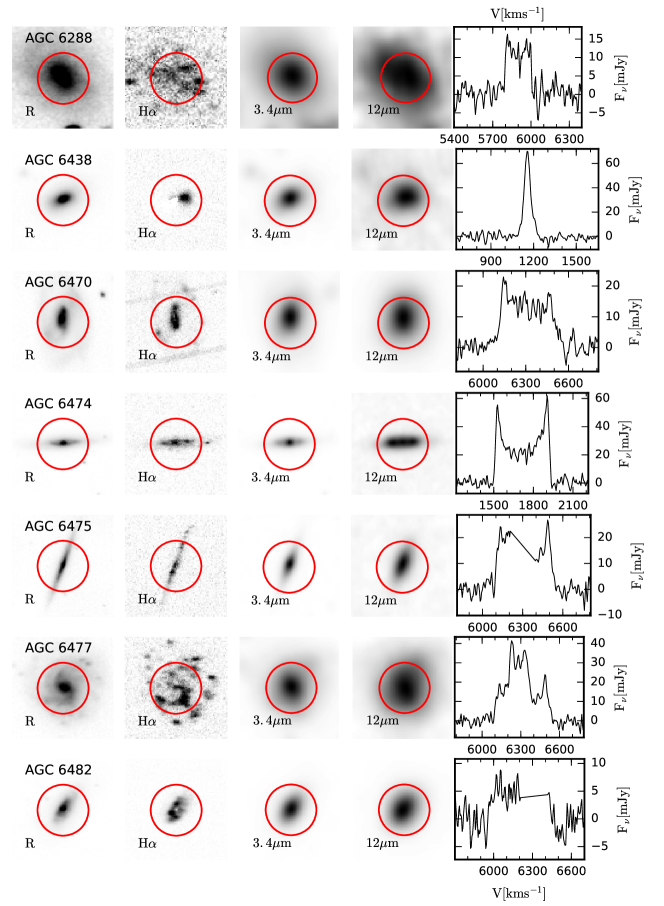
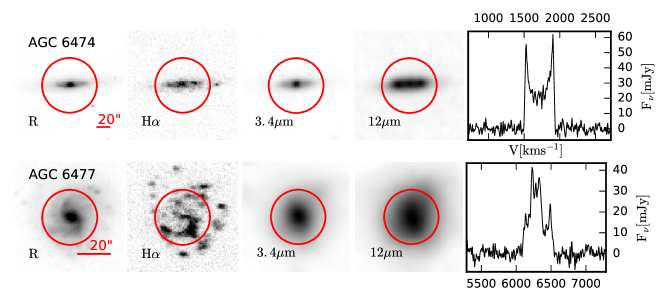
In Figure A.1, we present the Hi profiles of all galaxies, which are derived from ALFALFA. Nearly a half of the sample show the typical two-horned profile of a spiral galaxy, especially for the edge-on galaxies, such as AGC 6474. Besides that, about 10 galaxies have a single peak of the Hi profile with velocity width , such as AGC 213090 and AGC 6438, which indicates galaxies of sufficiently low mass (Courtois2009). AGC 6248 is the most anorexic of galaxies in the our sample, its is , and the stellar mass is only . There are also some anomalous behaviors in the Hi profiles, such as multi-peaks (e.g., AGC 6477, AGC 215241), asymmetric (e.g., AGC 6209, AGC 215236). If true, they are likely derived by the physical process in the galaxy evolution, while some may be due to low signal-to-noise S/N or contamination from near neighbors.
2.2 narrow-band observation and data reduction
The H emission in galaxies can be used as a good star formation tracer (Kennicutt1998b; Zhu2008). We performed H narrow-band observations for the Hi-detected galaxies in the spring of 2012. The observations were completed by two instruments on two telescopes, respectively. One is the BAO Faint Object Spectrograph and Camera (BFOSC) mounted on the 2.16m telescope (Fan2016) at Xinglong Observatory of the National Astronomical Observatories, Chinese Academy of Sciences (NAOC). The other is the Yunnan Faint Object Spectrograph and Camera (YFOSC) mounted on 2.4m telescope (Fan2015) in the Lijiang observational station of Yunnan observatories, Chinese Academy of Sciences (YNAO). Most objects were observed in photometric conditions: six nights in January and March for BFOSC, and six nights in April for YFOSC.
In the 70 Hi-detected galaxies, 43 galaxies were imaged by BFOSC, which has a Lick 1242 1152 CCD detector with the pixel scale of 0457 pixel-1 and field of view (FOV) of . The others were observed with YFOSC, whose CCD has the FOV of with the pixel scale of 0283 pixel-1. The galaxies were imaged with the broad-band filter and narrow-band filters covering H emission line (rest-frame wavelength of ). We used the same set of H filters in BFOSC and YFOSC, which includes 11 narrow-band filters with the central wavelengths between 656.2 and 706.0 nm with an FWHM of 7 nm, corresponding to redshifts of . It should be noted that the H narrow-band filters also include two [N ii] 6548, 6583 emission lines, a proper correction for [N ii] emission is required before the final H flux is computed. The total exposure times were typically s for and s for H based on the observational condition.
We took our data reduction using IRAF111IRAF is the Image Reduction and Analysis Facility written and supported by the IRAF programming group at the National Optical Astronomy Observatories (NOAO) in Tucson, Arizona, which is operated by AURA, Inc. under cooperative agreement with the National Science Foundation, and created continuum-subtracted images following the procedure described in Zhou2015. We summarize this procedure below. First of all, our images were reduced using the standard reduction pipeline, including subtracting overscan and bias, correcting bad pixels and flat fielding, removing cosmic rays, and adding astrometric solutions. Then, flux calibration of broad-band images was made using the field stars cross-matched with SDSS DR10 catalog, whose magnitudes are converted to system following on Robert Lupton’s transformation equations on SDSS website222http://www.sdss3.org/dr10/algorithms/sdssUBVRITransform.php. Next, the scaled -band image as stellar continuum was subtracted from each H image, and the scale factor for each image was calculated with the flux of a dozen unsaturated field stars near the galaxy. Finally, flux calibration was made for H images based on the scale factors and effective transmissions of narrow-band and -band filters.
For the H images, we then made some corrections before we got the final integrated H flux. First, a small fraction ( 6%) of H emission is lost in the process of continuum removal (Kennicutt2008), so we recovered this flux by comparing the scale factors and effective transmissions of narrow-band and filters. Second, we corrected the Galactic foreground extinction based on the Schlegel1998 dust maps and the assumption of absorbing medium. Then, the deblending from [N ii] was corrected based on the Equation (B1) of Kennicutt2008. Finally, the uncertainties of our integrated H fluxes are 10%.
2.3 Ancillary data
To significantly improve the statistics of our samples, a few more data sets are used for analysis or comparison in this paper.
We supplement the photometric data from the Wide Field Infrared Survey Explorer (WISE; Wright2010) to measure SFRs and stellar masses of our Hi-detected sample. WISE has mapped the entire sky at 3.4, 4.6, 12, and 22m with an angular resolution of 61, 64, 65, and 120, respectively. We searched the ALLWISE database for detections within 6′′ of the optical coordinates of Hi-detected galaxies, and derived their profile-fit photometry magnitudes in these infrared bands.
The Sloan Digital Sky Survey (SDSS; York2000) provides homogeneous photometric and spectroscopic data of high quality for very large and objectively selected samples of galaxies over one-third of the sky. We derived galaxy properties from the MPA-JHU spectroscopic analysis which presents catalogs of the measurements of absorption line indices and emission line fluxes as well as stellar masses, SFRs, and oxygen abundance for the SDSS-DR7 legacy galaxy redshift sample (Brinchmann2004; Kauffmann2003).
3 MEASUREMENTS
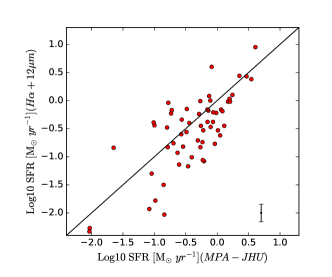
We calculate SFRs of the galaxies using the H emission and WISE 12m photometric fluxes with the method of Wen2014:
| (1) |
This formula is calibrated with solar abundance and the Salpeter initial mass function (IMF) with a slope of 2.35 for stellar masses in the range 0.1–100 . Given the uncertainties of our photometric results and SFR calibration we used, the median variation of the SFRs we calculated is 0.033 dex along with most of them ( 80%) less than 0.1 dex.
There are 62 Hi-selected galaxies in SDSS MPA-JHU catalog. We compared our result with the global SFRs from the MPA-JHU catalog in Figure 4. The latter is derived based on fiber spectroscopic analysis and aperture correction (Brinchmann2004). Our SFRs agree well with MPA-JHU SFRs, with no systematic offset and a median difference of 0.03 dex, although noticeable outliers exist. There are some discrepancies between the two SFRs for several galaxies. Large deviations for the outliers are likely due to the differences between the real stellar distribution and models used for aperture correction in Brinchmann2004.
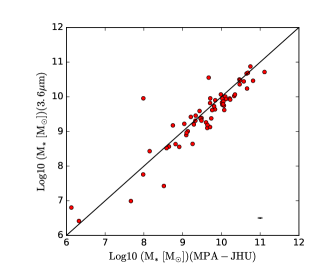
The stellar mass of our Hi-selected galaxies is calculated using WISE 3.4 m luminosities with the equation in Wen2013:
| (2) |
We compared our results with those derived from SDSS MPA-JHU catalog in Figure 5. MPA-JHU stellar masses are obtained from fits to the photometry with BC03 models (Bruzual2003) spanning a large range in star formation histories (Kauffmann2003). The stellar masses estimated with the two methods are in excellent agreement for most of the galaxies with a median difference of 0.130.28 dex.
4 Analysis
4.1 Physical properties of Hi-detected galaxies
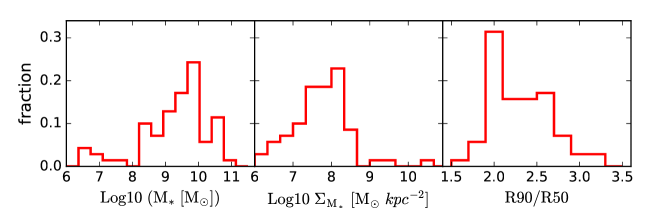
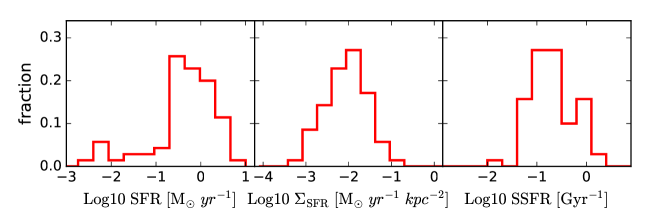
Figure 6 presents the distribution of physical properties of the Hi-detected galaxies. The histograms show stellar mass , SFR, SSFR, surface densities of stellar mass and SFR, concentration index. The concentration index is traced by the size ratio, , which are the semi-major axes of the ellipses that encompasses 90% and 50% of the SDSS r-band Petrosian flux, respectively. The stellar mass surface density is given by , and the SFR surface density is given by . The mean stellar mass is 9.48 for the galaxies, and the mean of the stellar mass surface density is . In general, the galaxies in our sample have active star formation with and .
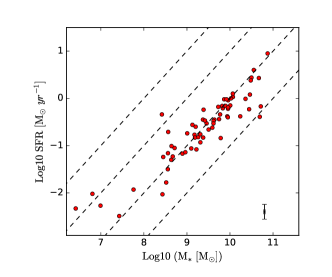
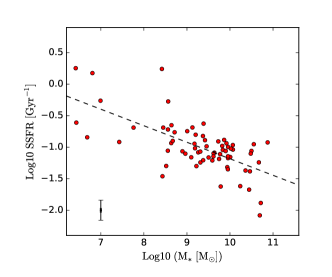
To explore further the dependence of atomic gas on integrated galaxy properties, the distributions of the samples in the SFR- and SSFR- planes are presented in Figure 7. Clearly, the sample of Hi-detected galaxies is located following the star-forming main sequence which shows a linear correlation between the logarithm of the SFR and the logarithm of (Brinchmann2004; Elbaz2007; Lee2015). These galaxies have SSFRs in the range of Gyr-1, consistent with what we found in Figure 6.
For the galaxies in SSFR- plane of Figure 7, we find that SSFRs decrease with increasing stellar mass. We perform robust linear fittings to their relations, and find that the slope is for all of the Hi-detected sample. The slope is much shallower than that for the relation of non-star-forming galaxies (Bauer2013).
4.2 Gas scaling relations of the Hi-detected galaxies
To demonstrate the role of Hi gas in galaxy evolution, we further investigate the correlations between Hi and physical properties of galaxies.
4.2.1 The SFR and SSFR in Hi-detected Galaxies
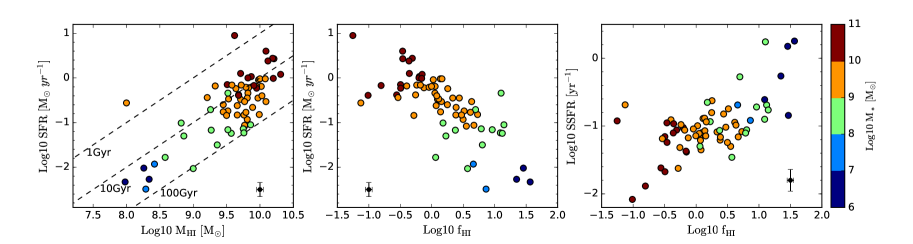
Figure 8 shows how SFR and SSFR vary with Hi mass () and Hi fraction () along with the bins. We confirm the previous findings (e.g., Huang2012) that SFRs generally increase with but decrease with and SSFRs increase with , and these trends still exist in a given bins. The star formation efficiency () mainly varies in the range of . Besides that, we also find the scaling relations of increasing and decreasing with .
However, there are two extreme outliers (IC 676 and IC 698) deviating from the -SFR and -SSFR relations in Figure 8. Both galaxies have much lower or higher SFE than the other counterparts with similar SFR and . IC 676 is a S0 barred galaxy with double star-forming nuclei. It is still unclear if stellar bar or/and galaxy interaction promotes the consumption of Hi gas and the formation of the second nucleus. IC 698 is likely a Sa galaxy with obvious irregular spiral structures in the outer disk, and is likely perturbed by galaxy interaction, which may also drive the high SFE of this galaxy.
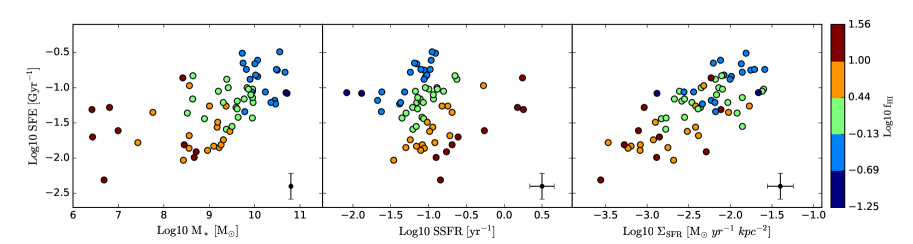
SFE indicates the efficiency that galaxies convert the Higas to molecular gas and then stars. Figure 9 presents the variation of Hi-based SFE as a function of , SSFR and , respectively. In general, SFE increases slightly with , and galaxies with high Hi gas fraction have low SFE, which may indicate a low-efficiency SF law or low-efficient Hi-to- conversion in these galaxies (Huang2012). There are large scatter in the SSFR-SFE relation, but SFE increases with SSFR at fixed bins. This may be caused by the positive correlation between SFR and SFE. As shown in the right panel of Figure 9, SFE increases with the SFR surface density , suggesting that the efficiency of Hi-to- conversion is high at the region with high .
4.2.2 The relations between Hi and galaxy morphology
The morphologies and kinematics of galaxies are able to provide the clues as to the process of gas accretion, and also may determine the gas properties and efficiency of converting Hi gas to and stars (e.g., Blitz2006; Powell2013). We derive the concentration (), asymmetry () and smoothness () indices from our -band and continuum-subtracted images.
characterizes the compactness of the light distribution in a galaxy, and is defined to be the ratio of two radii, each of which contains fixed fractions of the total flux in a galaxy (e.g., Kent1985; Bershady2000). Here, we use the index defined by Kent1985:
| (3) |
where and are the radii which contain 20% and 80% of the total luminosity, respectively.
describes the rotational symmetry of a galaxy system, and is calculated by comparing the galaxy images before and after rotated with the usual rotation angle (Abraham1996; Conselice2000b):
| (4) |
where and are the intensity distribution in the original image and rotated image with rotation angle of 180, respectively.
measures the patchiness of the light distribution in a galaxy, and is defined as the ratio of the amount of light contained in high-frequency structures to its integrated light in the galaxy (Conselice2003):
| (5) |
where is the flux distribution of the galaxy, is also the flux distribution, but smoothed with a filter with (here is 0.3 times the Petrosian radius of the galaxy), and is the background value.
The parameters correlate with star formation and major merging activity, and can be used to understand the evolutionary history of a galaxy (Conselice2003). Here we use the indices from -band images to characterize the stellar distribution of galaxies, and use the indices from images to characterize the star formation distribution.
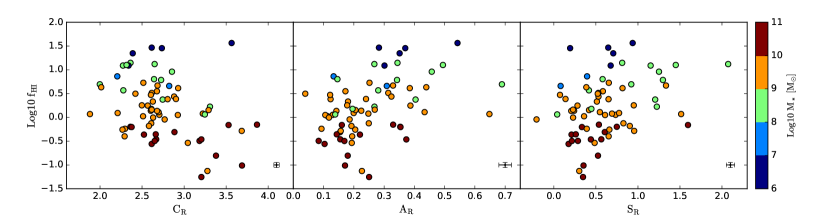
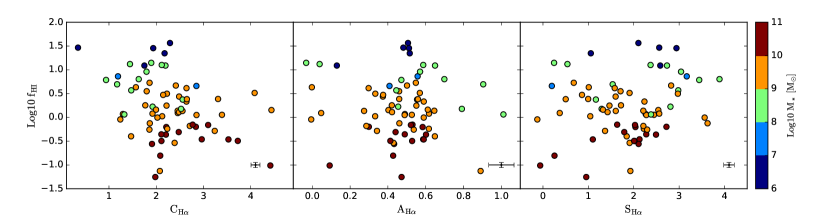
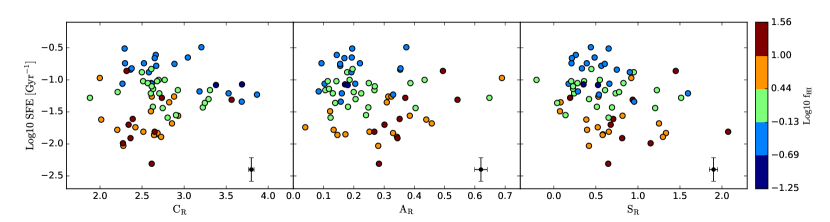
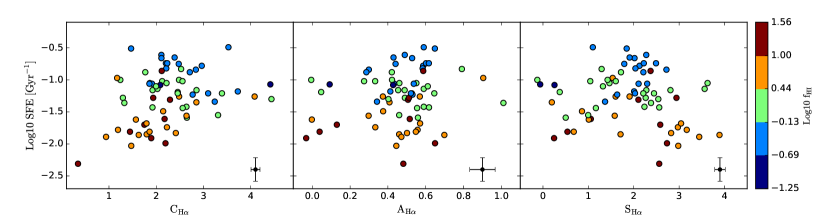
Figure 10 presents the correlations of Hi fraction and the indices for our Hi-detected galaxies. It can be seen that, in general, galaxies with lower concentration or higher asymmetry have higher gas fraction, although the dependence becomes very weak at a given stellar mass. The mild trend of Hi fraction with the is likely an indication of external processes or mechanisms that control the gas accretion and supply (Schiminovich2010). In the bottom three panels of Figure 10, we find little or no obvious trends between and indices for star formation distribution in galaxies except vs. , but which is likely driven by the stellar mass. It may suggest that there is little correlation between the spacial distribution of star formation activity and gas fraction due to the smooth process of gas accretion (Wang2011).
In order to explore the effect of galaxy morphology on SFE, we plot Hi-based SFE on a function of indices in Figure 11. In each panel, the galaxies are binned with the gas fraction. However, in most of the panels, we find little trends between SFE and the morphology index of stellar mass and star formation. Only weak correlation exists between SFE and concentration , especially for . For the galaxies with , SFE appears to increase with . While for the objects with , the trend is seemingly reversed. The discrepancy between the galaxies with high and low concentration is similar to the display between Hi depletion times and stellar surface density found by Jaskot2015, and is likely due to the quenching of star formation in more massive galaxies.
5 Discussion
Atomic gas plays an important role in the evolution of galaxies by providing the fuel for star formation activity. The study of Hiis essential to gaining a better understanding of the main physical processes in galaxy evolution. In the current work, we have derived the properties of Hi-detected galaxies in a ALFALFA sky region, and investigated relations between Hi gas content (mass , fraction and SFE) and global galaxy properties such as star formation activity and morphology.
There have been many studies into the question of how the Hiproperties of galaxies vary with star formation, galaxy structure, and other physical properties (e.g., Roberts1994; Haynes2011; Toribio2011a; Huang2012). As we found in Figures 2 and 6, Hi-detected galaxies are dominated by blue star-forming galaxies, and are strongly biased against the red sequence in the color-magnitude diagram. Many studies have pointed out that there are significant differences between the distributions of physical properties for Hi-detected and -undetected galaxies, such as stellar mass surface density, star formation activity, and morphological index (West2010; Haynes2011). Similarly, Huang2012 compared the Hi and optically selected samples over the same restricted volume, and found that the Hi-selected population is relatively less evolved and has overall higher SFR, higher SSFR, and bluer colors at a given stellar mass, but lower SFE and extinction.
These results are further reinforced by the distributions of our samples in the SFR and SSFR versus stellar mass diagrams. As Figure 7 shows, most of Hi-detected galaxies are in good agreement with the star-forming main sequence. In addition, the SSFRs of the our sample show a much shallower decline with increasing stellar mass than the normal non-star-forming galaxies. In agreement with our results, Bauer2013 found that the dependence of SSFR on stellar mass is steeper for the full sample of galaxies than it is for just the star-forming population. Gavazzi2013b found a similar trend in the SSFR-mass diagrams, and identified a four-step sequence of the galaxy quenching process including Hi-rich late-type galaxies, Hi-poor late-type galaxies, Hi-poor galaxies with little star formation, but post-starburst signature, and early-type galaxies.
Recent investigations into the evolutionary properties of galaxies have tried to find possible mechanisms for transforming galaxies from blue actively star-forming systems into red passive systems (e.g., Bothwell2009; Peng2015; Davies2016b). Because Hi gas is the initial reservoir where molecular gas and stars are formed subsequently, the star formation in the main Sequence galaxies is supposed to be the produce of relatively stable processes, such as gas inflow and accretion (Davies2016a), and the low SFRs of the red sequence result from a lack of available gas supply (Bothwell2009). Saintonge2016 indicated that if there are no extended Hi envelopes or other sources of accretion to replenish the gas reservoirs, galaxies in the main sequence will cease actively forming stars and migrate to the red cloud along with the simultaneous processes in the transformation, such as reduction of the gas fractions, ageing of stellar population and growth of central bulges.
Consistent with these results, Figure 8 shows that SFRs generally increase with Hi mass, SSFRs increase with Hi fraction even for the galaxies in given stellar masses, and further confirms the dependence of star formation in galaxies on Hi gas. The Hi-based SFE also shows an increasing function of stellar mass and (Figure 9). Although Huang2012 found that SFE remains relatively constant in the high range, we did not find this trend limiting to our sample.
In addition, the and SFE of Hi-selected galaxies also show correlations with the distribution of stellar mass and star formation in galaxies. As illustrated in Figures 10 and 11, mildly increases with the asymmetry and decreases with the concentration of galaxies, and SFE mildly increases with the concentration at the lower end. This may suggest that the Hi gas supply and effect are more correlated with external processes or extended disks of galaxies (Wang2011). Extended galaxies generally have low concentration for the distributions of their stellar mass and star formation, and external processes accrete their ISM to the outer disk which is dominated by Hi gas. As a result, the galaxies with lower concentration will have higher gas fraction. Furthermore, SFE decreases with radius across the outer disks of spirals (Bigiel2010b), thus lower SFE is expected in the galaxies with lower concentration.
While the atomic gas shows a strong correlation with star formation on global scales of galaxies, there seems to be little or no relations between them on smaller scales because star formation is more directly related to molecular gas than atomic gas. As we showed in Figures 10 and 11, and SFE have relatively weak or no connections with the distributions of star formation in galaxies except for the concentration, and the cause might be that the gas richness of galaxies is more closely correlated with the past-averaged star formation in the last Gyr than with the current star formation (Catinella2010; Kannappan2013). In addition, more detailed studies on sub-kpc scales show the lack of correlation between surface densities of SFR and Hi (e.g., Kennicutt2007; Bigiel2008). Wang2017b indicated that the apparently different behaviors of Hi-SFR relations on different scales may be caused by side effects, i.e., Hi and SFR both correlate with other physical parameters of galaxies, such as galaxy size and stellar mass, but the physical link between them is intrinsically weak.
Owing to the fact that stars are formed in molecular regions on parsec scales, the above results were somewhat expected. However, Hi gas still plays an important role in governing the star formation activity (Fumagalli2008; Bigiel2010b). Besides regulating the formation of giant molecular clouds (Blitz2004), Hi is found to correlate with star formation in the outer disks of spirals and in dwarf galaxies where the ISM is dominated by neutral gas (Bigiel2010a; Wang2011). In the investigations of the star formation Schmidt law, Liu2015 found the total gas density () shows a steeper function with SFR density than only molecular gas density, especially at the low density regime of molecular gas, indicating that atomic gas may have indirect effect on SF.
While many observational studies have been made, current results for the relation of Hi and star formation are still limited by the relatively small number of statistics and lack of deeper data. The star formation tracers used in current works, such as UV, IR, and H observations, usually have not enough detection limiting, spacial resolution, or sky coverage. Thanks to the recent and upcoming deep surveys, such as the South Galactic Cap u-band Sky Survey (SCUSS; ZhouX2016; Zou2015), which provide opportunities to measure SFRs of unprecedented large samples with optical u-band data (Zhou2017). Hence, analyses of larger samples of galaxies based on SCUSS and Hi data will be the subject of our future work.
6 Summary
We have investigated the correlations of Hi gas and physical properties of galaxies with the aim of exploring the role of Hi in governing galaxy evolution. We select all galaxies detected by ALFALFA in a 15 deg2 sky region as the Hi-detected sample, and observe the H narrow-band imaging to derive their star formation properties. We derive the physical properties of the galaxies and analyze the dependence of star formation and structure on Hi gas. Our main results can be summarized as follows:
-
1.
We have obtained , SFR, SSFR, , and concentration index of Hi-detected galaxies. In general, our Hi-detected galaxies have low and active star formation, consistent with previous findings. Most of the galaxies are in good agreement with the star-forming main sequence in the SFR- plane, and show shallower dependence of SSFR on stellar mass than non-star-forming samples.
-
2.
The dependence of star formation in galaxies on Hi gas is confirmed at least on global scale: SFRs generally increase with Hi mass but decrease with Hi fraction, SSFRs increase with Hi fraction even for the galaxies in given stellar mass bins. Hi-based SFE is found to increase with the stellar mass and SFR surface density.
-
3.
and SFE of Hi-selected galaxies show correlations with the distribution of stellar mass and star formation in galaxies. mildly increases with the asymmetry and decreases with the concentration of galaxies, and SFE mildly increases with the concentration at the lower end, suggesting that the Hi gas supply and effect is likely more correlated with external processes or extended disks of galaxies.
-
4.
There are relatively weak or no trends found between , SFE and other morphological indices except the concentration for the distributions of stellar mass and star formation in galaxies, which may be caused by the weak physical link between Hi and star formation in small scale and the smooth accretion process of Hi gas.
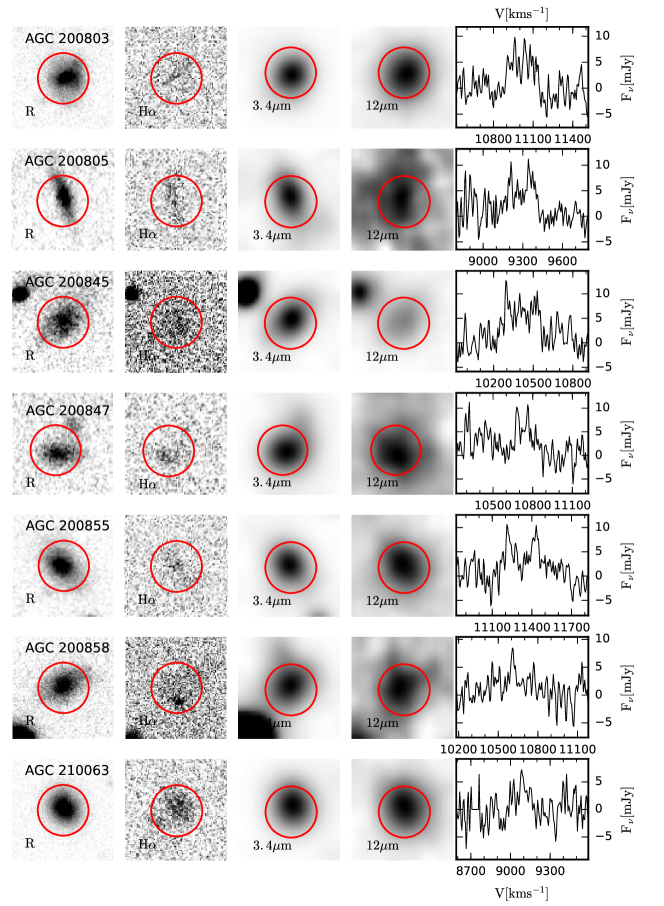
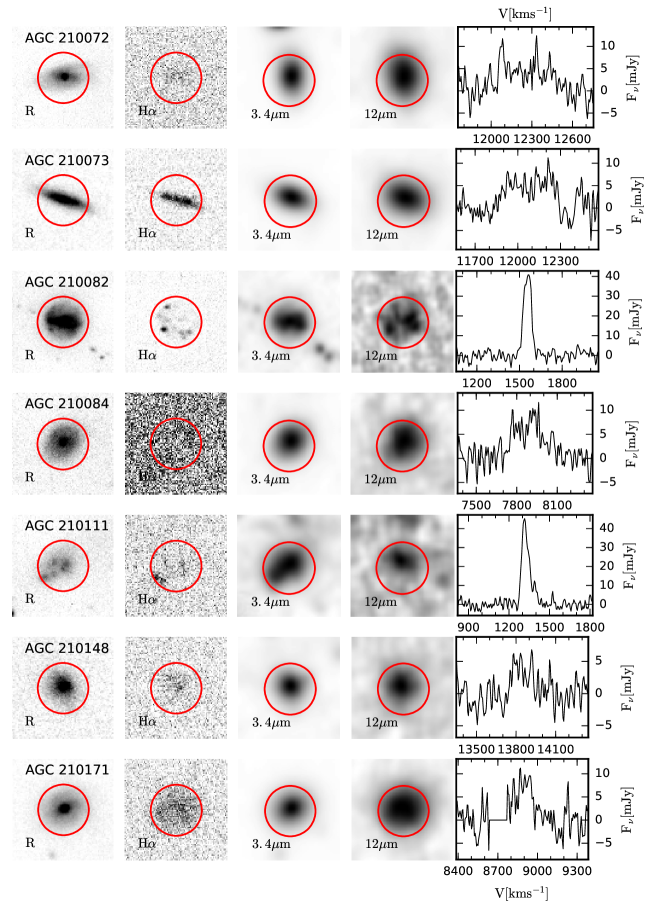
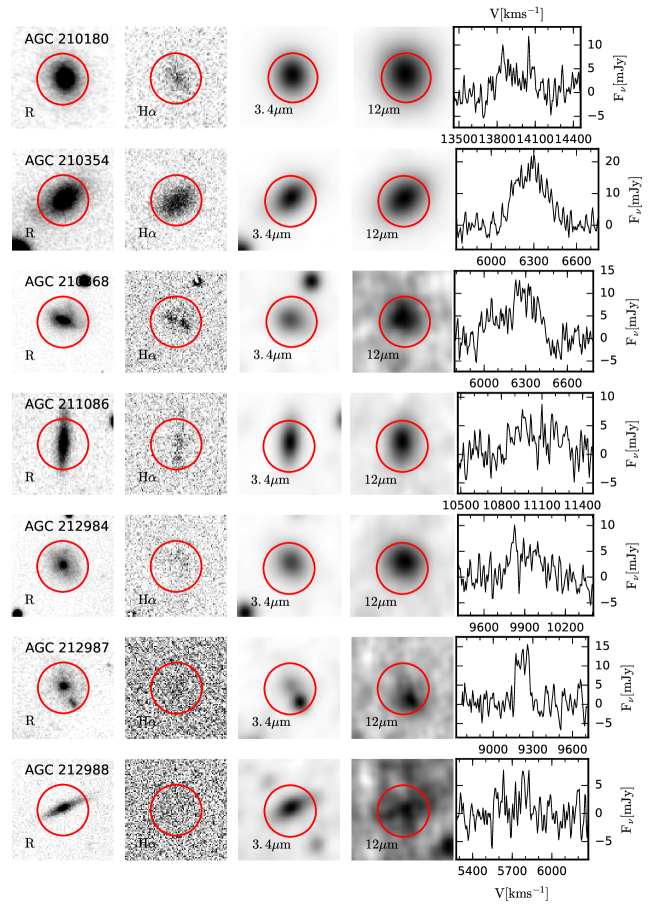
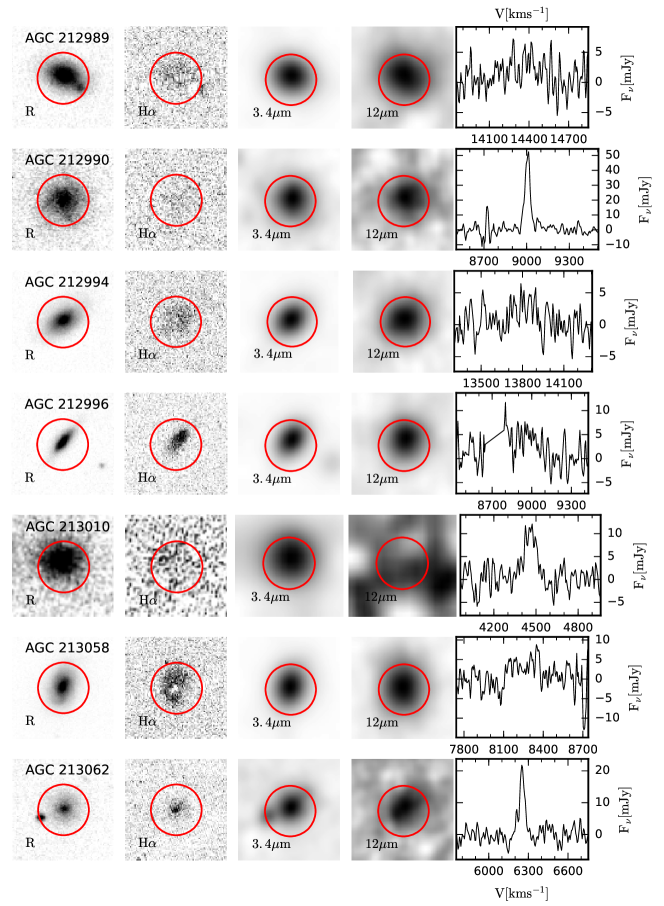
Appendix A The Atlas
An Atlas of the 70 galaxies in our sample is given in this Appendix. Table A.1 provides the information of the galaxies and the fluxes of Hi and WISE IR emission. Table A.2 gives the physical properties and morphological parameters for galaxies. Figure A.1 displayed the images in broadband , continuum-subtracted narrowband H, WISE IR 3.4m and 12m, along with the Hi Spectrum from ALFALFA.
| AGC | R.A. | Decl. | Distance | |||||
|---|---|---|---|---|---|---|---|---|
| (deg) | (deg) | (km s-1) | (Mpc) | (km s-1) | (erg s-1 cm-2) | (erg s-1 cm-2) | (erg s-1 cm-2) | |
| (1) | (2) | (3) | (4) | (5) | (6) | (7) | (8) | (9) |
| 200803 | 165.04793 | 10.36444 | 11018 | 162.4 10.9 | 1.18 0.18 | -11.88 0.01 | -11.79 0.01 | -13.40 0.03 |
| 200805 | 165.09541 | 9.84944 | 9296 | 137.8 9.3 | 1.31 0.15 | -12.50 0.01 | -12.84 0.12 | -13.54 0.03 |
| 200845 | 165.48582 | 10.29500 | 10417 | 153.8 10.4 | 1.89 0.24 | -11.93 0.01 | -11.97 0.01 | -12.99 0.03 |
| 200847 | 165.51083 | 10.34417 | 10721 | 158.2 10.8 | 0.78 0.11 | -12.29 0.01 | -12.44 0.05 | -13.26 0.04 |
| 200855 | 165.59958 | 10.34333 | 11327 | 166.8 11.2 | 1.41 0.20 | -12.29 0.01 | -12.32 0.04 | -13.66 0.03 |
| 200858 | 165.62459 | 9.98861 | 10682 | 157.6 10.6 | 0.74 0.14 | -12.47 0.01 | -12.54 0.07 | -13.59 0.02 |
| 210063 | 166.95834 | 10.81361 | 9089 | 134.9 9.1 | 0.50 0.12 | -12.03 0.01 | -12.07 0.03 | -13.51 0.02 |
| 210072 | 167.08084 | 10.0525 | 12255 | 180.1 12.1 | 2.14 0.21 | -11.44 0.01 | -11.56 0.01 | -13.43 0.03 |
| 210073 | 167.07916 | 9.95694 | 12067 | 177.4 12.0 | 2.11 0.20 | -11.58 0.01 | -11.45 0.01 | -13.20 0.01 |
| 210082 | 167.35042 | 10.83667 | 1555 | 17.5 1.4 | 2.72 0.10 | -12.31 0.01 | -12.68 0.08 | -13.32 0.02 |
| 210084 | 167.35791 | 9.76972 | 7862 | 117.4 7.9 | 1.57 0.15 | -12.00 0.01 | -12.25 0.02 | -13.87 0.04 |
| 210111 | 167.60583 | 10.12278 | 1320 | 17.5 1.2 | 3.02 0.13 | -12.70 0.01 | -12.55 0.06 | -13.88 0.03 |
| 210148 | 167.91417 | 9.69444 | 13847 | 202.9 13.6 | 0.69 0.10 | -12.18 0.01 | -12.23 0.03 | -13.79 0.10 |
| 210171 | 168.36581 | 10.48472 | 8885 | 131.9 8.8 | 1.16 0.13 | -11.55 0.01 | -12.04 0.02 | -13.39 0.02 |
| 210180 | 168.68459 | 10.22833 | 13958 | 204.4 13.7 | 1.34 0.18 | -11.71 0.01 | -11.64 0.01 | -13.47 0.02 |
| 210354 | 172.06084 | 9.08278 | 6254 | 94.4 6.3 | 4.58 0.17 | -11.51 0.01 | -11.40 0.01 | -12.70 0.00 |
| 210368 | 172.25792 | 9.10083 | 6287 | 94.9 6.4 | 1.55 0.11 | -12.37 0.01 | -12.64 0.08 | -13.76 0.04 |
| 211086 | 167.12582 | 10.80806 | 10978 | 161.8 10.9 | 1.07 0.17 | -12.15 0.01 | -12.16 0.03 | -13.79 0.03 |
| 212984 | 165.99001 | 10.10806 | 9907 | 146.6 9.8 | 1.21 0.14 | -12.00 0.01 | -12.02 0.02 | -14.24 0.10 |
| 212987 | 166.30249 | 10.44778 | 9220 | 136.7 9.3 | 1.34 0.12 | -12.60 0.01 | -12.90 0.12 | -13.46 0.05 |
| 212988 | 166.53793 | 10.03222 | 5776 | 87.5 6.0 | 0.40 0.11 | -12.63 0.01 | -12.98 0.14 | -14.29 0.06 |
| 212989 | 166.53625 | 10.14528 | 14349 | 210.0 14.1 | 0.64 0.13 | -12.15 0.01 | -12.32 0.04 | -13.77 0.02 |
| 212990 | 166.79501 | 10.26639 | 9005 | 133.7 9.0 | 2.33 0.11 | -12.43 0.01 | -12.49 0.05 | -13.89 0.08 |
| 212994 | 167.10957 | 10.48944 | 13805 | 202.2 13.6 | 0.53 0.12 | -12.08 0.01 | -12.24 0.03 | -13.62 0.01 |
| 212996 | 167.46541 | 10.40083 | 8928 | 132.6 8.9 | 1.55 0.19 | -12.33 0.02 | -12.38 0.04 | -13.90 0.02 |
| 213010 | 170.49083 | 10.49444 | 4461 | 66.2 4.8 | 0.96 0.10 | -12.57 0.01 | -13.05 4.34 | -15.71 3.10 |
| 213058 | 165.63792 | 9.47194 | 8241 | 122.8 8.2 | 0.92 0.19 | -11.70 0.01 | -11.96 0.01 | -13.54 0.01 |
| 213062 | 166.77167 | 9.80222 | 6254 | 94.4 6.3 | 0.88 0.06 | -12.46 0.01 | -12.59 0.07 | -13.56 0.05 |
| 213064 | 167.72626 | 9.62278 | 1604 | 17.5 1.4 | 3.65 0.10 | -12.01 0.01 | -12.31 0.03 | -12.68 0.01 |
| 213069 | 168.20749 | 9.52278 | 6250 | 94.3 6.3 | 1.10 0.11 | -12.76 0.01 | -12.85 0.36 | -14.62 0.37 |
| 213072 | 169.71918 | 9.62889 | 9278 | 137.6 9.2 | 0.86 0.05 | -11.96 0.01 | -11.84 0.01 | -13.46 0.01 |
| 213074 | 169.86583 | 9.59917 | 990 | 13.7 0.9 | 2.14 0.05 | -13.00 0.02 | -13.13 1.00 | -13.40 0.01 |
| 213076 | 170.32251 | 9.15194 | 8981 | 133.3 8.9 | 1.55 0.13 | -12.39 0.01 | -12.59 0.06 | -14.15 0.09 |
| 213083 | 170.86749 | 9.08750 | 9456 | 140.1 9.4 | 0.61 0.12 | -12.43 0.01 | -12.64 0.07 | -14.39 0.06 |
| 213085 | 171.63333 | 9.91945 | 9391 | 139.2 9.3 | 1.22 0.11 | -12.74 0.01 | -12.84 0.25 | -14.20 0.25 |
| 213087 | 172.05290 | 9.80417 | 9321 | 138.2 9.4 | 1.31 0.15 | -12.15 0.01 | -12.39 0.04 | -13.90 0.04 |
| 213090 | 172.36917 | 10.62361 | 5855 | 88.6 5.9 | 0.98 0.06 | -12.70 0.01 | -12.79 0.11 | -13.43 0.01 |
| 213092 | 172.41000 | 9.96444 | 5887 | 89.1 6.2 | 1.51 0.13 | -12.14 0.01 | -12.12 0.03 | -13.63 0.01 |
| 213198 | 168.51875 | 10.98972 | 12357 | 181.5 12.2 | 0.61 0.09 | -12.10 0.01 | -12.34 0.04 | -13.40 0.02 |
| 213573 | 165.16417 | 9.22806 | 10723 | 158.2 10.6 | 0.97 0.14 | -12.48 0.01 | -12.67 0.08 | -13.75 0.03 |
| 213574 | 165.16917 | 9.04778 | 10651 | 157.2 10.6 | 0.28 0.06 | -12.14 0.01 | -12.38 0.06 | -14.16 0.02 |
| 213583 | 165.39708 | 9.38944 | 11826 | 174.0 11.7 | 0.73 0.09 | -12.09 0.01 | -12.05 0.02 | -13.32 0.03 |
| 213586 | 165.97125 | 9.13944 | 12171 | 178.9 12.0 | 0.63 0.12 | -11.41 0.00 | -12.73 0.07 | -13.85 0.01 |
| 213588 | 166.53084 | 9.63806 | 12358 | 181.6 12.2 | 0.79 0.11 | -12.78 0.01 | -12.88 0.25 | -13.45 0.09 |
| 213590 | 167.12709 | 9.92556 | 12027 | 176.8 11.9 | 1.67 0.17 | -12.50 0.01 | -12.52 0.05 | -13.36 0.01 |
| 213596 | 167.57959 | 9.50917 | 13260 | 194.5 13.1 | 1.00 0.15 | -12.14 0.01 | -12.16 0.02 | -14.57 0.22 |
| 213603 | 167.99208 | 9.46028 | 14080 | 206.2 13.8 | 0.34 0.06 | -12.67 0.01 | -13.06 0.20 | -14.15 0.02 |
| 213609 | 168.20876 | 9.73389 | 14033 | 205.5 13.8 | 1.01 0.15 | -12.27 0.01 | -12.40 0.05 | -13.73 0.01 |
| 213611 | 168.47542 | 9.64583 | 12370 | 181.8 12.2 | 1.14 0.10 | -11.65 0.00 | -12.19 0.02 | -13.38 0.02 |
| 215236 | 166.10249 | 10.26389 | 9314 | 138.1 9.3 | 1.29 0.16 | -12.99 0.02 | -13.03 0.21 | -13.98 0.04 |
| 215237 | 166.35249 | 10.67500 | 9233 | 136.9 9.2 | 0.84 0.14 | -13.18 0.03 | -13.03 0.17 | -13.78 0.08 |
| 215239 | 167.27249 | 10.16722 | 11916 | 175.3 11.7 | 1.01 0.11 | -13.16 0.03 | -13.11 0.86 | -13.87 0.04 |
| 215240 | 168.47542 | 9.93583 | 1610 | 17.5 1.4 | 0.46 0.06 | -13.20 0.03 | -13.07 1.00 | -15.39 1.97 |
| 215241 | 169.25917 | 10.14778 | 1765 | 17.5 1.8 | 1.97 0.11 | -12.97 0.02 | -13.09 2.10 | -15.05 1.17 |
| 215242 | 167.09500 | 10.08333 | 9090 | 134.9 9.1 | 0.78 0.11 | -13.07 0.02 | -12.83 0.24 | -14.37 0.18 |
| 215761 | 165.64250 | 9.48167 | 10486 | 154.8 10.4 | 1.36 0.16 | -12.35 0.01 | -12.55 0.05 | -13.27 0.01 |
| 219116 | 165.89792 | 9.29194 | 8226 | 122.6 8.2 | 0.93 0.10 | -13.11 0.03 | -12.93 0.54 | -13.65 0.02 |
| 6086 | 165.14334 | 9.95333 | 9304 | 137.9 9.3 | 2.40 0.31 | -11.85 0.01 | -12.09 0.02 | -13.41 0.03 |
| 6091 | 165.16708 | 9.87639 | 10715 | 158.1 10.6 | 3.49 0.20 | -11.51 0.01 | -11.86 0.01 | -13.02 0.01 |
| 6093 | 165.20375 | 10.73056 | 10806 | 159.4 10.8 | 1.36 0.15 | -11.29 0.01 | -12.05 0.02 | -12.87 0.01 |
| 6209 | 167.48624 | 10.72000 | 1584 | 18.1 1.4 | 8.58 0.25 | -11.25 0.01 | -11.16 0.00 | -11.95 0.01 |
| 6245 | 168.17125 | 9.06528 | 1421 | 17.5 1.2 | 1.39 0.12 | -10.79 0.01 | -10.45 0.00 | -12.37 0.01 |
| 6248 | 168.21750 | 10.19972 | 1286 | 17.5 1.1 | 2.53 0.05 | -12.86 0.02 | -13.08 0.19 | -13.65 0.05 |
| 6288 | 169.01500 | 10.17083 | 5897 | 89.3 6.0 | 2.46 0.14 | -12.15 0.01 | -12.37 0.04 | -13.29 0.01 |
| 6438 | 171.47292 | 9.98472 | 1156 | 20.4 1.5 | 3.88 0.07 | -11.47 0.01 | -11.87 0.01 | -13.54 0.01 |
| 6470 | 172.05916 | 9.14778 | 6311 | 95.2 6.4 | 5.77 0.20 | -10.99 0.01 | -10.88 0.00 | -12.58 0.01 |
| 6474 | 172.09750 | 9.41083 | 1716 | 33.1 2.1 | 12.37 0.21 | -10.76 0.01 | -11.43 0.00 | -12.28 0.01 |
| 6475 | 172.14458 | 9.09805 | 6309 | 95.2 6.5 | 7.40 0.22 | -11.16 0.01 | -11.43 0.00 | -12.99 0.01 |
| 6477 | 172.15457 | 9.09972 | 6288 | 94.9 6.5 | 5.63 0.13 | -11.55 0.01 | -11.57 0.01 | -12.60 0.01 |
| 6482 | 172.26625 | 9.10639 | 6201 | 93.6 6.3 | 2.03 0.22 | -10.69 0.01 | -10.40 0.00 | -12.58 0.01 |
| AGC | |||||||||
|---|---|---|---|---|---|---|---|---|---|
| () | () | ( yr-1) | |||||||
| (1) | (2) | (3) | (4) | (5) | (6) | (7) | (8) | (9) | (10) |
| 200803 | 9.87 0.07 | 10.07 0.01 | 0.03 0.01 | 2.36 0.02 | 0.35 0.01 | 0.75 0.02 | 2.84 0.11 | 0.30 0.14 | 2.72 0.16 |
| 200805 | 9.77 0.05 | 9.22 0.02 | -1.08 0.10 | 2.67 0.05 | 0.17 0.03 | 0.58 0.03 | 1.80 0.10 | 0.46 0.13 | 1.70 0.15 |
| 200845 | 10.02 0.05 | 9.97 0.01 | -0.19 0.02 | 2.70 0.05 | 0.13 0.03 | 0.73 0.03 | 3.39 0.11 | 0.53 0.14 | 2.44 0.16 |
| 200847 | 9.66 0.06 | 9.59 0.01 | -0.62 0.05 | 1.88 0.08 | 0.64 0.05 | 1.51 0.05 | 1.29 0.16 | 0.49 0.20 | 2.26 0.23 |
| 200855 | 9.97 0.06 | 9.64 0.02 | -0.45 0.04 | 2.62 0.02 | 0.18 0.01 | 0.51 0.01 | 2.64 0.11 | 0.59 0.14 | 2.23 0.16 |
| 200858 | 9.64 0.08 | 9.39 0.02 | -0.24 0.03 | 2.49 0.03 | 0.17 0.02 | 0.95 0.02 | 1.76 0.10 | 0.42 0.12 | 1.71 0.13 |
| 210063 | 9.33 0.10 | 9.73 0.02 | -0.18 0.02 | 2.29 0.01 | 0.19 0.01 | 0.65 0.01 | 1.46 0.09 | 0.65 0.12 | 1.84 0.13 |
| 210072 | 10.21 0.04 | 10.67 0.01 | 0.43 0.01 | 2.66 0.01 | 0.15 0.01 | 0.56 0.01 | 2.96 0.11 | 0.58 0.13 | 2.12 0.15 |
| 210073 | 10.19 0.04 | 10.50 0.01 | 0.44 0.01 | 2.88 0.02 | 0.15 0.01 | 0.60 0.01 | 2.47 0.04 | 0.44 0.04 | 1.79 0.05 |
| 210082 | 8.29 0.02 | 7.43 0.01 | -2.49 0.04 | 2.20 0.01 | 0.13 0.00 | 0.39 0.01 | 1.19 0.09 | 0.55 0.11 | 3.16 0.13 |
| 210084 | 9.71 0.04 | 9.62 0.01 | -0.48 0.02 | 2.20 0.01 | 0.19 0.01 | 0.78 0.01 | 2.45 0.15 | 0.05 0.18 | 0.36 0.21 |
| 210111 | 8.34 0.02 | 6.99 0.01 | -2.27 0.04 | 2.38 0.02 | 0.35 0.01 | 0.71 0.01 | 2.17 0.13 | 0.51 0.16 | 1.05 0.18 |
| 210148 | 9.83 0.07 | 9.95 0.01 | -0.22 0.03 | 2.60 0.03 | 0.24 0.02 | 0.83 0.02 | 1.86 0.33 | 0.46 0.41 | 3.62 0.47 |
| 210171 | 9.68 0.05 | 10.24 0.01 | -0.38 0.02 | 2.61 0.01 | 0.10 0.00 | 0.17 0.01 | 1.90 0.08 | 0.43 0.10 | 2.10 0.12 |
| 210180 | 10.12 0.06 | 10.48 0.01 | 0.38 0.01 | 2.52 0.02 | 0.22 0.01 | 0.21 0.01 | 2.20 0.08 | 0.60 0.10 | 2.49 0.12 |
| 210354 | 9.98 0.02 | 9.96 0.01 | -0.04 0.01 | 2.51 0.01 | 0.11 0.01 | 0.36 0.01 | 2.12 0.02 | 0.33 0.03 | 1.04 0.03 |
| 210368 | 9.52 0.03 | 9.01 0.01 | -0.74 0.04 | 2.61 0.03 | 0.31 0.01 | 0.53 0.02 | 4.08 0.14 | 0.56 0.18 | 1.90 0.20 |
| 211086 | 9.82 0.07 | 9.77 0.01 | -0.34 0.03 | 2.92 0.02 | 0.10 0.01 | 0.61 0.02 | 2.85 0.13 | 0.48 0.16 | 2.27 0.18 |
| 212984 | 9.79 0.05 | 9.83 0.01 | -0.21 0.03 | 2.76 0.02 | 0.18 0.01 | 0.21 0.02 | 1.24 0.34 | 0.01 0.42 | 0.12 0.48 |
| 212987 | 9.77 0.04 | 9.10 0.02 | -1.06 0.08 | 2.68 0.06 | 0.32 0.03 | 1.33 0.04 | 2.41 0.18 | 0.50 0.22 | 2.82 0.25 |
| 212988 | 8.86 0.12 | 8.63 0.02 | -1.3 0.07 | 3.30 0.04 | 0.26 0.02 | 1.22 0.02 | 1.92 0.23 | 0.45 0.28 | 2.80 0.32 |
| 212989 | 9.82 0.09 | 10.02 0.02 | 0.00 0.02 | 2.37 0.02 | 0.35 0.01 | 0.33 0.01 | 2.21 0.07 | 0.58 0.09 | 2.03 0.11 |
| 212990 | 9.99 0.02 | 9.26 0.02 | -0.82 0.05 | 2.51 0.03 | 0.25 0.02 | 0.65 0.02 | 1.85 0.29 | 0.54 0.36 | 0.67 0.41 |
| 212994 | 9.71 0.10 | 10.07 0.01 | 0.10 0.02 | 2.66 0.01 | 0.14 0.01 | 0.26 0.01 | 2.10 0.05 | 0.48 0.07 | 2.27 0.08 |
| 212996 | 9.81 0.06 | 9.37 0.02 | -0.45 0.02 | 2.88 0.02 | 0.32 0.01 | 0.53 0.01 | 2.48 0.07 | 0.37 0.08 | 1.60 0.09 |
| 213010 | 9.00 0.04 | 8.43 0.02 | -2.03 0.32 | 2.27 0.03 | 0.28 0.02 | 0.42 0.02 | 1.47 0.31 | 0.44 0.44 | 2.98 0.42 |
| 213058 | 9.51 0.09 | 10.01 0.01 | -0.15 0.01 | 2.65 0.01 | 0.16 0.01 | 0.21 0.01 | 2.10 0.04 | 0.52 0.05 | 2.01 0.06 |
| 213062 | 9.27 0.03 | 8.89 0.01 | -1.17 0.06 | 2.74 0.04 | 0.40 0.02 | 1.20 0.02 | 2.55 0.17 | 0.55 0.21 | 1.16 0.24 |
| 213064 | 8.42 0.01 | 7.76 0.01 | -1.93 0.01 | 2.82 0.01 | 0.30 0.01 | 0.08 0.01 | 2.84 0.01 | 0.40 0.01 | 0.19 0.01 |
| 213069 | 9.36 0.04 | 8.56 0.02 | -1.50 0.35 | 2.64 0.04 | 0.14 0.02 | 0.58 0.02 | 1.62 0.31 | 0.69 0.48 | 3.88 0.41 |
| 213072 | 9.58 0.03 | 9.82 0.01 | -0.16 0.01 | 2.29 0.02 | 0.09 0.01 | 0.39 0.01 | 2.23 0.06 | 0.61 0.07 | 2.22 0.09 |
| 213074 | 7.98 0.01 | 6.42 0.03 | -2.33 0.08 | 3.56 0.04 | 0.54 0.02 | 0.94 0.03 | 2.29 0.06 | 0.50 0.08 | 2.10 0.09 |
| 213076 | 9.81 0.04 | 9.31 0.01 | -0.93 0.06 | 2.42 0.03 | 0.03 0.01 | 0.52 0.02 | 2.22 0.31 | 0.33 0.38 | 2.97 0.44 |
| 213083 | 9.45 0.08 | 9.31 0.01 | -0.76 0.05 | 2.60 0.03 | 0.22 0.02 | 0.24 0.02 | 2.45 0.22 | 0.64 0.27 | 2.21 0.31 |
| 213085 | 9.75 0.04 | 8.96 0.02 | -1.14 0.24 | 2.72 0.03 | 0.34 0.02 | 1.30 0.02 | 0.93 0.34 | 0.47 0.42 | 3.44 0.28 |
| 213087 | 9.77 0.05 | 9.62 0.01 | -0.53 0.04 | 3.29 0.03 | 0.20 0.02 | 0.42 0.02 | 4.43 0.15 | 0.40 0.18 | 2.54 0.21 |
| 213090 | 9.26 0.03 | 8.56 0.02 | -0.71 0.02 | 1.99 0.02 | 0.68 0.01 | 0.92 0.01 | 1.17 0.03 | 0.90 0.04 | 1.53 0.05 |
| 213092 | 9.45 0.04 | 9.20 0.02 | -0.60 0.02 | 2.56 0.01 | 0.38 0.01 | 0.28 0.01 | 2.21 0.03 | 0.55 0.04 | 1.46 0.04 |
| 213198 | 9.68 0.07 | 9.94 0.01 | -0.38 0.04 | 2.26 0.03 | 0.20 0.02 | 0.66 0.02 | 1.85 0.07 | 0.53 0.08 | 2.29 0.10 |
| 213573 | 9.76 0.07 | 9.38 0.02 | -0.83 0.08 | 2.80 0.04 | 0.12 0.02 | 0.65 0.03 | 2.64 0.13 | 0.55 0.15 | 0.50 0.18 |
| 213574 | 9.21 0.10 | 9.75 0.01 | -0.44 0.04 | 3.04 0.02 | 0.19 0.01 | 0.48 0.01 | 2.38 0.09 | 0.42 0.11 | 1.90 0.13 |
| 213583 | 9.72 0.06 | 9.90 0.01 | -0.16 0.03 | 2.58 0.06 | 0.19 0.03 | 0.90 0.04 | 2.70 0.10 | 0.28 0.12 | 2.21 0.14 |
| 213586 | 9.68 0.08 | 10.69 0.01 | -0.39 0.03 | 3.68 0.01 | 0.17 0.01 | 0.35 0.01 | 4.41 0.05 | 0.09 0.06 | 0.06 0.06 |
| 213588 | 9.79 0.07 | 9.18 0.02 | -0.77 0.16 | 2.92 0.06 | 0.38 0.03 | 0.81 0.04 | 2.63 0.29 | 0.29 0.36 | 1.58 0.41 |
| 213590 | 10.09 0.04 | 9.46 0.02 | -0.53 0.04 | 2.01 0.02 | 0.43 0.01 | 0.38 0.02 | 1.56 0.05 | 0.01 0.06 | 1.00 0.06 |
| 213596 | 9.95 0.07 | 9.95 0.01 | -0.19 0.03 | 2.63 0.02 | 0.11 0.01 | 0.23 0.01 | 2.02 0.73 | 0.58 0.40 | 3.56 0.44 |
| 213603 | 9.53 0.09 | 9.42 0.02 | -0.47 0.06 | 2.69 0.04 | 0.43 0.02 | 0.55 0.03 | 2.48 0.09 | 0.42 0.11 | 1.42 0.12 |
| 213609 | 10.00 0.06 | 9.86 0.02 | -0.02 0.03 | 2.67 0.02 | 0.14 0.01 | 0.21 0.01 | 2.55 0.06 | 0.27 0.08 | 1.60 0.09 |
| 213611 | 9.95 0.04 | 10.44 0.01 | -0.23 0.02 | 3.18 0.02 | 0.08 0.01 | 0.28 0.01 | 3.72 0.07 | 0.41 0.09 | 2.00 0.10 |
| 215236 | 9.76 0.06 | 8.67 0.03 | -1.23 0.18 | 2.27 0.15 | 0.05 0.08 | 1.15 0.09 | 2.19 0.16 | 0.64 0.20 | 2.73 0.23 |
| 215237 | 9.57 0.07 | 8.45 0.04 | -1.24 0.13 | 2.64 0.17 | 0.26 0.10 | 2.07 0.11 | 1.44 0.28 | 0.04 0.35 | 0.53 0.40 |
| 215239 | 9.86 0.05 | 8.71 0.04 | -1.05 0.56 | 2.36 0.09 | 0.34 0.05 | 0.81 0.06 | 1.89 0.13 | 0.03 0.16 | 0.24 0.19 |
| 215240 | 7.52 0.06 | 6.43 0.04 | -3.18 1.03 | 2.33 0.10 | 0.30 0.06 | 0.67 0.06 | 1.74 0.56 | 0.13 0.64 | 2.58 0.38 |
| 215241 | 8.15 0.03 | 6.68 0.03 | -3.16 1.92 | 2.61 0.05 | 0.28 0.03 | 0.64 0.03 | 0.34 0.41 | 0.48 0.57 | 2.56 0.31 |
| 215242 | 9.52 0.06 | 8.56 0.03 | -1.16 0.23 | 2.85 0.09 | 0.45 0.05 | 1.25 0.06 | 1.79 0.31 | 0.57 0.54 | 3.04 0.36 |
| 215761 | 9.89 0.05 | 9.50 0.01 | -0.66 0.04 | 2.90 0.02 | 0.24 0.01 | 0.14 0.02 | 3.30 0.04 | 0.45 0.05 | 0.99 0.06 |
| 219116 | 9.52 0.05 | 8.42 0.03 | -0.34 0.06 | 2.31 0.16 | 0.49 0.09 | 1.45 0.10 | 2.11 0.08 | 0.58 0.10 | 2.37 0.12 |
| 6086 | 10.03 0.06 | 9.95 0.01 | -0.40 0.02 | 3.22 0.02 | 0.24 0.01 | 0.69 0.02 | 1.92 0.12 | 0.61 0.14 | 2.56 0.17 |
| 6091 | 10.31 0.03 | 10.46 0.01 | 0.08 0.01 | 3.86 0.01 | 0.32 0.01 | 0.53 0.01 | 2.76 0.02 | 0.53 0.02 | 1.63 0.02 |
| 6093 | 9.91 0.05 | 10.71 0.01 | -0.17 0.02 | 3.37 0.01 | 0.17 0.01 | 0.52 0.01 | 2.08 0.06 | 0.42 0.07 | 0.25 0.08 |
| 6209 | 8.82 0.01 | 8.64 0.01 | -1.01 0.01 | 2.61 0.01 | 0.19 0.00 | 0.44 0.00 | 2.52 0.01 | 0.79 0.00 | 1.29 0.01 |
| 6245 | 8.00 0.04 | 9.13 0.01 | -0.56 0.01 | 3.27 0.01 | 0.22 0.00 | 0.30 0.00 | 2.07 0.01 | 0.89 0.01 | 1.92 0.01 |
| 6248 | 8.26 0.01 | 6.80 0.02 | -2.02 0.06 | 2.73 0.04 | 0.36 0.02 | 0.19 0.03 | 1.93 0.19 | 0.51 0.24 | 2.94 0.27 |
| 6288 | 9.66 0.03 | 9.19 0.01 | -0.83 0.02 | 2.60 0.01 | 0.12 0.01 | 0.07 0.01 | 2.14 0.02 | 0.37 0.02 | 0.85 0.03 |
| 6438 | 8.58 0.01 | 8.52 0.01 | -1.78 0.01 | 3.24 0.01 | 0.13 0.01 | 0.04 0.01 | 1.32 0.05 | 0.99 0.07 | 2.38 0.08 |
| 6470 | 10.09 0.02 | 10.55 0.01 | 0.60 0.01 | 3.20 0.01 | 0.37 0.01 | 0.44 0.01 | 3.52 0.01 | 0.58 0.02 | 1.09 0.02 |
| 6474 | 9.50 0.01 | 9.78 0.01 | -0.84 0.01 | 3.68 0.01 | 0.15 0.00 | 0.95 0.00 | 3.23 0.01 | 0.34 0.01 | 1.36 0.01 |
| 6475 | 10.20 0.01 | 10.36 0.01 | -0.01 0.01 | 3.52 0.01 | 0.16 0.01 | 1.59 0.01 | 3.09 0.01 | 0.52 0.02 | 2.02 0.02 |
| 6477 | 10.08 0.01 | 9.92 0.01 | -0.02 0.01 | 2.61 0.01 | 0.26 0.00 | 0.23 0.01 | 1.99 0.01 | 0.61 0.01 | 1.32 0.01 |
| 6482 | 9.62 0.05 | 10.87 0.01 | 0.95 0.01 | 3.20 0.01 | 0.25 0.01 | 0.35 0.00 | 1.98 0.01 | 0.47 0.01 | 0.95 0.01 |