Warped disks during type II outbursts in Be/X-ray binaries: evidence from optical polarimetry
Abstract
Context. Current models that explain giant (type II) X-ray outbursts in Be/X-ray binaries (BeXB), are based on the idea of highly distorted disks. They are believed to occur when a misaligned and warped disk becomes eccentric, allowing the neutron star to capture a large amount of material. The BeXB 4U 0115+63 underwent two major outbursts in 2015 and 2017.
Aims. Our aim is to investigate whether the structural changes in the disk expected during type II outbursts can be detected through optical polarimetry.
Methods. We present the first optical polarimetric observations and new optical spectra of the BeXB 4U 0115+63 covering the period 2013–2017. We study in detail the shape of the H line profile and the polarization parameters before, during, and after the occurrence of a type II X-ray outburst.
Results. We find significant changes in polarization degree and polarization angle and highly distorted line profiles during the 2017 X-ray outburst. The degree of polarization decreased by 1%, while the polarization angle, which is supposed to be related with the disk orientation, first increased by in about two months and then decreased by a similar amount and on a similar timescale once the X-ray activity ceased.
Conclusions. We interpret the polarimetric and spectroscopic variability as evidence for the presence of a warped disk.
Key Words.:
stars: individual: 4U 0115+63, – X-rays: binaries – stars: neutron – stars: binaries close –stars: emission line, Be1 Introduction
The X-ray source 4U 0115+63 is a Be/X-ray binary (BeXB, Ziolkowski 2002; Paul & Naik 2011; Reig 2011). These systems contain a neutron star and a Be star in a relatively wide ( few tens of days) and eccentric orbit. The most prominent feature of a Be star is the gaseous equatorial disk around its equator. The disk is in Keplerian rotation, is geometrically thin, and is in vertical hydrostatic equilibrium (Rivinius et al. 2013). The disk is of paramount importance to understanding the behavior of BeXBs as it constitutes the main source of variability and is responsible for the three main observational properties of Be stars: emission lines, infrared excess, and polarization. The emission lines and infrared excess are formed by recombination in the disk. Linear polarization results from Thomson scattering, when photons from the Be star scatter with electrons in the Be disk (Poeckert et al. 1979; Wood et al. 1996; Yudin 2001; Halonen et al. 2013; Haubois et al. 2014). The effect of Thomson scattering is to reduce the component of the electric vector parallel to the scattering plane by , where is the scattering angle, while the intensity of the perpendicular component remains unaltered after scattering. Thus the light becomes polarized perpendicularly to the scattering plane, which roughly coincides with the plane of the disk. The polarization angle then gives information about the orientation of the disk (Wood et al. 1996; Quirrenbach et al. 1997). The polarization degree increases with the optical depth (or density) of the gas in the disk and with the inclination with respect to the observer (Wood et al. 1996; Halonen et al. 2013).
BeXBs are transient X-ray sources that spend most of the time in a dormant state, although persistent X-ray sources also exist (Reig & Coe 1999). When active, transient BeXBs exhibit two types of X-ray outburst. Normal or type I outbursts show a moderate increase in X-ray flux ( erg s-1), occur near periastron passage, and last for a fraction of the orbit. Giant or type II outbursts are significantly brighter ( erg s-1), do not occur at any preferential orbital phase and may last for several orbits.
Current models that explain type II outbursts are based on the idea that a highly misaligned disk becomes warped and eccentric, allowing the neutron star to capture a large amount of material (Martin et al. 2011; Okazaki et al. 2013; Martin et al. 2014a).
Okazaki et al. (2013) performed numerical simulations and showed that the warped shape of a misaligned disk leads to enhanced mass accretion if the warped part gets across the orbit of the neutron star. They also showed that the accretion rate is much higher for small tilt angles () than for large tilt angles (). The reason is that at low tilt angles, the tidal torque of the neutron star favors the creation of dense (denser than the disk) mass streams even before the actual collision between the disk and the neutron star. When the neutron star interacts with the stream, the mass accretion rate is enhanced. In highly tilted systems, the stream forms more slowly because the tidal torque is weaker. Therefore the disk itself has to be several times denser than in less tilted systems to supply the same amount of gas.
Martin et al. (2014a) showed that giant outbursts can also occur in highly tilted systems if the disk is highly eccentric. By increasing the eccentricity of the disk, the neutron star can capture matter from its outer parts more easily than in a circular disk. There are several ways to make an initially circular disk eccentric but the most promising one appears to be the Kozai-Lidov mechanism (Kozai 1962; Lidov 1962; Martin et al. 2014b; Fu et al. 2015). The key idea in this mechanism is that the product of the disk inclination and eccentricity remains constant. Thus, a test particle that is initially on a circular orbit in a misaligned disk undergoes a series of oscillations where the inclination and eccentricity interchange periodically. During the oscillation, the disk can attain large eccentricities after a few orbital periods. Simulations show that the more tilted the disk is, the larger the disk can grow and the more eccentric it becomes (Martin et al. 2014a).
Since the polarimetric parameters depend so strongly on the internal (density) and external (orientation) conditions in the disk and the models that explain type II outbursts require warped, misaligned, eccentric precessing disks, then we should observe significant changes in the polarization degree and angle during a giant outburst. This work examines this idea.
| JD (2,400,00+) | P[%] | [%] | PA[deg] | [deg] | ||||
|---|---|---|---|---|---|---|---|---|
| 56549.5671 | 2.8 | 0.7 | -72.6 | 7.4 | -0.0228 | 0.0075 | -0.0158 | 0.0070 |
| 56576.4997 | 3.4 | 0.5 | -67.3 | 3.9 | -0.0238 | 0.0047 | -0.0242 | 0.0046 |
| 56592.4652 | 3.9 | 0.5 | -67.3 | 3.8 | -0.0272 | 0.0050 | -0.0275 | 0.0052 |
| 56623.3618 | 3.0 | 0.3 | -68.8 | 3.1 | -0.0222 | 0.0034 | -0.0202 | 0.0033 |
| 56854.5923 | 3.9 | 0.4 | -69.0 | 2.6 | -0.0291 | 0.0035 | -0.0262 | 0.0036 |
| 56872.5402 | 4.4 | 0.5 | -66.6 | 3.3 | -0.0301 | 0.0051 | -0.0320 | 0.0050 |
| 56885.5121 | 4.2 | 0.5 | -65.3 | 3.5 | -0.0277 | 0.0051 | -0.0321 | 0.0051 |
| 56903.5471 | 3.9 | 0.5 | -63.7 | 3.8 | -0.0238 | 0.0053 | -0.0309 | 0.0052 |
| 57264.5125 | 3.9 | 0.4 | -70.0 | 2.9 | -0.0301 | 0.0043 | -0.0252 | 0.0037 |
| 57346.3532 | 4.2 | 0.2 | -69.0 | 1.8 | -0.0316 | 0.0026 | -0.0284 | 0.0026 |
| 57555.5471 | 4.3 | 0.2 | -70.0 | 1.4 | -0.0328 | 0.0022 | -0.0276 | 0.0019 |
| 57641.5372 | 3.8 | 0.2 | -68.5 | 1.2 | -0.0279 | 0.0017 | -0.0261 | 0.0016 |
| 57665.4385 | 4.0 | 0.1 | -68.1 | 1.0 | -0.0292 | 0.0014 | -0.0279 | 0.0014 |
| 57695.4444 | 4.0 | 0.1 | -67.0 | 0.9 | -0.0280 | 0.0013 | -0.0288 | 0.0013 |
| 57929.5633 | 4.0 | 0.1 | -70.2 | 0.9 | -0.0312 | 0.0014 | -0.0258 | 0.0012 |
| 57957.4767 | 4.0 | 0.1 | -64.9 | 1.0 | -0.0255 | 0.0014 | -0.0306 | 0.0013 |
| 57966.4957 | 4.2 | 0.2 | -63.5 | 1.1 | -0.0252 | 0.0017 | -0.0335 | 0.0016 |
| 57970.5607 | 4.1 | 0.1 | -66.0 | 1.0 | -0.0277 | 0.0015 | -0.0307 | 0.0015 |
| 57985.6152 | 4.2 | 0.2 | -61.5 | 1.4 | -0.0228 | 0.0019 | -0.0352 | 0.0021 |
| 57986.5391 | 4.2 | 0.2 | -61.2 | 1.4 | -0.0223 | 0.0020 | -0.0352 | 0.0019 |
| 57994.5950 | 3.8 | 0.2 | -62.2 | 1.3 | -0.0215 | 0.0018 | -0.0314 | 0.0018 |
| 58015.4837 | 3.9 | 0.3 | -64.3 | 1.9 | -0.0246 | 0.0027 | -0.0309 | 0.0025 |
| 58020.5472 | 3.5 | 0.3 | -64.7 | 2.4 | -0.0221 | 0.0029 | -0.0270 | 0.0030 |
| 58043.5234 | 3.1 | 0.3 | -70.8 | 3.1 | -0.0246 | 0.0034 | -0.0195 | 0.0034 |
| Date | JD (2,400,000+) | ||||
|---|---|---|---|---|---|
| (%) | (%) | (%) | (%) | ||
| 16-06-2016 | 57555.56 | 4.141.45 | 3.890.36 | 4.290.21 | 3.240.26 |
| 10-09-2016 | 57641.55 | 4.061.43 | 4.000.34 | 3.820.17 | 3.400.15 |
| 02-11-2016 | 57695.46 | 4.120.59 | 3.890.23 | 4.020.13 | 3.620.15 |
| 01-08-2017 | 57966.53 | 4.120.76 | 4.130.25 | 4.200.16 | 3.880.14 |
| 17-10-2017 | 58043.54 | 4.851.61 | 3.070.70 | 3.140.34 | 2.970.46 |
| Date | JD (2,400,000+) | B | V | R | I |
|---|---|---|---|---|---|
| 29-07-2013 | 56503.54 | 16.950.02 | 15.410.02 | 14.480.02 | 13.450.02 |
| 29-08-2013 | 56534.56 | 17.070.02 | 15.530.02 | 14.620.02 | 13.580.04 |
| 20-08-2014 | 56890.57 | 16.970.02 | 15.490.02 | 14.610.02 | 13.640.03 |
| 14-09-2014 | 56915.49 | 16.970.02 | 15.480.01 | 14.580.02 | 13.560.03 |
| 22-07-2015 | 57226.56 | 16.990.02 | 15.370.01 | 14.370.01 | 13.240.01 |
| 18-11-2015 | 57345.41 | 16.880.02 | 15.240.01 | 14.220.02 | 13.110.02 |
| 08-09-2016 | 57640.54 | 16.730.09 | 15.000.08 | 13.910.09 | 12.780.09 |
| 06-10-2016 | 57668.51 | 16.550.01 | 14.840.01 | 13.760.01 | 12.600.01 |
| 03-11-2016 | 57696.49 | 16.610.02 | 14.880.02 | 13.790.02 | 12.620.02 |
| 25-06-2017 | 57930.58 | 16.350.03 | 14.590.03 | 13.470.06 | 12.320.07 |
| 11-07-2017 | 57946.54 | 16.370.02 | 14.630.02 | 13.570.02 | 12.440.03 |
| 28-08-2017 | 57994.47 | 16.770.02 | 15.150.02 | 14.120.02 | 13.020.03 |
2 Observations
All observations reported in this work were obtained using the 1.3 m telescope at the Skinakas observatory (Crete, Greece). We regularly monitor the optical continuum (, , , Jonhson-Cousins bands) and the H line of 4U 0115+63 with this telescope since 1999 and the polarization parameters in the band since 2013. Here we focus on the observations at the time of the October 2015 and July 2017 X-ray outbursts.
2.1 Polarimetry
Polarimetric observations were made with the RoboPol polarimeter (King et al. 2014). In the polarimetry configuration, we used a 20482048 ANDOR CCD with a 13.5 m pixel size. This configuration gives a plate scale of 0.43 /pixel. RoboPol is an imaging photopolarimeter that uses a combination of half-wave plates and Wollaston prisms with differing fast axis and prism orientations. The net result is that every point in the sky is projected to four points on the CCD. The photon counts in each spot, measured using aperture photometry, are used to calculate the and parameters of linear polarization. The absence of moving parts allows RoboPol to compute these parameters in one shot. RoboPol was designed to measure the polarization parameters of point sources. The optimization of the instrument sensitivity for a point source is achieved by using a mask in the telescope focal plane. Because the mask prevents unwanted photons from the nearby sky and sources from overlapping with the central target spots, the sky background level surrounding the central target spots is reduced by a factor of four compared to the field sources. The uncertainties of the Stokes parameters and the polarization degree and angle were determined following the prescription given in King et al. (2014). We also observe a number of zero-polarized standards during each run that were used to derive the instrumental polarization, which amounts to %, %, and %.
Because the band is the most frequently used, the correction for the instrumental polarization in this band is performed in two stages. The details of the methodology can be found in King et al. (2014); we briefly describe it here: the first stage involves measuring the zero-polarized standards in hundreds of different locations within the instrument field of view (FoV) several times per year, and then fitting their Stokes parameters to find the variation along the CCD chip. This model allows to correct for the global pattern of instrumental polarization within the 13’ FoV. However, in each position on the CCD, the model correction can be systematically off its true value by %. Therefore, in order to correct for this systematic and small shift for sources observed in the mask, we additionally measure zero-polarized standard stars in the mask.
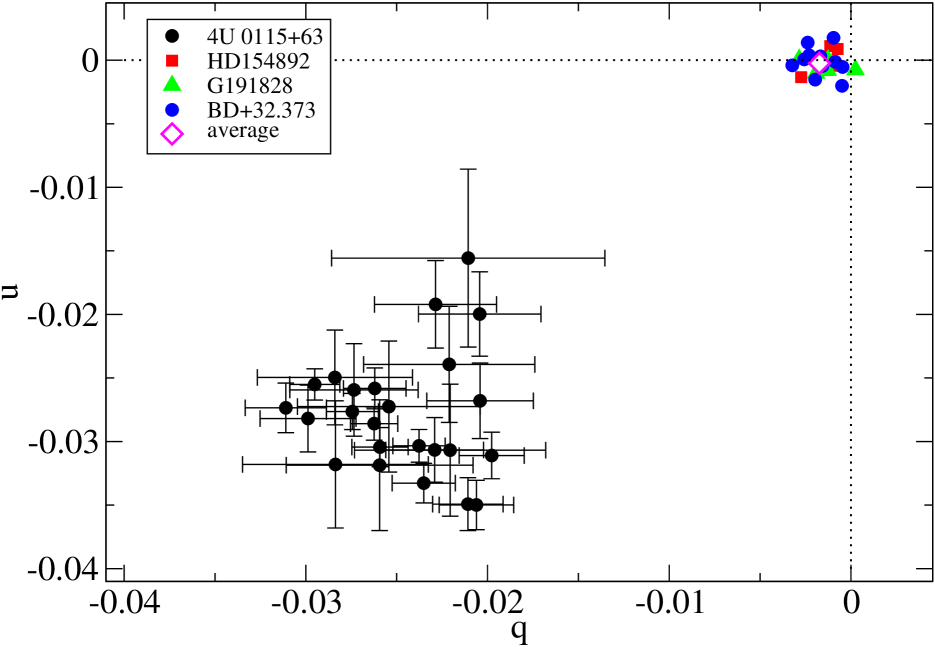
Figure 1 compares the polarization parameters of the source and three zero-polarized standard stars. The remaining instrumental polarization after the model correction is very small compared to the 4U 0115+63 polarization. The magenta empty diamond point in Fig. 1 represents the weighted average (, ) for the three standards. Overall, we estimate the amount of instrumental polarization in the band to be %.
The results of the polarimetric observations, corrected for instrumental polarization, are given in Table 1 for the band. In addition, we also observed 4U 0115+63 through , , and bands on several occasions (Table 2).
| Date | JD (2,400,000+) | EW(H) |
|---|---|---|
| () | ||
| 07-07-2015 | 57211.48 | |
| 15-09-2015 | 57281.46 | |
| 06-09-2016 | 57638.51 | |
| 04-10-2016 | 57666.49 | |
| 12-07-2017 | 57947.50 | |
| 13-07-2017 | 57948.53 | |
| 29-08-2017 | 57995.42 | |
| 07-09-2017 | 58004.44 | |
| 13-10-2017 | 58040.32 | |
| 22-11-2017 | 58080.20 |

2.2 Spectroscopy
Spectroscopic observations were made with a 2000800 15 m pixel ISA SITe CCD and a 1302 l mm-1 grating, giving a nominal dispersion of 1 Å/pixel until 2016. In 2017, the CCD was replaced by a 20482048 13.5 m pixel ANDOR IKON with a dispersion of 0.9 Å/pixel. Spectra of comparison lamps were taken before and after each exposure to account for small variations of the wavelength calibration during the exposure. To ensure homogeneous processing of the spectra, they were normalized with respect to the local continuum, which was rectified to unity by employing a spline fit. The error in the H equivalent width represents the standard deviation of ten measurements. Each measurement corresponds to a different definition of the continuum. The results of the spectroscopic observations are summarized in Table 4.
2.3 Photometry
For the photometric observations the telescope was equipped with a 20482048 ANDOR CCD with a 13.5 m pixel size, giving a scale of 0.28 /pixel. Standard stars from the Landolt list (Landolt 2009) were used for the transformation equations. Reduction of the data was carried out in the standard way using the IRAF tools for aperture photometry. We calculated the error of the photometry for each night as the standard deviation of the difference between the observed calibrated magnitudes of the standard stars and the magnitudes of the catalogue. The results of the photometric observations are given in Table 3.

 |
 |
 |
3 Results
Figure 2 shows the evolution of the H line equivalent width (EW(H)), the -band magnitude, the polarization degree and angle (in the band), and the X-ray intensity in the interval 2013-2017. During the period 2014-2016 the source optical emission experienced a smooth increase both in the continuum and line components. The source brightened by 1 mag and the EW(H) increased from 0 to Å. The degree of polarization initially increased by 1%, but it remained rather stable for most of the time. The optical parameters did not seem to be affected by the 2015 major X-ray outburst. However, large changes in all quantities occurred after the 2017 outburst. After the 2017 outburst, the polarization degree returned to the initial value of 3% (not corrected for interstellar polarization), the polarization angle returned to pre-outburst values after first increasing and then decreasing by , and the EW(H) and the optical continuum suffered a fast drop.
The shape of the H line also experienced large changes as shown in Fig. 3. The 2017 X-ray outburst began on MJD 57960. The spectrum taken two weeks before, on 13 July 2017 (MJD 57948), exhibits a single-peak profile and the EW(H) is the largest measured in the past five years. The maximum X-ray flux was observed on MJD 57970. The spectrum on 29 August 2017 (MJD 57995) shows an asymmetric profile. By 7 September 2017 the asymmetry had grown and a red-dominated double-peak line was apparent. The X-ray flux returned to pre-outburst values on MJD 57996. The H line profile of the spectrum taken on 13 October 2017 (MJD 58040) and 22 November 2017 (MJD 58080) has the shape of a shell line.
The polarization measurements presented in Tables 1 and 2 and in Fig. 2 are corrected for instrumental polarization but they are not corrected for the contribution from the interstellar medium (ISM). Estimating this contribution is not easy. 4U 0115+63 is located in the Galactic plane (galactic latitude ) at a large distance, kpc (Negueruela et al. 2001; Reig & Fabregat 2015). Hence the number of molecular clouds that lie between us and the source and how each one of them affects the polarization properties is unknown. The good news is that the polarization introduced by the ISM does not affect the results and conclusions of this work. The reason is that the interstellar component of the polarization for a given direction in the sky is constant with time at the time scales considered in this work. Therefore the variability observed in 2017 indicates that the polarization changes are intrinsic to the source.
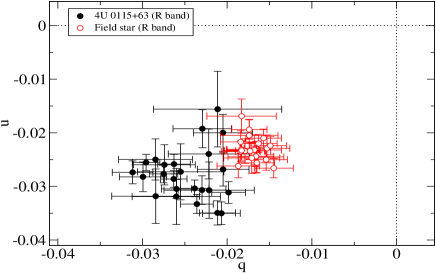
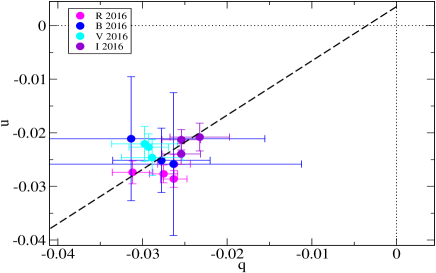
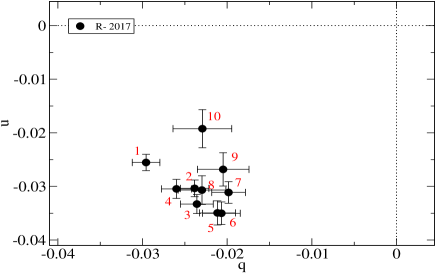
Further evidence that some fraction of the measured polarization is intrinsic to the source can be obtained from the normalized Stokes parameter plane, the so-called diagram, shown in Fig. 4. The top panel of this figure shows the Stokes parameters of the source and a field star. The smaller scatter of the field star observations supports the idea that the 4U 0115+63 is variable. The middle and bottom panels of Fig. 4 show the and measurements of 4U 0115+63 at two different epochs: during an X-ray quiet state (2016 observations) and during to the 2017 giant outburst. Because a star that is variable in degree but constant in position angle would move along a line in this plot, any elongation of the distribution of data points along a general direction in this diagram is good evidence for intrinsic polarization (Clarke & McGale 1987; McDavid 1999). The dashed line in Fig. 4 (middle panel) is the best fit to the data points. The angle between this line and the axis defines a preferred direction associated with the star, which gives a good approximation to the polarization angle of the intrinsic polarization. The fact that the line does not pass through the origin (, ) indicates that there is an intrinsic component. On the other hand, the fact that the distance from the origin to the line is very short indicates that it is difficult to disentangle the interstellar component from the intrinsic one because their position angles are nearly the same. In contrast, the diagram of the 2017 observations deviates from a straight line; instead, it makes a loop in which the source moves counter-clockwise. This shape clearly indicates that not only the degree of polarization but also the polarization angle changed.
4 Discussion
In this section we discuss the implications of the observations, with particular emphasis on the observations around the 2017 outburst and provide an interpretation of the dramatic changes that occurred during that event.
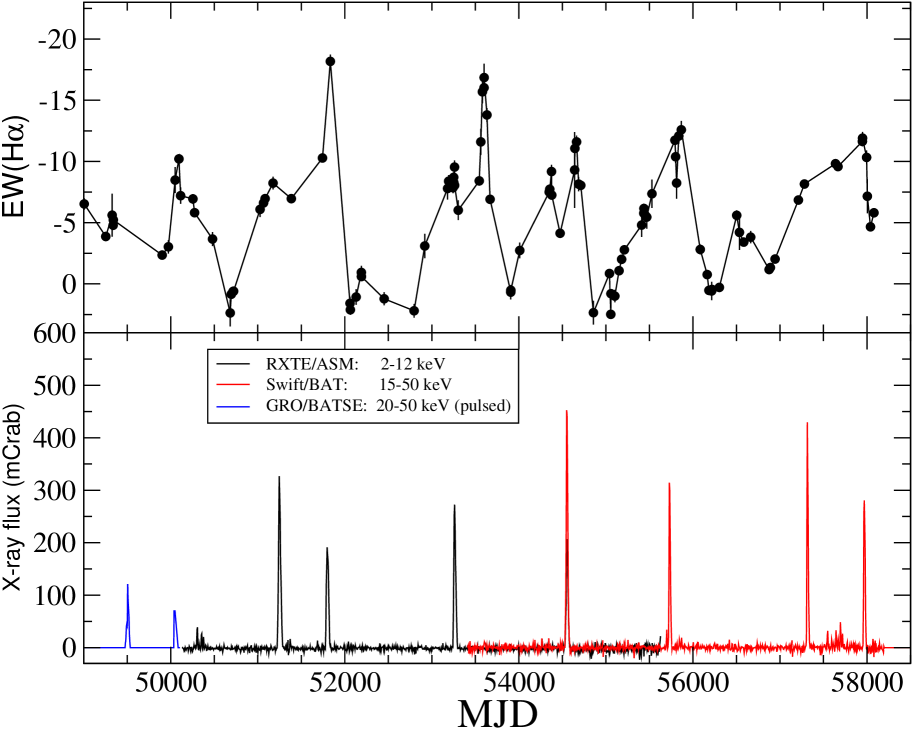
The data presented in this work show that the source follows the same pattern of variability described in Negueruela et al. (2001) and Reig et al. (2007), namely the quasi-periodic nature of the giant X-ray outbursts and the cyclic line profile variability observed in 4U 0115+63. The recurrence time of type II outbursts of about 3 years was already pointed out by Whitlock et al. (1989) and confirmed by subsequent studies (Negueruela et al. 2001). Reig et al. (2007) realised that sometimes the three-year cycle is broken by the presence of two more closely separated (1–1.5 years) outbursts. When this occurs, the EW(H) prior to the start of the second outburst is always larger than that of the first. Likewise, the peak X-ray flux of the second outburst of the pair is lower. The optical parameters do not significantly change after the first outburst. In contrast, after the second outburst, the disk suffers large structural changes that lead to its complete dissipation. This is illustrated in Fig. 5111We note that given the different energy ranges and characteristics of the instrument a comparison of the intensity of the outbursts is only meaningful for the same instrument., which shows long-term correlated optical and X-ray behavior of the system.
The period spanned by our observations includes two outbursts, one in October 2015 and another in August 2017. Unfortunately, the coverage of the 2015 outburst was very poor. With only two data points it is difficult to draw any firm conclusions. However, although there might be an observational bias, the absence of large changes during this outburst agrees very well with what is observed in previous events. As can be seen in Fig. 5, the EW(H) remained fairly unaltered after the 1994 (MJD 49500) and the 1998 (MJD 51260) outbursts. Similarly neither the line (EW(H)) nor the continuum emission ( mag) were greatly affected after the 2015 (MJD 57320) outburst (Fig. 2). In contrast, Figs. 3 and 6 show the dramatic changes that occurred in the Be disk at the time of the 2017 giant outburst.
Figure 3 displays some characteristic profiles of the H immediately before, during, and after the 2017 outburst. The line profile changed from a strong single-peak symmetric profile immediately before the onset of the outburst to a highly asymmetric profile during the outburst and a shell-like profile once the X-ray activity had ceased. Be stars exhibit a wealth of line profiles. Generally they fall in two categories, symmetric and asymmetric profiles (Hummel 1994; Hummel & Vrancken 1995; Hanuschik 1996; Hummel & Hanuschik 1997; Silaj et al. 2010). Symmetric profiles are generated in stable Keplerian disk configurations. Asymmetric profiles are believed to arise from distorted disks. Symmetric profiles include single-peak, double-peak, wine-bottle (single or double peak profiles that show inflections of the shoulders of the line), and shell lines (double-peak line with the central depression below the stellar continuum). Double-peak lines arise at intermediate inclination angles and result from Doppler shifts of the particles moving in the disk. Single-peak and wine-bottle lines occur when the observer sees the disk at low inclination angle or when the disk is large enough (the peak separation decreases as the disk radius increases) that the spectral resolution cannot separate the line into two peaks. Shell lines are thought to occur in edge-on systems with the central intensity resulting from partial absorption of the central star by the disk (Hanuschik 1995; Rivinius et al. 2006; Silaj et al. 2014). Asymmetric lines are characterized by double-peak profiles in which one of the peaks is stronger than the other. The relative intensity of the two peaks may change over time giving rise to the so-called V/R variability, which is believed to be caused by density perturbations in the disk (Telting et al. 1994).
Because the spin axis of the Be star cannot change on timescales of days, the appearance of different profiles in the same star can only imply that the disk axis is changing direction. Indeed the changes in the emission line profile in Be and BeXBs have been interpreted as observational evidence for misaligned disks that become warped in their outer parts (Hummel 1998; Negueruela et al. 2001; Reig et al. 2007; Moritani et al. 2011, 2013).
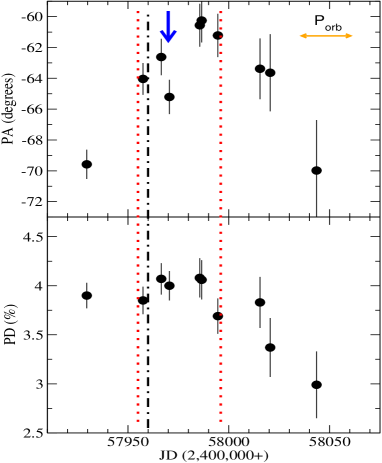
Figure 6 shows a detailed view of the polarization degree and polarization angle during the 2017 outburst. The dotted red lines mark the beginning and end of the outburst, while the dashed-dotted black line corresponds to periastron (Raichur & Paul 2010). The peak of the outburst as seen by Swift/BAT is shown by the blue arrow. The polarization degree decreased by 1% after the outburst. The polarization angle first increased by and then decreased by the same amount. The larger changes occurred before and after the X-ray outburst. In Thomson scattering, the polarization angle of the resulting polarized light is perpendicular to the scattering plane (the plane containing the incident and scattered radiation). Since the photons that get scattered come from the Be star and the scattering medium is the disk, the polarization angle is expected to be perpendicular to the major elongation axis. This result has been confirmed by interferometric observations (Quirrenbach et al. 1997). Therefore we conclude that the observed variation of the polarization angle is related to changes in the orientation of the disk.
This is the first time that such a rapid change in polarization parameters is reported for a BeXB. The position angle measured by polarization has not been reported to vary in isolated Be stars either, but some exceptions are known, the most notable being that of the Be star Pleione (Hirata 2007). The polarization angle of this star changed from to in the interval 1974–2003. This change was interpreted in terms of the precession of the disk as anticipated by Hummel (1998).
Regarding BeXB, the only system for which a detailed polarimetric study has been performed is X-Per (Kunjaya & Hirata 1995; Roche et al. 1997). The data covered a declining phase in the evolution of the disk, and the subsequent recovery. The polarization degree correlated well with other optical parameters such as the V magnitude and the EW(H). During the disk-loss episode, all three parameters reached a minimum value.
The type of variation that we report here for 4U 0115+63 is rather different from these two cases. First, the timescales are remarkably faster in 4U 0115+63. The precession period in Pleione was estimated to be 81 years. The variability observed in polarization in X-per occurred over several years, in agreement with the viscous timescales expected in a decretion disk when it goes through a dissipation/formation phase. In 4U 0115+63, the polarization angle changed by in less than two months. Second, during the declining phase, X-Per moved from the lower-right part to the upper-left part in the Stokes normalized plane, and followed the same trace but in opposite direction during the reformation phase. This means that X-Per followed a straight line (Kunjaya & Hirata 1995; Roche et al. 1997), indicating that the polarization angle did not change significantly. As shown in Fig. 4, the pattern traced by 4U 0115+63 in the normalized Stokes parameter plane is curved, indicating changes both in polarization degree and angle. Unlike 4U 0115+63, X-Per does not show type II outbursts, but occasional small-amplitude and slow increases in X-rays. Hence we conclude that type II outbursts appear as violent events that lead to dramatic changes in the disk.
Figure 6 conveys another very interesting result. The first data point shown in this figure was taken approximately one orbital period ( days) before the onset of the outburst (left red dotted line), which in turn, roughly coincides with the time at which the neutron star crossed periastron (dashed-dotted black line), according to the ephemeris of Raichur & Paul (2010). Although we cannot be sure of when the disk began to warp due to the lack of observations prior to the X-ray outburst, the fact that the polarization angle of the first 2017 observation is consistent with the long-term average () suggests that the disk then still presented a stable configuration. However, soon after (one orbital period before the start of the outburst), the tidal torque exerted by the neutron star perturbed the disk, which began to warp. This event changed the orientation of the disk and gave rise to the observed changes in the polarization angle. In the next passage, the neutron star moved across the warped (outer) part of the disk resulting in enhanced mass accretion and the X-ray emission. The disk axis began to precess, completing an entire cycle in days. This is a relatively very short timescale, but is consistent with the relatively small variation in the polarization angle. Based on spectroscopic observations, Moritani et al. (2013) estimated the precession of a warped disk in the BeXB 1A 0535+262 to be several hundred days. A detailed spectroscopic and polarimetric monitoring of this source and other BeXBs during future giant outbursts will clarify whether our interpretation is correct and will allow for more accurate estimations of the timescales associated with disk warping in BeXBs.
5 Conclusion
We report for the first time changes in the optical polarization parameters during a giant X-ray outburst in the BeXB 4U 0115+63. Most notably, the polarization angle, and the profile of the H line, and therefore the orientation of the Be disk, changed on timescales comparable to the orbital period. We interpret this variability as evidence for a warped disk, supporting models that predict highly perturbed disks as the origin of type II outbursts in BeXB.
Acknowledgements.
Skinakas Observatory is run by the University of Crete and the Foundation for Research and Technology-Hellas.References
- Clarke & McGale (1987) Clarke, D. & McGale, P. A. 1987, A&A, 178, 294
- Fu et al. (2015) Fu, W., Lubow, S. H., & Martin, R. G. 2015, ApJ, 807, 75
- Halonen et al. (2013) Halonen, R. J., Mackay, F. E., & Jones, C. E. 2013, ApJS, 204, 11
- Hanuschik (1995) Hanuschik, R. W. 1995, A&A, 295, 423
- Hanuschik (1996) Hanuschik, R. W. 1996, A&A, 308, 170
- Haubois et al. (2014) Haubois, X., Mota, B. C., Carciofi, A. C., et al. 2014, ApJ, 785, 12
- Hirata (2007) Hirata, R. 2007, in Astronomical Society of the Pacific Conference Series, Vol. 361, Active OB-Stars: Laboratories for Stellare and Circumstellar Physics, ed. A. T. Okazaki, S. P. Owocki, & S. Stefl, 267
- Hummel (1994) Hummel, W. 1994, A&A, 289, 458
- Hummel (1998) Hummel, W. 1998, A&A, 330, 243
- Hummel & Hanuschik (1997) Hummel, W. & Hanuschik, R. W. 1997, A&A, 320, 852
- Hummel & Vrancken (1995) Hummel, W. & Vrancken, M. 1995, A&A, 302, 751
- King et al. (2014) King, O. G., Blinov, D., Ramaprakash, A. N., et al. 2014, MNRAS, 442, 1706
- Kozai (1962) Kozai, Y. 1962, AJ, 67, 591
- Kunjaya & Hirata (1995) Kunjaya, C. & Hirata, R. 1995, PASJ, 47, 589
- Landolt (2009) Landolt, A. U. 2009, AJ, 137, 4186
- Lidov (1962) Lidov, M. L. 1962, Planet. Space Sci., 9, 719
- Martin et al. (2014a) Martin, R. G., Nixon, C., Armitage, P. J., Lubow, S. H., & Price, D. J. 2014a, ApJ, 790, L34
- Martin et al. (2014b) Martin, R. G., Nixon, C., Lubow, S. H., et al. 2014b, ApJ, 792, L33
- Martin et al. (2011) Martin, R. G., Pringle, J. E., Tout, C. A., & Lubow, S. H. 2011, MNRAS, 416, 2827
- McDavid (1999) McDavid, D. 1999, PASP, 111, 494
- Moritani et al. (2011) Moritani, Y., Nogami, D., Okazaki, A. T., et al. 2011, PASJ, 63, 25
- Moritani et al. (2013) Moritani, Y., Nogami, D., Okazaki, A. T., et al. 2013, PASJ, 65, 83
- Negueruela et al. (2001) Negueruela, I., Okazaki, A. T., Fabregat, J., et al. 2001, A&A, 369, 117
- Okazaki et al. (2013) Okazaki, A. T., Hayasaki, K., & Moritani, Y. 2013, PASJ, 65, 41
- Paul & Naik (2011) Paul, B. & Naik, S. 2011, Bulletin of the Astronomical Society of India, 39, 429
- Poeckert et al. (1979) Poeckert, R., Bastien, P., & Landstreet, J. D. 1979, AJ, 84, 812
- Quirrenbach et al. (1997) Quirrenbach, A., Bjorkman, K. S., Bjorkman, J. E., et al. 1997, ApJ, 479, 477
- Raichur & Paul (2010) Raichur, H. & Paul, B. 2010, MNRAS, 406, 2663
- Reig (2011) Reig, P. 2011, Ap&SS, 332, 1
- Reig & Coe (1999) Reig, P. & Coe, M. J. 1999, MNRAS, 302, 700
- Reig & Fabregat (2015) Reig, P. & Fabregat, J. 2015, A&A, 574, A33
- Reig et al. (2007) Reig, P., Larionov, V., Negueruela, I., Arkharov, A. A., & Kudryavtseva, N. A. 2007, A&A, 462, 1081
- Reig et al. (2016) Reig, P., Nersesian, A., Zezas, A., Gkouvelis, L., & Coe, M. J. 2016, A&A, 590, A122
- Rivinius et al. (2013) Rivinius, T., Carciofi, A. C., & Martayan, C. 2013, A&A Rev., 21, 69
- Rivinius et al. (2006) Rivinius, T., Štefl, S., & Baade, D. 2006, A&A, 459, 137
- Roche et al. (1997) Roche, P., Larionov, V., Tarasov, A. E., et al. 1997, A&A, 322, 139
- Silaj et al. (2014) Silaj, J., Jones, C. E., Sigut, T. A. A., & Tycner, C. 2014, ApJ, 795, 82
- Silaj et al. (2010) Silaj, J., Jones, C. E., Tycner, C., Sigut, T. A. A., & Smith, A. D. 2010, ApJS, 187, 228
- Telting et al. (1994) Telting, J. H., Heemskerk, M. H. M., Henrichs, H. F., & Savonije, G. J. 1994, A&A, 288, 558
- Whitlock et al. (1989) Whitlock, L., Roussel-Dupre, D., & Priedhorsky, W. 1989, ApJ, 338, 381
- Wood et al. (1996) Wood, K., Bjorkman, J. E., Whitney, B. A., & Code, A. D. 1996, ApJ, 461, 828
- Yudin (2001) Yudin, R. V. 2001, A&A, 368, 912
- Ziolkowski (2002) Ziolkowski, J. 2002, Mem. Soc. Astron. Italiana, 73, 1038