Power stabilization of a diode laser with an acousto-optic modulator
Abstract
Laser power fluctuations can significantly reduce the device performances in various applications. High frequency fluctuations impact the signal-to-noise ratio, while slow variations can reduce the device repeatability or accuracy. Here we report experimental investigations on the power stabilization of a diode laser with an acousto-optic modulator. In the frequency domain the relative power noise is reduced at the level of Hz-1/2 in the range 1-100 kHz. The slow variations are studied in the time domain. The relative Allan standard deviation is measured at the level of at 100 s averaging time. Above 100 s the instability increases and reaches at 10 000 s.
I Introduction
Stable laser powers are needed in a wide range of applications such as laser writing systems Kim:RSI:2007 , magnetometers (Duan:OE:2015, ), atomic clocks Lin:FCS:2014 ; Kozlova:TIM:2014 ; Abdel:JAP:2017 , spectroscopy Gehrtz:JOSAB:1985 ; DuBurk:MST:2004 ; Casa:JCP:2007 ; Moretti:PRL:2013 , laser frequency standards, interferometry and gravitational wave detection (Kwee:OE:2012, ; Junker:OL:2017, ), etc. High frequency fluctuations of laser power decreases the signal-to-noise ratio, degrading the short-term frequency stability of frequency standards Abdel:JAP:2017 , or can distort line-shapes in frequency modulation spectroscopy (DuBurk:MST:2004, ). Low frequency variations can degrade long-term stability of atomic clocks Kozlova:TIM:2014 ; Abdel:JAP:2017 . Various approaches can be employed to tackle this issue. Aside from passive isolation (Talvitie:RSI:1997, ), the optical power can be stabilized by a feedback on the diode current (at the expense of the frequency stability) or temperature Lee:RSI:1996 . Most often an external actuator is used for this purpose, like an electro-optic modulator (Ivanov:UFFC:2009, ; Liu:OLT:2013, ), a photo-elastic modulator (Duan:OE:2015, ), or an acousto-optic modulator (AOM) (Kim:RSI:2007, ; Casa:JCP:2007, ; Moretti:PRL:2013, ; Kwee:OE:2012, ; Junker:OL:2017, ; Tetchewo:FNL:2007, ; Lin:FCS:2014, ; Balakshy:OLT:2014, ). A great deal of work has been devoted for decades to the AC power stabilization of Nd:YAG lasers for gravitational wave detectors. A relative power noise (RPN) at the outstanding level of Hz-1/2 in the 100 Hz-1 kHz band has recently been demonstrated (Junker:OL:2017, ) with AOM. However these highly sophisticated devices are too complex for industrial applications or ordinary laboratories, and cannot be implemented in on-board devices such as compact atomic clocks which must be small and low-power. Although the laser-power stabilization by means of an AOM is well known and very common in many laboratories, surprisingly, it is very poorly documented in the literature. Particularly the slow power fluctuations and drifts are not addressed.
The aim of this paper is to fully describe and characterize a simple and efficient setup for on-board applications or ordinary laboratories, so that it could be used as a guideline. The limiting noise sources of the device and of the measurement are carefully addressed. The device performances are characterized in the frequency domain (power spectral density (PSD) in 1 Hz-10 MHz band) and in time domain (very slow frequencies, averaging times from 1 s to 10 000 s). They are investigated by means of the Allan standard deviation, which characterizes the power instability as a function of the averaging time. RPN and Allan deviation both allow an analysis of the limiting noise types, but in frequency domain and time domain, respectively. The link between noise power spectral density and Allan deviation, well known in time and frequency metrology (Rubiola:PN:2008, ), will be used to confirm the analysis.
In this paper we characterize the power stabilization of a diode laser based on a simple scheme using a single acousto-optic modulator (AOM). This is needed for a project of compact vapor-cell atomic clock based on coherent population trapping. Vapor cell atomic clocks based on coherent population trapping (CPT) Arimondo:1996 ; Kitching:TIM:2000 ; Merimaa:JOSAB:2003 ; Vanier:APB:2005 are promising devices for their potential compact size ShahKitching:2010 or their high performances Danet:UFFC:2014 ; Abdel:JAP:2015 ; Yun:PRAp:2017 ; Abdel:JAP:2017 . In such clocks there is no microwave cavity unlike well-known Rb vapor cell clocks Vanier:TIM:2003 , the microwave signal is optically carried by a bi-frequency laser beam. The CPT clock resonance occurs when the frequency difference between both optical frequencies is equal to the microwave clock frequency. The resonance is detected by recording the optical power of the light transmitted through the vapor cell. The counterpart of this all-optical interrogation and detection is the high sensitivity to the laser power. The signal amplitude and the clock frequency are both power sensitive.
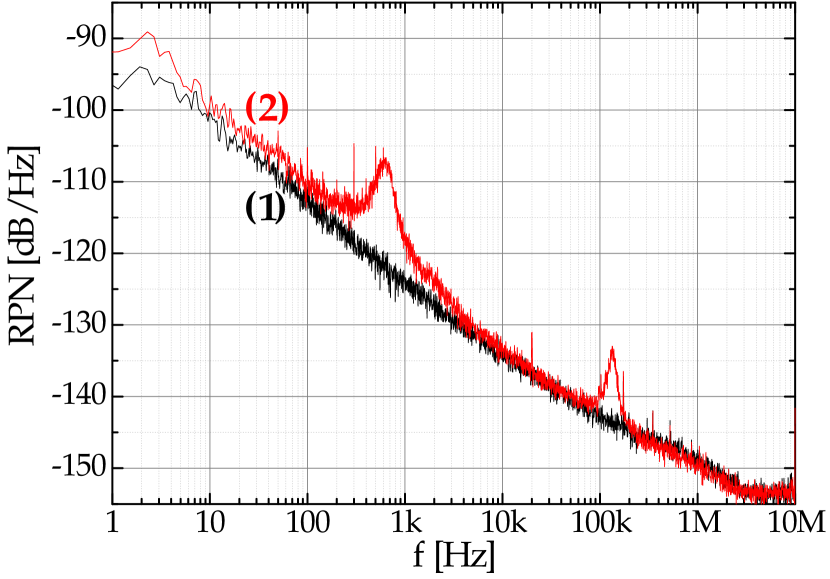
In our setup the two frequencies are produced by two home-made extended-cavity diode lasers (ECDL) Baillard:2006 . One laser is frequency stabilized by saturated absorption spectroscopy on the Cs D1 line at 895 nm. The slow frequency corrections are applied on a piezoelectric transducer (PZT) controlling the cavity length, while fast corrections are applied on the diode driving current. Such actions, cavity-length and current variations, in turn modify the output power and alter the power stability. The PSD of the relative power noise (RPN, also called RIN in the literature) of a diode laser is shown in Fig. 1. As expected the noise spectrum of the free-running laser is dominated by flicker noise. The laser frequency locking adds two supplementary noise peaks on the spectrum, related to the PZT and diode current at low and high frequency, respectively.
Since the laser power fluctuations are one of the main sources of frequency instability in our clock, we implemented a simple low noise power lock for each laser based on AOMs. Fast fluctuations affect the short-term frequency instability, and are characterized by the RPN. Slow power variations are one of the major source of instability at midterm averaging times. They are investigated by means of the Allan standard deviation.
The paper is organized as follows. We first describe the experimental set-up controlling the laser power and the servo electronic circuit. The results on the RPN reduction, in loop and out-of-loop, are then presented. The last part is devoted to the analysis and reduction of the slow power fluctuations.
II Power servo
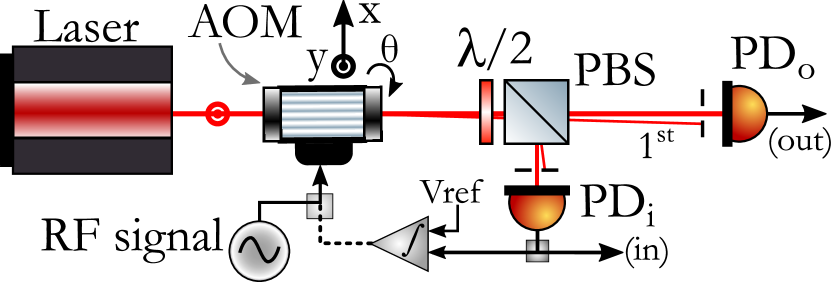
A schematic of the setup used for power locking is shown in Fig. 2. The laser beam passes through an AOM (Crystal Technology 3080) in the Bragg configuration. The AOM position is set to optimize the first-order diffraction beam thanks to a xy dual-axis translation stage and a rotation mount (Fig. 2). The first-order beam is blocked further away. Usually, a part of the zero-order beam is picked up by using a beamsplitter of split ratio 10/90 or 30/70. For this experiment, the beamsplitter is replaced by an half-wave plate and a polarizing cube (PBS) to get a variable split ratio. The transmitted beam is the useful beam, its power is monitored by a photodiode PDo (out-of-loop signal), the reflected beam power () is detected by an identical photodiode PDi (Thorlabs-PDA36A), yielding the in-loop signal. The optical bench is enclosed in a box whose temperature stability is of several tens of mK.
The in-loop signal is compared to a reference voltage issued from a low noise and low drift precision voltage reference (Linear Technology, LT1021-10V). The error signal, difference between the photodiode signal and the reference, is integrated through a proportional-integrator controller (PI). The correction is applied on an attenuator (Mini-Circuit, TFAS-2+) controlling the power level of the 80 MHz radio-frequency (RF) signal driving the AOM, i.e. the servo controls the power balance between AOM diffraction orders. The control efficiency is characterized in the frequency domain by the noise PSD. For Fourier frequency above 1 Hz the noise spectra of the various signals are recorded by a fast-Fourier-transform analyzer (FFT, Agilent-89410A). In the time domain, for averaging time above 1 s, the slow variations are characterized by the Allan standard deviation. A data acquisition unit (Agilent 34970) is used for time measurements of the laser power.
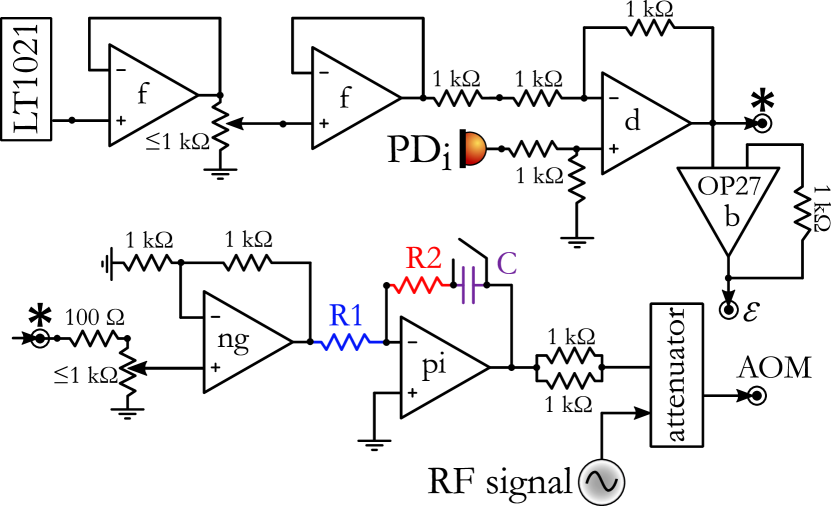
The electronic diagram is shown in Fig. 3. Low-noise and wide-band operational amplifiers (OP) MAX9632 are used, except for the buffer amplifier (b). Two unity gain buffer amplifiers (f) isolate possible noise returns which would degrade the characteristics of the voltage reference. In addition, the second OP (f) is used to adjust the voltage reference at the desired level. This adjustment is made by monitoring the error signal available with the OP27 buffer (b). After a non-inverting gain amplifier (ng), the error signal is processed by a PI controller with a bandwidth of about 700 kHz. The optimal parameters to reduce the RPN laser close to the relative voltage reference are founded to be R1 = 5 kΩ, R2 = 1 kΩ and C = 220 pF.
III Relative power noise
III.1 In-loop power value
The laser power used in the servo loop must be high enough so that photodiode noise and shot noise are negligible. However, in our set-up the total power available at the output of the AOM is low, only about 7 mW. As the value increases, the out-of-loop power decreases, so that its shot-noise increases in relative value.In this way the value of minimizing the in-loop noise, is not the value minimizing the out-of-loop noise floor. With the half-wave plate and the PBS we experimented different values of to reach the lowest out-of-loop RPN floor. The experimental results are shown in Fig. 4. The out-of-loop RPN noise floor value is taken at 4 kHz Fourier frequency from the RPN measurements presented in the inset. The experimental data (squares) are in fairly good agreement with a simple estimation (solid line) given by , with the voltage-reference noise PSD in relative unit, and the relative shot-noise PSDs of the in-loop and out-of-loop signals, respectively. and are the noise PSDs of the photodiodes PDi and PDo measured in the dark and divided by the squared mean signal value.
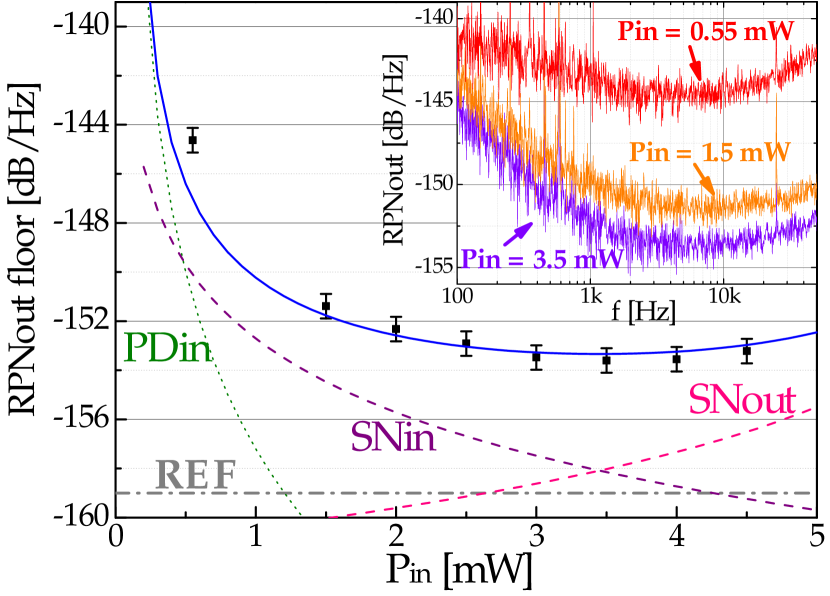
At low values, the power lock cannot efficiently filter the laser noise because the in-loop noise is dominated by the photodiode noise. When is increased above 4 mW, in order to reduce the in-loop photodiode noise contribution, the out-of-loop power is decreased. Therefore the out-of-loop RPN floor value is dominated by the shot-noise of the out-of-loop signal. In the following, mW, this value is a good trade-off to avoid the contribution of the in-loop detection noise and to keep enough power laser for the useful beam.
III.2 In-and out-of-loop results
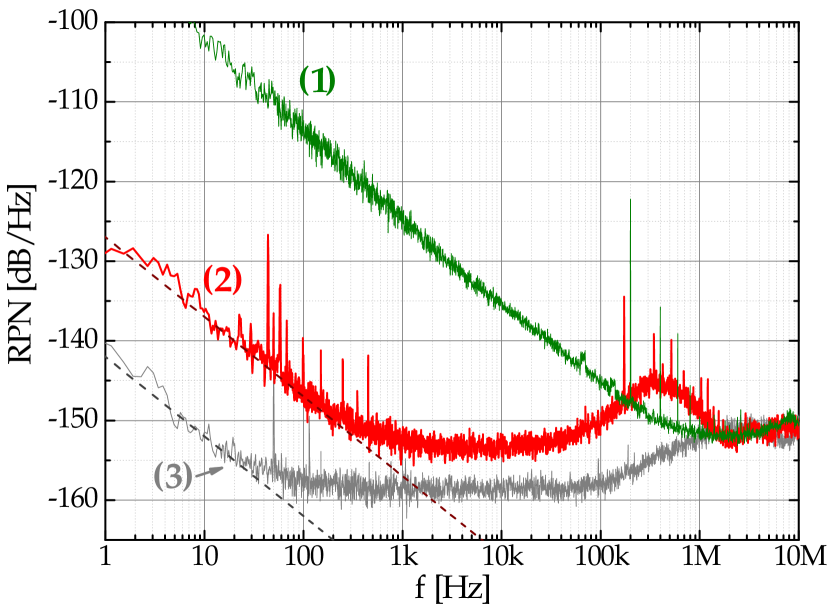
The in-loop measurement of the RPN PSD is shown in Fig. 5, together with the noise PSDs of the voltage reference and of the photodiode. The voltage reference noise is measured after the differential amplifier (d) (Fig. 3). For purposes of comparison all PSD are normalized to the photodiode-signal mean value. When the servo-loop is closed, the RPN is reduced by 40 dB at 100 Hz Fourier frequency. From 200 Hz to 60 kHz the noise floor is close to the floor of the voltage reference at the level of dB/Hz. The bump visible on the RPN curve around 600 kHz Fourier frequency does not exceed dB/Hz. Above 2 MHz, the measurement is limited by the photodiode noise. This result shows that the servo loop can filter the laser-power noise in the loop at the level of the reference noise up to 100 kHz. The same result is obtained on both laser systems.
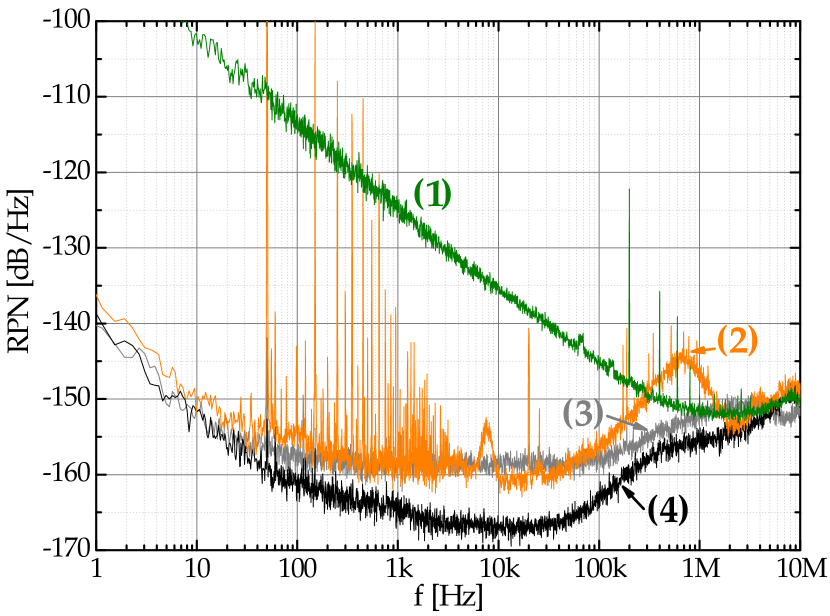
The out-of-loop RPN is shown in Fig. 6.
When the power servo-loop is locked the RPN level is about dB/Hz at 100 Hz Fourier frequency, a reduction of about 32 dB compared to the unlocked power case. The noise floor level from 1 kHz to 100 kHz is limited by the shot noise at the level of Hz-1/2. Then the bump servo loop is visible around 500 kHz Fourier frequency. The asymptotic behavior in of the flicker noise at low Fourier frequencies will help to understand the Allan deviation measurements in the next section. We recall (Rubiola:PN:2008, ) that a PSD of function () leads to an Allan deviation equals to (), respectively, where is the averaging time. For the voltage reference and for the out-of-loop RPN we get: ( dB) and ( dB), respectively.
This noise level leads to a reduction of the RPN contribution to the frequency instability of our CPT clock at the level of 2.5 at 1 s averaging time instead of 5 when laser powers are not stabilized.
IV Slow Power fluctuations
IV.1 Data acquisition characterization.
Before investigating the slow power fluctuations we checked the possible contributions of the voltage measuring instrument and of the voltage reference. We measured the low-frequency fluctuations of the voltage reference and of the laser power by using the data logger. As we needed to measure fractional laser-power fluctuations below at s integration time, we first characterized the data logger stability. This instrument has a typical resolution of about for a 10 V range. The result of a measurement of the null voltage of a short-circuit during more than 180 hours , is shown in inset of Fig. 7. The measured resolution is . The measurement stability is characterized by the Allan standard deviation (Fig. 7) which is here divided by 10 V for purposes of comparison with further power measurements in fractional units. The slope in , with the averaging time, is the feature of a white noise. The slope here is equal to , with .
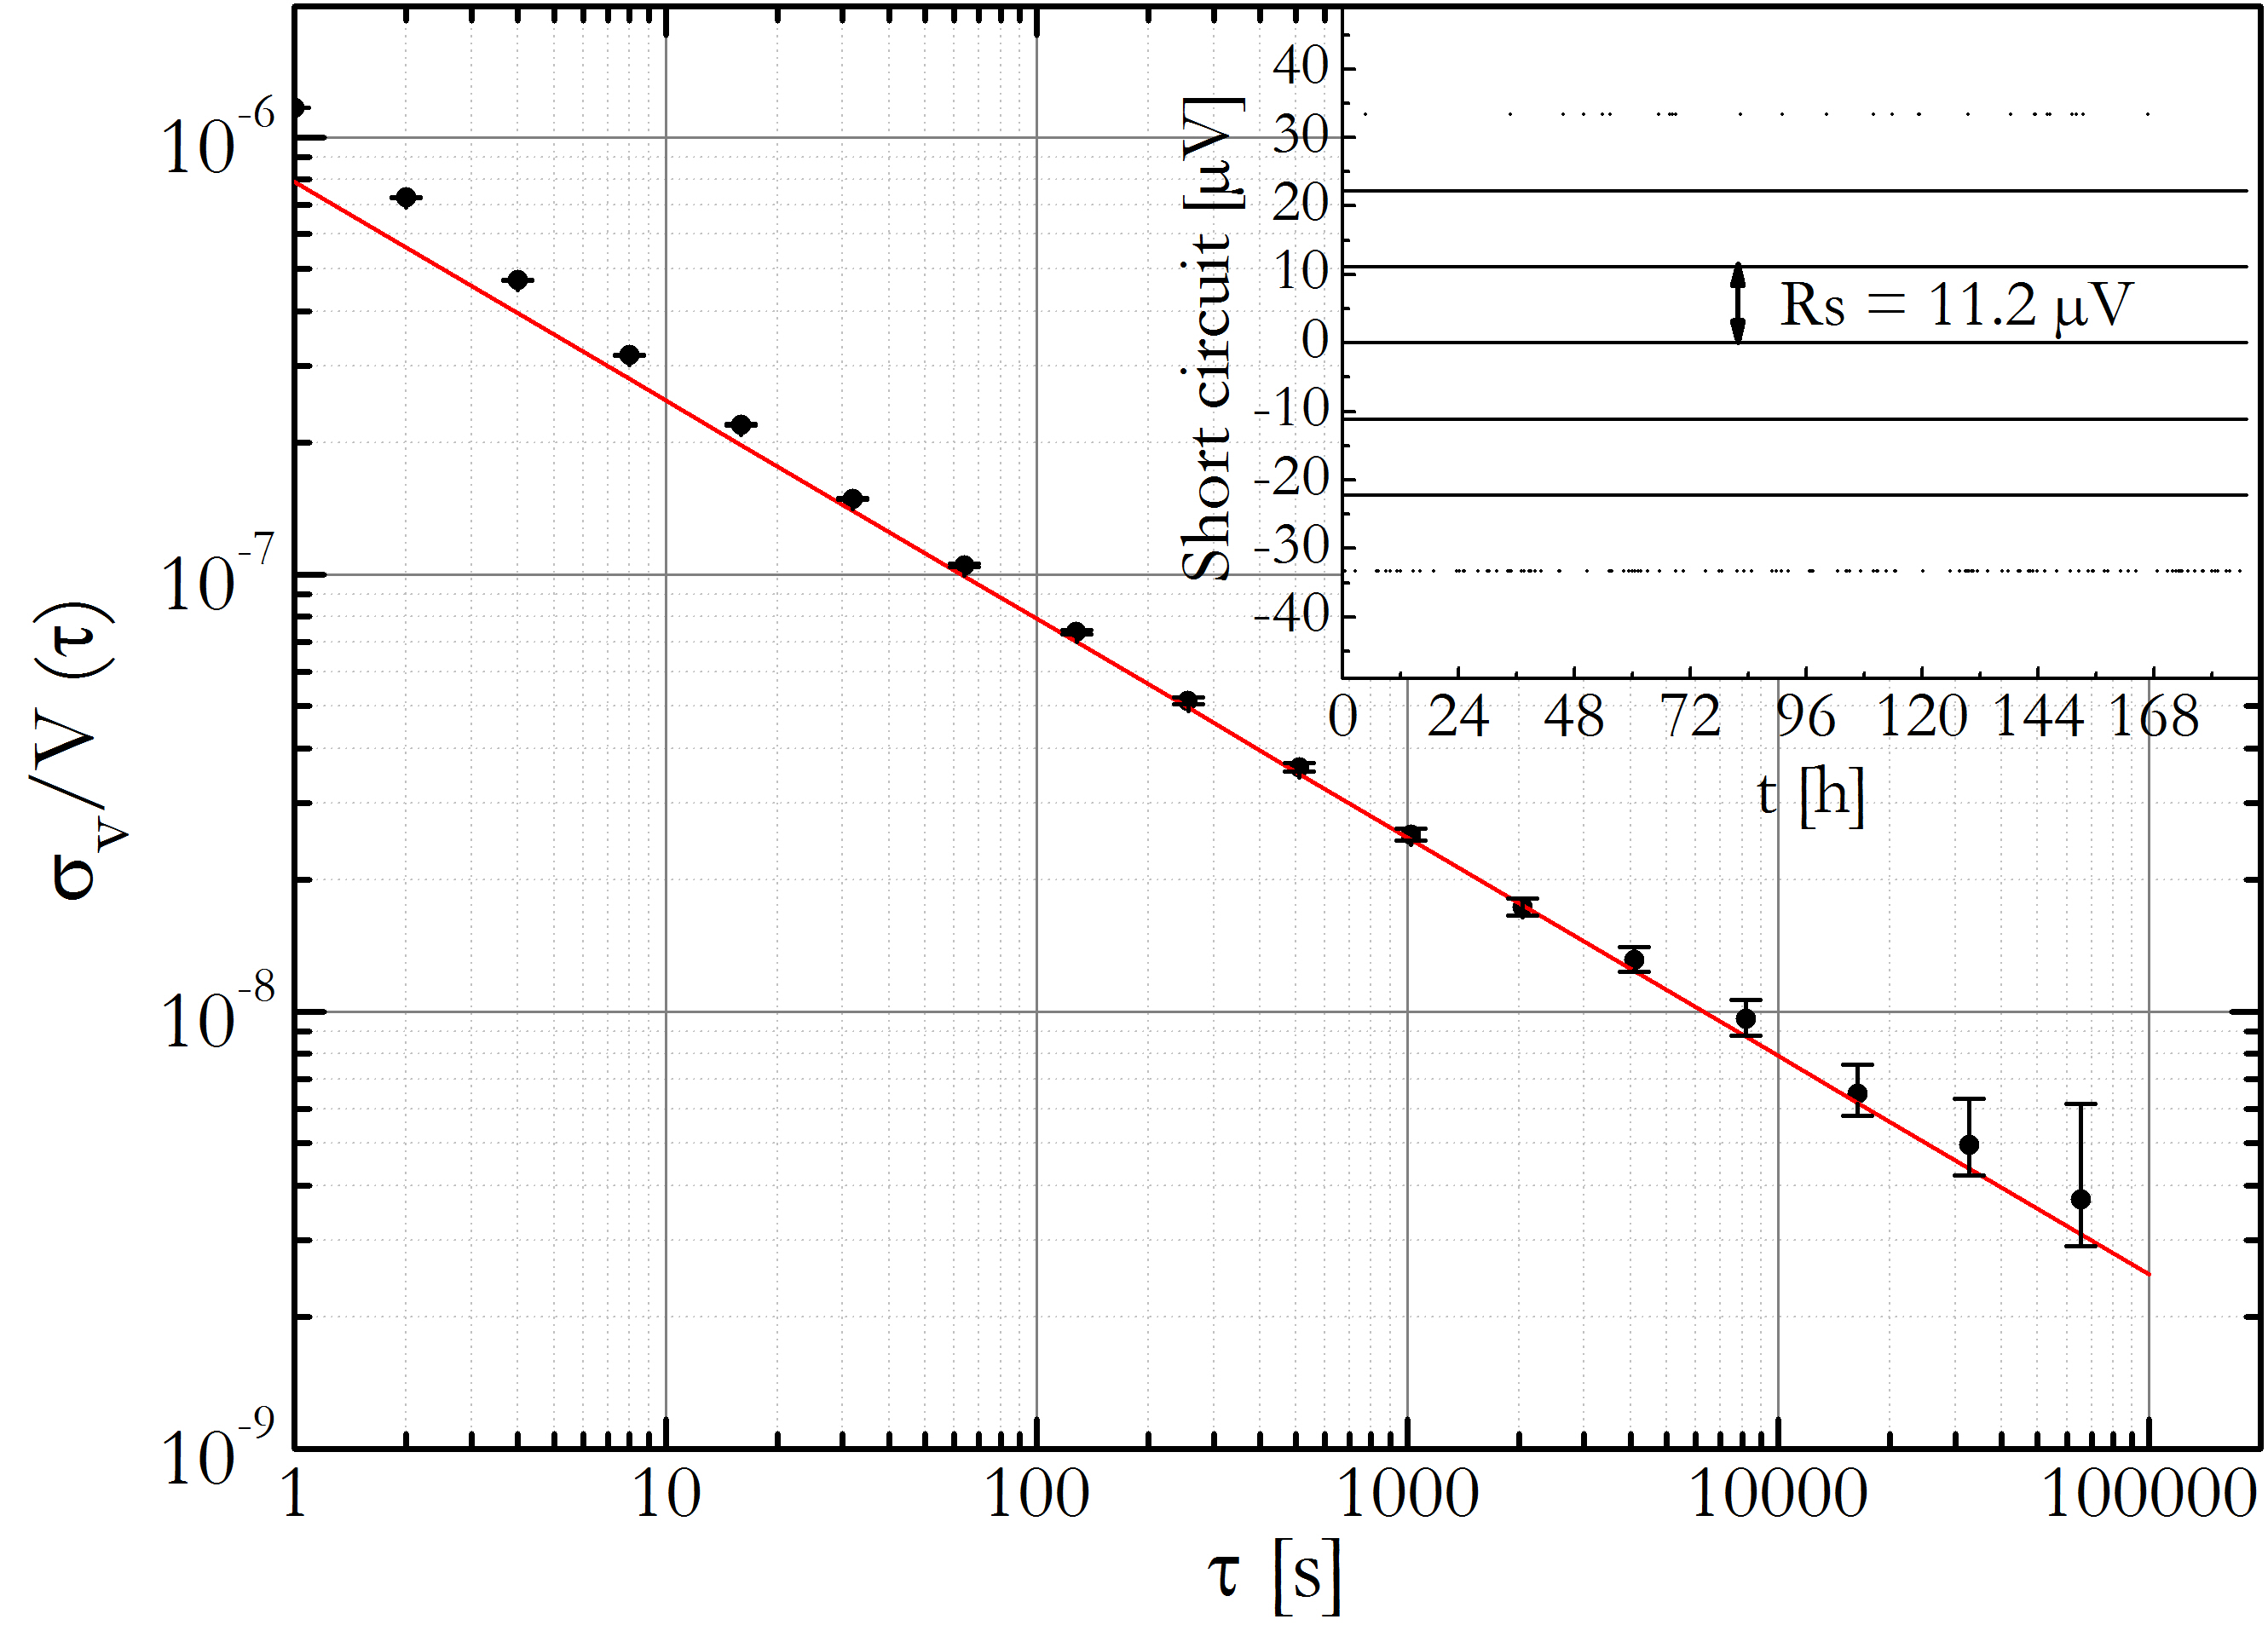
This result shows that the data logger can measure relative fluctuations below 1 at s averaging time.
IV.2 Voltage reference instability
We measured with the data logger the reference voltage at various points of the power lock circuit (see inset of Fig. 8), (1) at the output of the LT1021 reference, (2) at the output of the differential amplifier with the in-loop photodiode PDi in the dark. The measured relative Allan deviations are shown in Fig. 8 up to s averaging time. Note that the values are normalized to 10 V for curve (1), and 5 V for curve (2), which is the mean value in working conditions. The curve (2’) shows the measured instability with a previous version of the electronic board using common resistors (temperature sensitivity 5 ppm/K) instead of low temperature coefficient (Vishay) resistors (0.05 ppm/K).
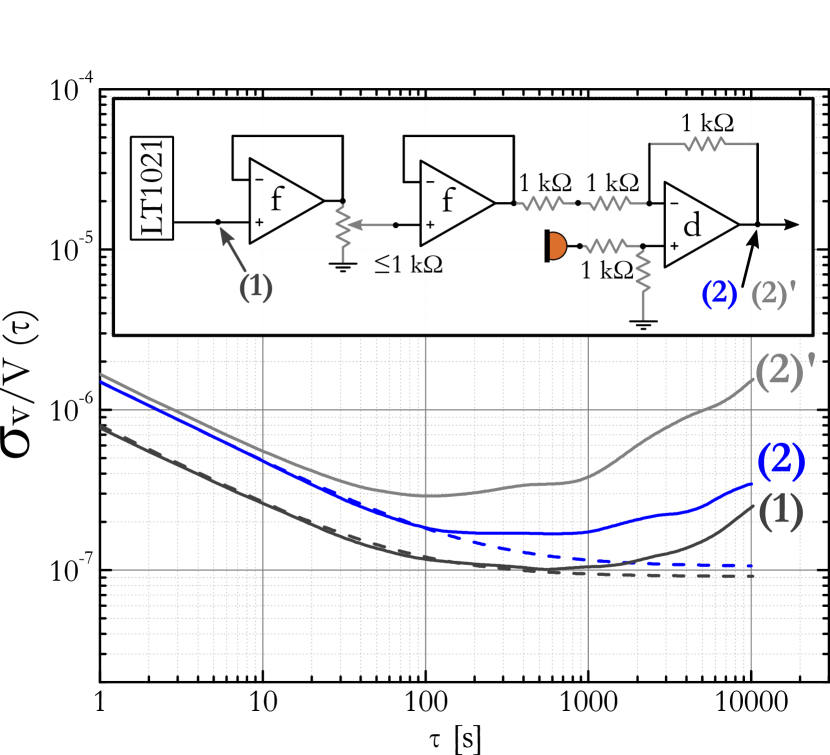
At short term ( s) the measurement of the LT1021 instability (curve (1)) is limited by the data logger noise. The LT1021 flicker noise (see Fig. 6) yields indeed a relative Allan deviation floor of about , well below the data logger deviation. The voltage reference floor is reached between 100 and s averaging times.
The instability begins to increase above s. The instability of the reference voltage measured after the differential amplifier (curve (2)) has the same behavior. The factor of 2 compared to curve (1) is due to the different dividing values (5 V and 10 V) for the same noise value. In the following the power instability will be compared to the minimum measurable instability given by .
IV.3 Laser Power instability
The measured laser-power instability of a single laser is shown in Fig. 9. When the power loop is closed, the instability (2) is one order of magnitude lower than for free-running regime (1). According to the flicker noise level in Fig. 6, at short averaging times the closed-loop instability should be . We cannot measure this level masked by the data logger instability. At 1 s averaging time the instability is closed to the expected value (5) computed by summing theoretical contributions of data logger and RPN. However, after 1 s, the instability increases and reaches 9 at s. The Allan deviation scales as , which is consistent with a linear drift.
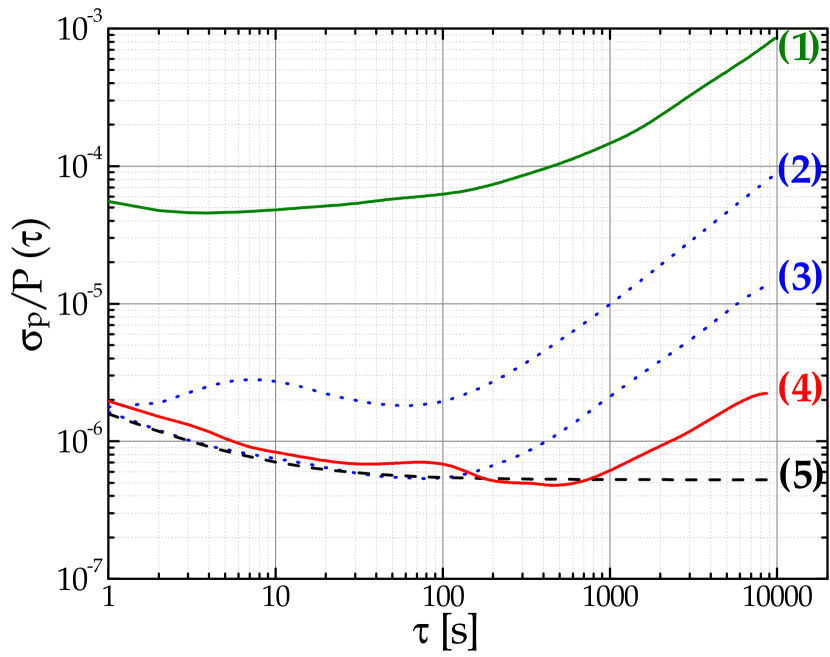
This drift cannot be explained by the voltage reference whose contribution is here negligible (see Fig. 8).
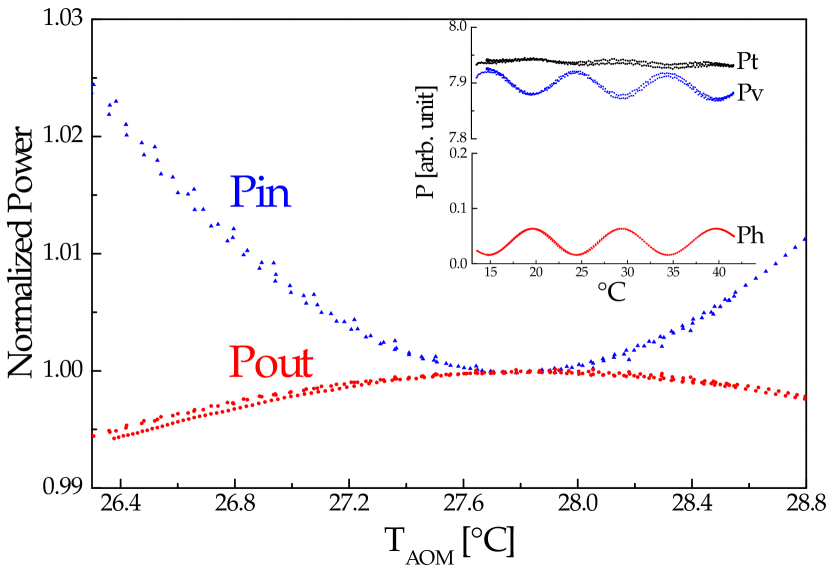
Actually, the power variations of are correlated to the temperature variations in the box enclosing the experimental set-up. We identified the AOM as one of the main temperature sensitive component (/K). The AOM crystal is a tellurium dioxide (TeO2 or paratellurite) crystal, known to be highly birefringent (Ohmachi:1970, ; Uchida:1976, ; Balakshy:1996, ). Then if the incident polarization is not perfectly linear and aligned on one crystal axis the output polarization will be rotated or its ellipticity will change, and this effect is temperature sensitive. To characterise it, we have recorded the powers and as a function of the AOM temperature, regulated by a thermo-electric cooler (TEC) placed under it. The inset in figure 10 shows the powers measured at the output of the PBS for the horizontal and the vertical polarizations. The beam at the input of the AOM is linearly and vertically polarized, and the half-wave plate in-front of the PBS is removed. The vertical polarization is the polarization recommended by the manufacturer for the best diffraction efficiency. A polarization modulation is clearly observed. Note that the same modulation is observed with the horizontal polarization with a smaller amplitude. Figure 10 shows the normalized in-and-out-loop powers around 28 in working conditions (the plate is in front of the PBS, and tilted for tuning the split ratio). () is the power of the vertically (horizontally) polarized output beam, respectively. It is clear that the AOM is sensitive to temperature variation, in such a way that the AOM crystal changes the polarization of the output laser beam before the PBS. Consequently, when the power loop is closed, a temperature variation leads to opposite variation of and . The servo regulates to a constant value by correcting the total power by means of the RF power driving the AOM, and so the lock increases the variation of .
An interesting point to be noticed is the AOM temperature sensitivity around 27.8 , which shows an inversion temperature (Fig. 10). To confirm this effect, we measured the power instability out of the loop while the AOM temperature is regulated at 27.8 by a proportional-integral-derivative (PID) controller. The result is shown in Fig. 9(3). We clearly see an improvement of the stability, now equal to the expected value (5) until 100 s. Between 100 and 10 000 s an improvement of a factor close to five is obtained. This result confirms the AOM temperature influence on the power instability. Nevertheless, a power drift is still visible above 500 s. The Allan deviation of the regulated AOM temperature is and at averaging times of 100 and s, respectively. These values lead to fractional out-of-loop power deviations of and . The remaining power drift is then not due to the AOM sensitivity. In order to overcome the birefringent effect in the AOM, we inserted a polarizer between the AOM and the half-wave plate, so that the polarization does not change at the input of the plate. This did not reduce the observed power drift. As a matter of fact, the residual thermal contribution is due to the use of the half-wave plate and the PBS, which was used to tune the beam part extracted for the servo-loop. Its sensitivity has been measured to be about /K. We have then replaced the plate-PBS set by an uncoated glass plate. As seen in section III.1 the in-loop power is no more optimized for PSD floor, but here the purpose is to check the impact on long term variations. The resulting relative power instability is shown in Fig. 9. An improvement of a factor six is obtained at s, at the level of 2.5 (Fig. 9(4)). The residual power drift measured from s to s is attributed to temperature sensitivity of both photodiodes ( 2/K). Note that the beam pointing stability after an AOM is also sensitive to the RF power (Frohlich:RSI:2007, ). Here the fractional fluctuations of the RF power is less than leading to an angular stability below with data of Ref.(Frohlich:RSI:2007, ). As the active area of the photodiodes is 13 mm2 we can neglect such an angular variation.
V Conclusion
We have reported the characterization of a simple AOM-based power lock for a diode laser. The “high-frequency” power fluctuations are investigated in the frequency domain by the RPN for Fourrier frequencies between 1 Hz and 1 MHz. The power flicker noise is reduced by 32 dB until 100 Hz Fourier frequency. This noise level leads to a reduction of the RPN contribution to the clock frequency instability at 1 s averaging time at the level of 2.5 instead of 5 when laser powers are not stabilized.
The slow fluctuations are studied in the time domain by means of the Allan deviation for averaging times between 1 s and 10 000 s. The measurement is limited by the instrumentation at short averaging times . A minimum at the level of is obtained from s to s. At longer times the instability increases, related to a power drift. A first drift was explained by temperature sensitive birefringent effects in the AOM. The second drift is due to the temperature sensitivity of the half-wave plate combined with a PBS. This component must be replaced, as far as possible, by a polarization-and temperature insensitive beamsplitter. The residual drift is probably due to thermal photo-diode sensitivity. Nevertheless, the power instability reaches now the 2 level at s, i.e. a reduction by almost three orders of magnitude by respect to the free running case. It is worth to note that such a power instability could still be limiting for a CPT clock based on a continuous interrogation Abdel:JAP:2015 , but not for a clock based on a Ramsey interrogation thanks to a new technique known as autobalanced Ramsey spectroscopy Sanner:2018 ; Yudin:2018 which can dramatically reduce laser-power effect on the frequency in CPT-Ramsey clocks Hafiz:PRAP:2018 ; Hafiz:APL:2018 . Finally, we have shown that a high power stability can be reached with a simple device based on a single AOM. Such a report can be useful in many laboratories working in various fields like atomic physics, optics, sensors, or metrology, in order to know what results can be achieved in frequency and time domains with this scheme, and what are the issues.
Acknowledgment
We are grateful to José Pinto Fernandes for his skill in electronics and his patience. We thank P. Yun, R. Bouchand, and Y. Le Coq for valuable contributions. We also thank V. Giordano and F. Du Burck for helpful comments. We are indebted to R. Boudot for valuable discussions and careful reading of the manuscript. F. T. was supported by French MoD, Direction Générale de l’Armement (DGA), and THALES-AVS.
References
- (1) D. Ik Kim, H. Rhee, J. Song and Y. Lee, Laser output stabilization for direct laser writing system by using an acousto-optic modulator, Rev. Sci. Instrum. 78, 103110 (2007).
- (2) L. Duan, J. Fang, R. Li, L. Jiang, M. Ding, and W. Wang, Light intensity stabilization based on second harmonic of the photoelastic modulator detection in the atomic magnetometer, Opt. Express 23, 32481 (2015).
- (3) R. Lin et al., Laser power stabilization for the detection of the populations of the atomic double levels in Cs fountain clock, 2014 IEEE International Frequency Control Symposium, DOI: 10.1109/FCS.2014.6859956 .
- (4) O. Kozlova, J-M. Danet, S. Guerandel, and E. de Clercq, Limitation of long-term stability in a coherent population trapping Cs clock, IEEE Trans. Instrum. Meas. 63, 1863 (2014).
- (5) M. Abdel Hafiz, G. Coget, P. Yun, S. Guerandel, E. de Clercq, and R. Boudot, A high performance Raman-Ramsey Cs vapor cell atomic clock, J Appl. Phys. 121, 104903 (2017).
- (6) M. Gehrtz, G. C. Bjorklund, and E. A. Whittaker, Quantum limited laser frequency-modlation spectroscopy, J. Opt. Soc. Am. B 2, 1510 (1985).
- (7) F. Du Burck and O. Lopez, Correction of the distortion in frequency modulation spectroscopy, Meas. Sci. Technol. 15, 1327 (2004).
- (8) G. Casa, D. A. Paretta, A. Castrillo, R. Wehr, and L. Gianfrani, Highly accurate determinations of CO2 line strengths using intensity-stabilized diode laser absorption spectrometry, J. Chem. Phys. 127, 084311 (2007).
- (9) L. Moretti, A. Castrillo, E. Fasci, M. D. De Vizia, G. Casa, G. Galzerano, A. Merlone, P. Laporta, and L. Gianfrani, Determination of the Boltzmann constant by means of precision measurements of H lineshapes at , Phys. Rev. Lett. 111, 060803 (2013).
- (10) P. Kwee, C. Bogan, K. Danzmann, M. Frede, H. Kim, P. King, J. Pöld, O. Puncken, RL L. Savage, F. Seifert, P. Wessels ,L. Winkelmann, and B. Willke, Stabilized high-power laser system for the gravitational wave detector advanced LIGO, Opt. Express 20, 10617 (2012).
- (11) J. Junker, P. Oppermman, and B. Willke, Shot-noise limited laser power stabilization for the AEI 10 m prototype interferometer, Opt. Lett. 42, 755 (2017).
- (12) H. Talvitie, A. Pietiläinen, and E. Ikonen, Passive frequency and intensity stabilization of extended-cavity diode lasers, Rev. Sci. Instrum. 68, 1 (1997).
- (13) H. Seong Lee and S. Hoon Yang, Long-term stabilization of the frequency and power of a laser diode, Rev. Sci. Instrum. 67, 2671 (1996).
- (14) E. N. Ivanov, Wide-band suppression of laser intensity noise, IEEE Trans. Ultrason. Ferroelect. Freq. Contr. 56, 22 (2009).
- (15) F. Liu, C. Wang, L. Li, and L. Chen, Long-term and wide-band laser intensity stabilization with an electro-optic amplitude modulator, Optics & Laser Tech. 45, 775 (2013).
- (16) G. Tetchewo, F. Du Burck, N. Djellali, and C. Laissoub, Noise of an acousto-optic modulator and limitations of an opto-electronic loop for laser beam intensity stabilization, Fluct. Noise Lett. 7, L397 (2007).
- (17) V. I. Balakshy, Yu. I. Kuznetsov, S. N. Mantsevitch, and N. V. Polikarpova, Dynamic processes in an acousto-optic laser beam intensity stabilization system, Opt. Laser Technol. 62, 89 (2014).
- (18) E. Rubiola, Phase noise and frequency stability in oscillators, Cambridge University Press, (2008).
- (19) E. Arimondo, Coherent Population Trapping in laser spectroscopy, Prog. Opt., 35, 257 (1996).
- (20) J. Kitching, S. Knappe, N. Vukic̆vic̀, L. Hollberg, R. Wynands, and W. Weidmann, A microwave frequency reference based on VCSEL-driven dark line resonances in Cs vapor, IEEE Trans. Insrum. Meas. 49, 1313 (2000).
- (21) M. Merimaa, T. Lindvall, I. Tittonen, and E. Ikonen, All-optical atomic clock based on coherent population trapping in Rb, J. Opt. Soc. Am. B 20, 273 (2003).
- (22) J. Vanier, Atomic clocks based on coherent population trapping: a review, Appl. Phys. B Lasers Opt. 81, 421-442 (2005).
- (23) V. Shah and J. Kitching, ”Advances in Coherent Population Trapping for Atomic Clocks”, Advances in Atomic, Molecular and Optical Physics, Elsevier, 59, Chapter 2 (2010).
- (24) J-M. Danet, M. Lours, S. Guerandel, and Emeric de Clercq, Dick effect in a pulsed atomic clock using coherent population trapping, IEEE Trans. Ultras. Ferro. Freq. Contr. 61, 567-574 (2014).
- (25) M. Abdel Hafiz and R. Boudot, A coherent population trapping Cs vapor cell atomic clock based on push-pull optical pumping, J. Appl. Phys. 118, 124903 (2015).
- (26) P. Yun, F. Tricot, C. E. Calosso, S. Micalizio, B. François, R. Boudot, S. Guerandel, and E. de Clercq, High-performance coherent population trapping clock with polarization modulation, Phys. Rev. Appl. 7, 014018 (2017).
- (27) J. Vanier, M. W. Levine, D. Janssen, and M. J. Delaney, On the use of intensity optical pumping and coherent population trapping techniques in the implementation of atomic frequency standards, IEEE Trans. Insrum. Meas. 52, 822 (2003).
- (28) X. Baillard, A. Gauguet, S. Bize, P. Lemonde, Ph. Laurent, A. Clairon, P. Rosenbusch, Interference-filter-stabilized external-cavity diode laser, Opt. Commun. 266, 609 (2006).
- (29) Y. Ohmachi and N. Uchida, Temperature dependence of elastic, dielectric, and piezoelectric constants in TeO2 single crystals, J. Appl. Phys., 41, 2307 (1970).
- (30) N. Uchida, Optical properties of single crystal paratellurite (TeO2), Phys. Rev. B 4, 3736 (1976).
- (31) V. I. Balakshy, V. B. Voloshinov, V. A. Karasev, V. Y. Molchanov, and V. Semenkov, Compensation of thermal effects in acousto-optic deflector, Proc. SPIE 2713, Fifth International Conference on Industrial Lasers and Laser Applications ’95, p. 164 (1996) https://doi.org/10.1117/12.234185
- (32) B. Fröhlich, T. Lahaye, B. Kalenhäuser, H. Kübler, S. Müller, T. Koch, M. Fattori, and T. Pfau, Two-frequency acousto-optic modulator driver to improve the beam pointing stability during intensity ramps, Rev. Sci. Instrum. 78, 043101 (2007).
- (33) C. Sanner, N. Huntemann, R. Lange, C. Tann, and E. Peik, Autobalanced Ramsey spectroscopy, Phys. Rev. Lett. 120, 053602 (2018).
- (34) V. Yudin, A. V. Taichenachev, M. Y. Basalaev, T. Zanon-Willette, J. W. Pollock, M. Shuker, E. A. Donley, and J. Kitching, Generalized autobalanced Ramsey spectroscopy, Phys. Rev. Appl. 9, 054034 (2018).
- (35) M. Abdel Hafiz, G. Coget, M. Petersen, C. Rocher, T. Zanon-Willette, S. Guerandel, E. de Clercq, and R. Boudot, Toward a high-stability coherent population trapping Cs vapor-cell atomic clock using autobalanced Ramsey spectroscopy, Phys. Rev. Appl. 9, 064002 (2018).
- (36) M. Abdel Hafiz, G. Coget, M. Petersen, C. E. Calosso, S. Guerandel, E. de Clercq, and R. Boudot, Symmetric autobalanced Ramsey interrogation for high-performance coherent population trapping vapor-cell atomic clock, Appl. Phys. Lett. 112, 244102 (2018).