Fast and slow paths to quiescence: ages and sizes of 400 quiescent galaxies from the LEGA-C survey
Abstract
We analyze stellar age indicators (Dn4000 and EW(H)) and sizes of 467 quiescent galaxies with at drawn from DR2 of the LEGA-C survey. Interpreting index variations in terms of equivalent single stellar population age, we find that the median stellar population is younger for larger galaxies at fixed stellar mass. The effect is significant, yet small; the ages of the larger and the smaller subsets differ by only Myr, much less than the age variation among individual galaxies ( Gyr). At the same time, post-starburst galaxies — those experienced recent and rapid quenching events — are much smaller than expected based on the global correlation between age and size of normal quiescent galaxies. These co-existing trends unify seemingly contradictory results in the literature; the complex correlations between size and age indicators revealed by our large sample of galaxies with high-quality spectra suggest that there are multiple evolutionary pathways to quiescence. Regardless of the specific physical mechanisms responsible for the cessation of star formation in massive galaxies, the large scatter in Dn4000 and EW(H) immediately implies that galaxies follow a large variety in evolutionary pathways. On the one hand, we see evidence for a process that slowly shuts off star-formation and transforms star-forming galaxies to quiescent galaxies without necessarily changing their structures. On the other hand, there is likely a mechanism that rapidly quenches galaxies, an event that coincides with dramatic structural changes, producing post-starburst galaxies that can be smaller than their progenitors.
1 Introduction
Large extragalactic surveys have revealed that there are two distinct populations of galaxies: the so-called red sequence, dominated by galaxies with quiescent star formation and old stellar populations, and the blue cloud, containing mainly star-forming galaxies (Strateva et al., 2001; Baldry et al., 2004; Bell et al., 2004; Willmer et al., 2006; Franzetti et al., 2007). The structure of stellar components of these two categories of galaxies shows clear differences. Quiescent galaxies have on average smaller sizes and more concentrated light profiles than star-forming galaxies of the same stellar masses. The average sizes of each population increase by several times from to and the difference in size is in place at all epochs observed (Shen et al., 2003; Trujillo et al., 2007; Williams et al., 2010; van der Wel et al., 2014; Paulino-Afonso et al., 2017). Despite the empirical correlation between galaxy sizes and star-formation rates (SFRs) being well established, the physical causality (or lack of; Lilly & Carollo, 2016) remains contentious.
Several mechanisms have been proposed to explain the cessation of star-formation in massive galaxies. For field galaxies, one type of mechanisms is cutting off the cold gas supply, leading to galaxies naturally running out of fuel for forming new stars. In massive dark matter halos, infalling gas would be shock heated to high temperature (Dekel & Birnboim, 2006). Additionally, active galactic nuclei (AGN) or supernovae could inject energy and heat up the gas, further slowing down the cooling process and star-formation (Best et al., 2005; Croton et al., 2006; Fabian, 2012; Barišić et al., 2017; Terrazas et al., 2017). The star-formation may continue for a few Gyrs until the cold gas reservoir is used up or heated up.
Another type involves more violent events. Gas-rich galaxy mergers, interaction, and disk instability can efficiently funnel gas into the centers of galaxies, induce intensive star formation and exhaust the available gas in a short period of time (Barnes & Hernquist, 1991, 1996; Snyder et al., 2011). Gas can be also removed from the galaxies due to strong outflows induced by starbursts and AGNs (Springel et al., 2005; Kaviraj et al., 2007). Furthermore, the turbulence induced by the violent processes prevents the remaining gas from collapsing and forming stars (Ellison et al., 2018; Smercina et al., 2018).
These two types of processes predict different structural change during the transition period. The first type of mechanisms does not directly involve a change of galaxy structure; therefore, new quiescent galaxies will have sizes similar to their star-forming progenitors. The second category involves further star-formation activities in the galaxy centers. Dense cores build up during the process and the structures change.
The expected sizes of newly-formed quiescent galaxies are thus different in these two scenarios. If the sizes do not change much during the transition from star-forming to quiescent, newly-formed quiescent galaxies are expected to be larger than the existing quiescent population. At any epoch, there should be a general correlation between the stellar ages and the sizes of quiescent galaxies such that at fixed stellar mass, larger galaxies are on average younger. This formation process also provides, at least partially, a natural explanation to the smaller average sizes of quiescent galaxies in the early universe. The observed size evolution is a ‘progenitor bias’ in such that large quiescent galaxies at present-day were still forming stars at higher redshifts, thus, not classified as quiescent galaxies. The population of quiescent galaxies at high-redshifts is a smaller biased subset of present-day quiescent galaxies (van Dokkum & Franx, 2001; van der Wel et al., 2009; Carollo et al., 2013; Poggianti et al., 2013). On the other hand, if the quenching process is accompanied by the growth of a dense galaxy core, the effective radii of newly-formed quiescent galaxies become smaller than their progenitors and can be even smaller than existing quiescent galaxies.
The picture is complicated by subsequent merger events. Dry mergers add stars of any ages to the outskirts of quiescent galaxies, therefore, the sizes of quiescent galaxies increase and the average age of the stellar population is altered. The age-size correlation, if existing at the time when quiescent galaxies form, will be gradually washed out by the merger events (Shankar et al., 2010). This issue can be mitigated by looking at the high-redshift universe, where galaxies are on average much younger, such that fewer merger events had happened by the time that galaxies are observed.
Some recent works have attempted to address the age-size correlation up to but the results are so far inconclusive. Studies splitting the population by sizes generally report either weak or no significant correlation that larger galaxies are younger (van der Wel et al., 2009; Trujillo et al., 2011; Fagioli et al., 2016; Zanella et al., 2016; Williams et al., 2017). On the contrary, multiple works find that post-starburst (PSB) galaxies, those young quiescent galaxies whose star-formation rates dropped rapidly in the recent past (Dressler & Gunn, 1983; Balogh et al., 1999; Dressler et al., 1999), are smaller than the average quiescent galaxies (Whitaker et al., 2012; Yano et al., 2016; Almaini et al., 2017). These two statements appear to be supporting different scenarios of the formation and the size evolution of quiescent galaxies.
At the moment, it is not straight-forward to combine all these results and form a coherent picture. Each work studies different galaxy samples in various stellar mass and redshift ranges, measures the galaxy sizes and ages from imaging and spectroscopic data of different qualities with various methods. In this paper, we present an overview of the sizes and age-sensitive absorption features (Dn4000 and EW(H)) of over 400 quiescent galaxies. The sample is drawn from the Large Early Galaxy Astrophysics Census (LEGA-C) survey (van der Wel et al., 2016, Straatmann et al. submitted). All galaxies have ultra-deep optical spectra that provide precise measurements to infer the ages and recent star-formation histories (Wu et al., 2018; Chauke et al., 2018) as well as images from the Hubble Space Telescope (HST) for accurate size measurements.
We will show that the correlations between the size and age indicators is complex and can only be revealed by a large sample of galaxies with high-quality spectra. Our results suggest that galaxies join the red sequence in different ways.
We describe the galaxy sample and the measurement of basic galaxy properties in Section 2. In Section 3, we investigate the correlation between ages and sizes on an individual-galaxy basis. In Section 4 we briefly summarize the literature and discuss the implications for the formation of quiescent galaxies. We present our conclusions in Section 5.
2 Data and Analysis
This study is based on the first two years of data of the LEGA-C survey. The LEGA-C survey is a 4-year survey using the Visible Multi-Object Spectrograph (VIMOS; Le Fèvre et al., 2003) mounted on the 8 m Very Large Telescope to obtain rest-frame optical spectra of 3000 -band selected galaxies mainly at . Each galaxy receives hrs of integration at a spectral resolution of . The typical continuum signal-to-noise ratio (S/N) is 20Å-1. We refer to van der Wel et al. (2016) for the design of the survey and Straatman et al. (2018) for details of observation and data reduction.
2.1 Stellar Masses, star-formation rates, and sizes of galaxies
We derive galaxy stellar masses by fitting the observed multi-wavelength spectral energy distributions (SEDs) from the UltraVISTA catalog (Muzzin et al., 2013) using the FAST code (Kriek et al., 2009). The SED templates are from the (Bruzual & Charlot, 2003) stellar population synthesis models with exponentially declining star-formation rates. We adopt a Chabrier (2003) initial mass function (IMF) and the Calzetti et al. (2000) dust extinction law. The SFRs are estimated from the UV and IR luminosities, following the prescription of Whitaker et al. (2012).
We derive the sizes of galaxies using the HST ACS F814W images from the COSMOS program (GO-9822, GO-10092, PI: N. Scoville, Scoville et al., 2007), following the procedure of van der Wel et al. (2012). For each galaxy, we first create a 10″ cutout and then use galfit (Peng et al., 2010) to fit a single Sérsic profiles to the 2-D light profile. The effective radius, total magnitude, Sérsic index, axis ratio, position angle, and background are set as free parameters. Neighboring sources are fit simultaneously. The Point Spread Function (PSF) is measured from stars in the proximity in terms of the detector position. The size of galaxies, , is defined as the semi-major axis of the ellipse that contains half of the total flux of the best-fit Sérsic model.
2.2 Measuring spectral indices
In this paper, we examine two age-sensitive spectral features, the 4000Å break, Dn4000 and the equivalent width of H absorption, EW(H). We use the equivalent width of H emission to distinguish quiescent from star-forming galaxies.
To separate the ionized gas emission from the stellar continuum, we model the observed spectrum using the Penalized Pixel-Fitting (pPXF) method (Cappellari & Emsellem, 2004; Cappellari, 2017). Each galaxy spectrum is fit by a combination of two templates representing the stellar continuum and the gas emission. We model the continuum with high resolution () theoretical single stellar population (SSP) templates (Conroy et al., in prep.). All emission lines are modeled as a single kinematic component: all with the same velocity and velocity dispersion. The strength of each line is a free parameter. We refer to Bezanson et al. (2018) for the detailed fitting process.
We adopt the definition of the Dn4000 in Balogh et al. (1999) and the H index in Worthey & Ottaviani (1997). Both indices are measured from the emission-line-subtracted spectra. The equivalent width of H (EW(H)), is the ratio between the best-fit model emission line flux and the local continuum level, which is defined as the average continuum flux density between 4760Å and 4960Å in rest-frame. The typical uncertainties are , Å, and Å for Dn4000, EW(H), and EW(H), respectively.
2.3 Sample Selection
The first two years of LEGA-C primary sample consists of 1550 galaxies brighter than and with redshifts (van der Wel et al., 2016). We exclude spectra (1) with fundamental flaws, (2) that we cannot measure redshifts from, and (3) whose pPXF fit is flawed. The remaining 1462 spectra are considered to be useful for scientific purposes and have a flag in the LEGA-C DR2 catalog (Straatmann et al. 2018, submitted).
To measure the EW(H), we first select 1112 spectra that cover the wavelength range of EW(H) and with median per spectral pixel between rest-frame wavelength 4000Å and 4300Å. The uncertainties on EW(H) of spectra with are in general Å, too large to be a robust age indicator and would contaminate the selection of PSB galaxies. We then visually inspect HST and the galfit best-fit model images, exclude 159 galaxies with catastrophic failures in the fitting or highly disturbed morphologies that cannot be well modeled by a single Sérsic profile. From the remaining 953 galaxies, we further exclude 61 galaxies whose spectra or broadband photometries are contaminated by neighboring objects. In total, we have 892 galaxies with good measurements of spectral indices, sizes, and stellar masses.
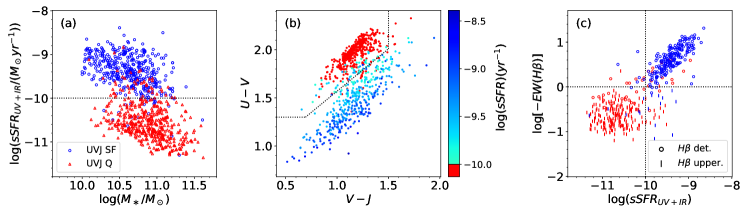
Several methods can be used to select quiescent populations, resulting in different levels of contamination and incompleteness (Moresco et al., 2013). In this paper, we analyze 3 samples of quiescent galaxies using different diagnostics: (1) no or weak H emission line (Å), (2) low specific SFR (sSFR) based on the IR and UV luminosities (yr-1), and (3) the rest-frame U-V and V-J colors, the demarcation of Muzzin et al. (2013). Table 1 lists the sample sizes with the 3 definitions of quiescence. The EW(H) sample contains fewer galaxies because of an extra constraint on the spectral coverage; the spectra have to cover rest-frame Å in order to measure the EW(H), which is not required for the UV+IR sSFR and the UVJ color selections. The numbers in the parentheses are numbers of spectra which also covers the Dn4000 region. When Dn4000 is required for the analysis, we use this subset of data.
These three classifications in general agree with each other well (Fig. 1). In each sample, of galaxies are also defined as quiescent by the other two criteria. We estimate the ‘incompleteness’ by calculating the number of star-forming galaxies that would be defined as quiescent galaxies by either of the other two criteria. The number of these potential missing objects is of the number of quiescent galaxies.
We adopt the the H emission line as our fiducial criteria of quiescence, as the Balmer emission lines trace star-formation in a shorter time-scale ( Myr) comparing to the other two indicators ( Myr). We note that we do not adopt the [Oii]3727,3729 doublets as a star-formation indicator. It has been shown that roughly half of the red galaxies and PSB galaxies have moderate [Oii] emission while lacking of Balmer emission. The excess of [Oii] is likely due to AGN or LINERs rather than star-formation activities. Requiring no or weak [Oii] emission results in a highly incomplete and potentially biased sample of quiescent galaxies (Yan et al., 2006; Lemaux et al., 2010; Wu et al., 2014; Lemaux et al., 2017).
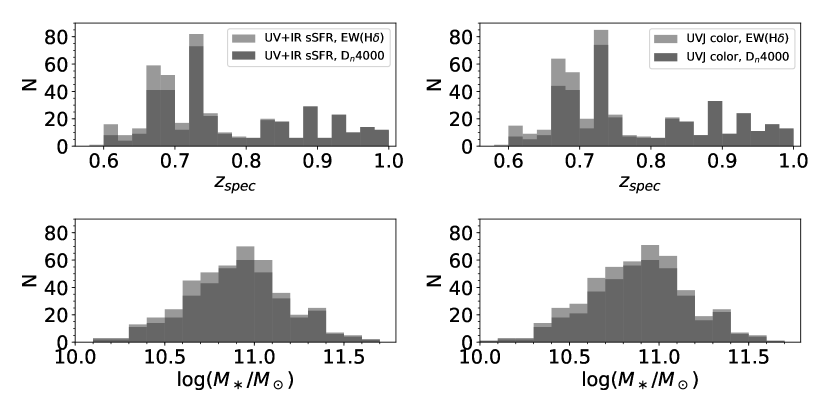
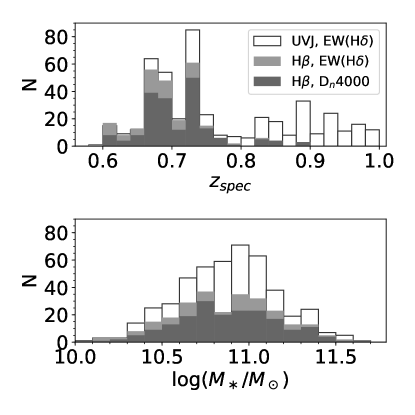
We repeat the analysis using the UV+IR sSFR and UVJ color quiescent samples and show the complementary results in the Appendix. The conclusions in this paper is not affected by the definition of quiescence. Fig. 2 shows the redshift and stellar mass distributions of the EW(H) quiescent sample. We also plot the distributions of UVJ quiescent galaxies for a comparison. The EW(H) quiescent galaxies are at lower redshifts because the H line is generally outside our spectral coverage at ; we are not able to use the H selection for those galaxies.
| Quiescence Criteria | ||
|---|---|---|
| EW(H)Å | 260(189) | 13(8) |
| 441(372) | 15(13) | |
| UVJ color | 467(390) | 35(31) |
-
•
The numbers in the parentheses are number of spectra covering both EW(H) and Dn4000.
2.4 Definition of Post-starburst galaxies
PSB galaxies are galaxies whose star-formation was shut off rapidly in the last 1 Gyr. One of the prominent spectral features of PSB galaxies is their strong Balmer absorptions, indicating a dominating population of A to early F-type stars (Dressler & Gunn, 1983; Balogh et al., 1999; Dressler et al., 1999).
In order to select PSB galaxies, several methods have been proposed for different types of data (e.g., Wild et al., 2009; Kriek et al., 2010; Muzzin et al., 2012). Our spectra allow us to measure the H absorption strength accurately. Therefore, we use a traditional definition, define PSB galaxies as quiescent galaxies with strong H absorption. The boundary of “strong” H is often drawn at Å. In this paper, we require PSB galaxies to have Å. The numbers of PSB galaxies with each definition of quiescent is listed in Table 1.
2.5 Mass size relation
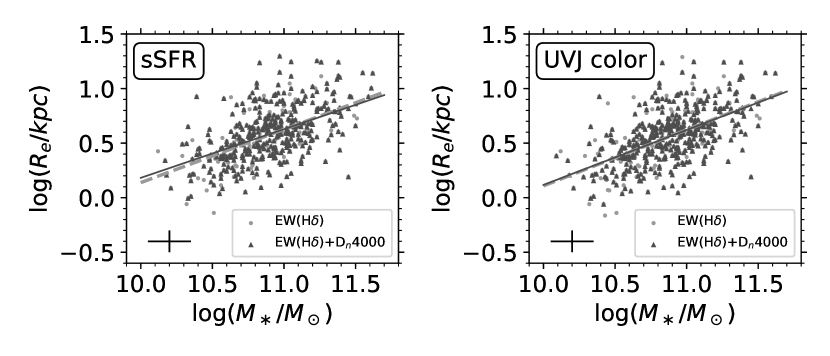
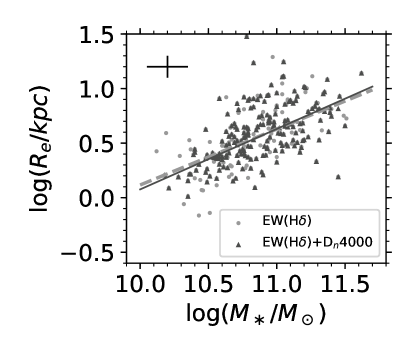
Fig. 3 shows the mass-size relations of quiescent galaxies. We fit a linear relation between the median sizes in each 0.1 dex mass bins and the mass in the log-log space:
| (1) |
We fit both for the whole sample and the Dn4000 subset and estimate the uncertainties from bootstrap resampling. The two best-fit parameters are and , respectively. The two best-fit relations agree with each other within 0.04 dex in at fixed mass.
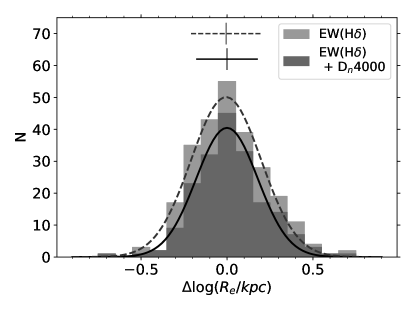
In this paper, we use the sizes relative to the median sizes at fixed masses as the metric for galaxy sizes:
| (2) |
where is the best-fit median size at given masses according to Equation 1 and the best-fit parameters of each sample, respectively. The distributions of can be modeled as a Gaussian distribution centered at , with a standard deviation of dex (Fig. 4).
We note that our best-fit slope is different from the slope derived from the CANDLES survey (0.71, van der Wel et al., 2014). The difference can be a result of different sample selections and fitting methods. We checked that the S/N cut does not bias the size. The distribution of low-S/N galaxies with good mass and size measurements can be well modeled by a Gaussian centered at with a standard deviation of dex, similar to Fig. 4. We also repeat the fitting using samples without the S/N cut and find that the slopes change by and best-fit at fixed masses change by dex.
3 Correlations between sizes and age-sensitive indicators
We examine the size dependences of two age-sensitive spectral features, Dn4000 and EW(H). For passive galaxies, the Dn4000 increases monotonically with the stellar age. On the other hand, the EW(H) is sensitive to recent star-formation such that galaxies with rapidly declining SFRs will have elevated EW(H) in the first few hundred Myr after the star-formation stops then the EW(H) gradually decreases afterward. These two indices together work as proxies for stellar ages and the recent star-formation histories (Kauffmann et al., 2003; Wu et al., 2018).
3.1 The dependence of Dn4000 and EW(H) on galaxy size
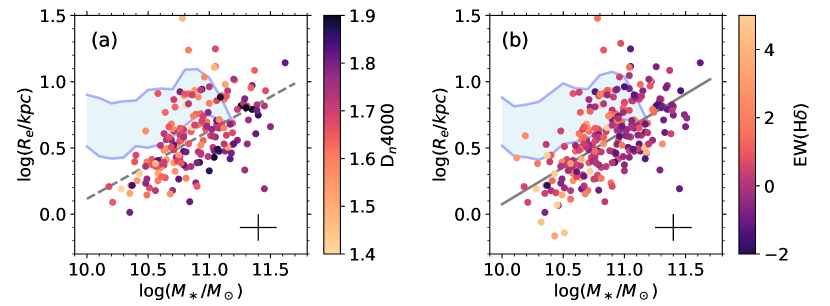
Fig. 5 shows the stellar masses and sizes of quiescent galaxies, color-coded by Dn4000 and EW(H). For comparison, we also plot the size distribution of star-forming galaxies (16th and 84th percentiles) as a function of stellar masses. First of all, at a given mass and size, galaxies can have very different Dn4000 and EW(H). The typical uncertainty of our Dn4000 and EW(H) measurement is and Å, much smaller than the range of the distribution. The large color variations in Fig. 5 are not due to measurement uncertainties but suggest large individual variations in ages at fixed stellar mass and size.
Despite the large individual variation, a weak trend can be identified in Fig. 5a. Galaxies with large Dn4000, those with dark colors, tend to be massive and smaller than the average. The upper half of the mass-size relation is occupied mainly by points with lighter color, those galaxies with small Dn4000. As for the EW(H) in Fig. 5b, a weak mass dependence is present such that high mass galaxies have on average smaller EW(H). On the other hand, there is no clear size dependence by visual inspection.
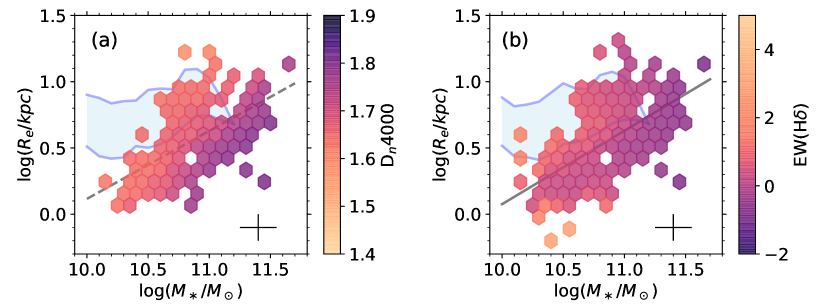
We apply the Locally Weighted Regression (LOESS) method to derive the mean trends of Dn4000 and EW(H) on the mass-size plane (Fig. 6). We use the CAP_LOESS_2D routine of Cappellari et al. (2013), which implements the multivariate LOESS algorithm of Cleveland & Devlin (1988). We adopt a regularization factor and a linear local approximation.
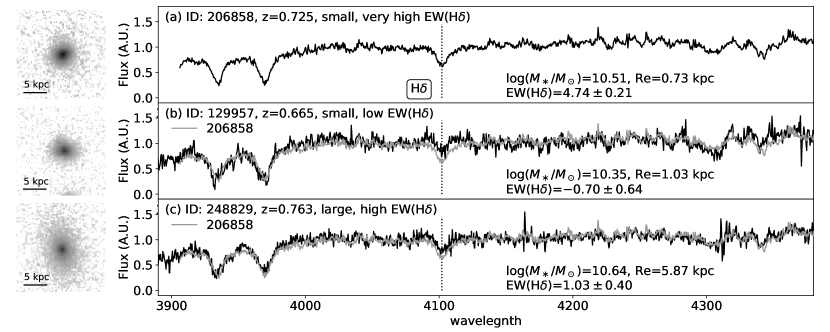
The LOESS-smoothed maps confirm the visual inspection on Fig. 5. Firstly, more massive galaxies have on average larger Dn4000 and smaller EW(H), suggesting that massive galaxies form their stars earlier (see Haines et al., 2017; Siudek et al., 2017; Wu et al., 2018, for results at similar redshifts). At fixed stellar mass, larger galaxies have smaller Dn4000 (see Zahid & Geller, 2017, for results at lower redshifts). On the other hand, the behavior of EW(H) is more complex. For massive galaxies (), the LOESS-smoothed map does not show a clear trend in EW(H) as a function of the size. For the bulk of the lower mass galaxies, larger galaxies have slightly larger EW(H). However, we also find that the smallest bins have large EW(H) (see also Fig. 16 and Fig. 17 in the Appendix). This reversal is driven by a few small galaxies with very strong H absorption (Fig. 5). Fig. 7a shows an example. Comparing to galaxies of similar masses, the Balmer absorption is clearly stronger than the galaxy of similar size (Fig. 7b) or a much larger galaxy (Fig. 7c). We discuss the correlation between the spectral indices and the size of galaxies in further detail in the following sections.
3.2 The correlation between stellar ages and sizes of quiescent galaxies
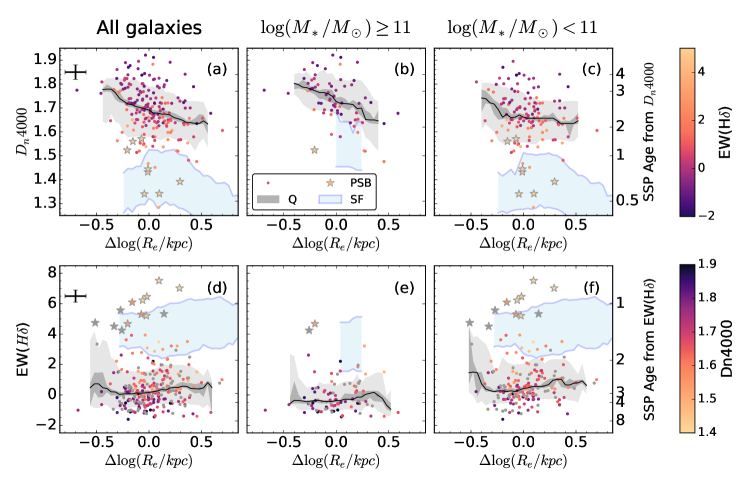
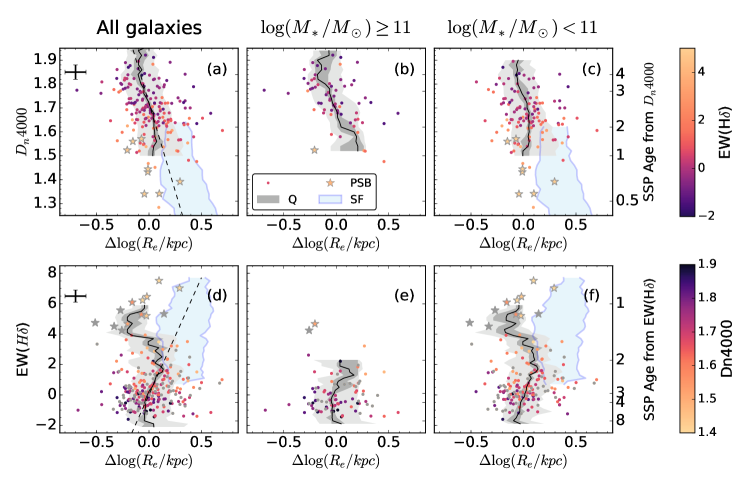
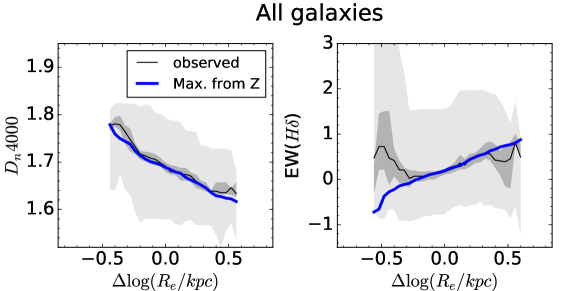
Fig. 8 shows the relations between , the size relative to the median sizes at fixed mass (Section 2.5), and Dn4000 and EW(H) for the whole sample and in two stellar mass bins. As in Fig. 5, at fixed , quiescent galaxies can have very different Dn4000 and EW(H). The light gray shaded areas in Fig. 8, the 16th and the 84th percentiles of the Dn4000 and EW(H) distributions, cover and , respectively. For a simple stellar population SSP with solar metallicity (Bruzual & Charlot, 2003), these ranges correspond to an age range of Gyr. The running medians (black lines) show that the Dn4000 progressively decreases as increases. The overall size dependence in EW(H) is less significant. For the low-mass bin, larger galaxies have on average slightly larger EW(H), except for the most compact galaxies. There is no detectable size dependence for the high-mass bin.
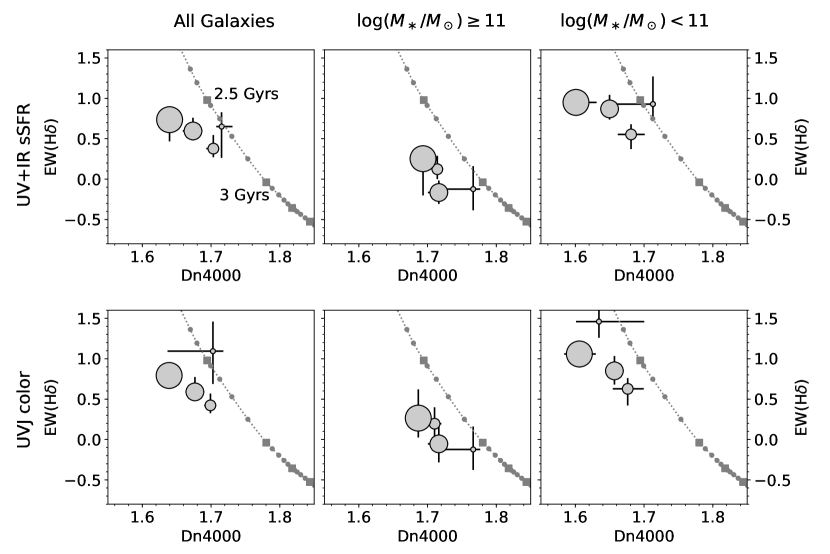
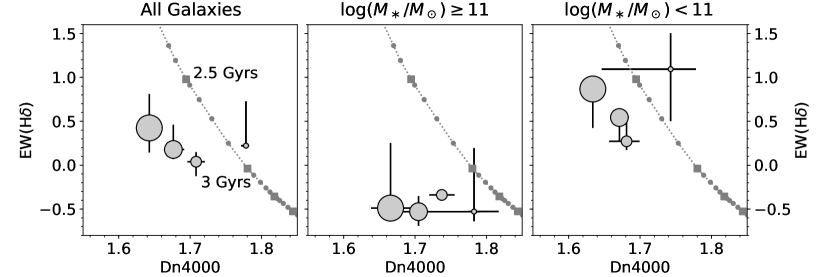
We show the median indices of galaxies in 4 size bins on the Dn4000-EW(H) plane (Fig. 9). The size bins are divided at -0.2, 0, and 0.2. The middle two size bins contain the majority of galaxies as 0.2 dex is the of the distribution of (Section 2.5). The largest and the smallest bins, on the other hand, contain galaxies with size significantly larger or smaller than the average population. We also plot the evolutionary model track of the solar-metallicity SSP for a reference. The trend in Dn4000 and EW(H) combined suggests that except for the smallest bin, there is a weak size dependence on stellar ages that larger galaxies are on average younger, but the difference in age is small, Myrs. Galaxies in the smallest size bin are a mix of old galaxies and post-starburst galaxies (See Section 3.3).
We also investigate how the sizes of galaxies change as a function of Dn4000 or EW(H) (Fig. 10). The increases towards smaller Dn4000 and larger EW(H) at and Å, the regimes where the quiescent galaxies are the dominating population (Fig. 8 and Kauffmann et al. (2003); Haines et al. (2017); Wu et al. (2018)). Within these ranges of indices, the Spearman’s rank correlation coefficients and their p-values between and indices are , for Dn4000 and , for EW(H). We fit linear relations to the median and the indices for quiescent galaxies with and Å in Fig. 10a and Fig. 10d as:
| (3) | |||
These results suggest a trend that quiescent galaxies with younger stellar populations are on average larger, consistent with Fig. 8 and Fig. 9.
However, the median sizes become smaller at Å, reaching at Å (Fig. 10d and Fig. 10f). We will discuss the sizes of these PSB galaxies in the next section.
3.3 The size of Post-starburst Galaxies
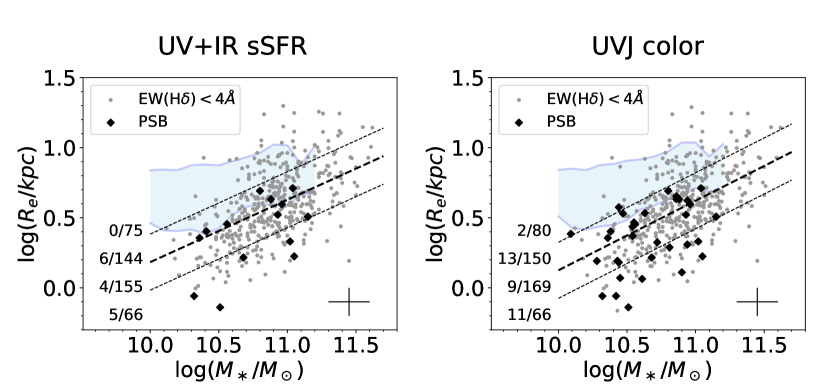
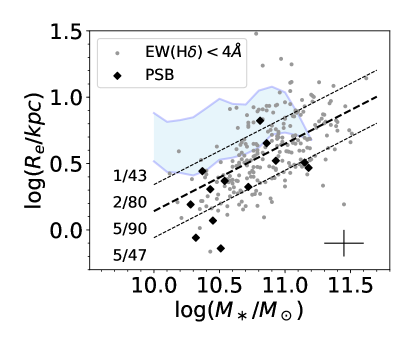
Fig. 11 shows PSB galaxies on the mass-size plane. The majority (10/13) of PSB galaxies are located at the bottom half of the mass-size plane and 40% (5/13) are below 1 of the size distribution (see Fig. 21 in the Appendix for complementary results). The PSB galaxies have median and median Å. Casting the indices in terms of the ages of a SSP, they are among the youngest quiescent galaxies but they are not larger than the average quiescent population.
The whole PSB population has a median size of . By extrapolating Equ. 3, the expected sizes of galaxies with Å will be , which is much larger than PSB galaxies but comparable to star-forming galaxies (See Fig. 10d). Even comparing to the sizes of typical young quiescent galaxies ( at Å), PSB galaxies are still significantly smaller; They do not follow the general correlation between the age and the size characterized by the majority of galaxies.
4 Discussion
The results in Section 3 can be summarized as at fixed mass, (1) larger quiescent galaxies have on average younger stellar ages, and (2) PSB galaxies are much smaller than expected based on their young stellar populations. The correlation among the sizes, the ages, and the recent star-formation histories puts constraints on the formation and evolution processes of quiescent galaxies. Several recent studies address this question but report seemingly contradictory results. In this section, we show that our high-quality data and the larger sample size present a complete picture. We then discuss the implication on the formation of quiescent galaxies.
4.1 Reconciling tensions in the literature
Several studies have investigated the age-size correlation of quiescent galaxies. Fagioli et al. (2016) and Williams et al. (2017) split their samples into two size bins and derive galaxy ages from co-added spectra in each size bin. They find that at , smaller galaxies are slightly older, but the age difference between galaxies in the two size bins is at largest a few hundred Myrs at . For galaxies with , there appears to be no clear trend. Belli et al. (2015) shows that at , quiescent galaxies older than 1.25 Gyr are smaller than the average at fixed stellar masses, whereas Trujillo et al. (2011) and Zanella et al. (2016) find no significant size difference between old and young quiescent galaxies at .
On the other hand, Keating et al. (2015) find that compact massive galaxies ( kpc and ) at are younger than a control sample of galaxies of similar masses. A few studies on high- PSB galaxies also find that these galaxies are among the smallest quiescent galaxies at fixed stellar masses (Whitaker et al., 2012; Yano et al., 2016; Almaini et al., 2017). These studies based on either the most compact galaxies or PSB galaxies conclude that quiescent galaxies were compact when they formed.
There is apparent tension between these statements. Our results in Section 3 present a complete picture that reconciles these seemingly contradictory observations. First of all, for the 3 largest size bins, the median Dn4000 and EW(H) differ by and Å. When casting these age indicators in terms of single stellar population ages, the ages differ by only Myr (Fig. 9). The difference in age is in broad agreement with previous studies derived from stacking spectra of large and small galaxies (Trujillo et al., 2011; Fagioli et al., 2016; Williams et al., 2017). At the same time, we also find that PSB galaxies are much smaller than expected based on the global correlation between age and size.
The apparent contradiction in the literature is mainly due to sample selection and data binning that present only a partial view. First of all, studies focusing on special objects, either compact galaxies or PSB galaxies, pick up outliers that do not follow the average age-size correlation (Fig. 10). Secondly, the individual age variation is large comparing to the average trend (Fig. 8). The correlation between the age indicators and the sizes may not be detectable using a small sample or low S/N data. The stacking analysis can improve the measurements and recover the average trend when a large sample is available, but wash out the variations among individual galaxies. PSB galaxies represent only of the quiescent population in our sample (13 out of 260 in our sample, see also Vergani et al., 2008; Yan et al., 2009; Muzzin et al., 2012; Wu et al., 2014; Wild et al., 2016, for studies at ). The stacking analysis cannot identify the peculiar behaviors of these rare special objects. Only with LEGA-C’s unique combination of sample size and data quality, we can reveal the complex correlations between galaxy sizes and age indicators.
4.2 Multiple ways to quiescence
The different sizes of PSB galaxies and the rest of young quiescent galaxies suggest that these populations have different star-formation histories. By definition, the star-formation activities in PSB galaxies have been shut off rapidly within a short timescale of a few hundred Myrs (Le Borgne et al., 2006; Wild et al., 2009; Snyder et al., 2011). On the contrary, other young quiescent galaxies did not necessarily experience the same rapid quenching processes. The correlation between the size and the timescale that star-formation shuts off corresponds to different types of evolutionary scenarios.
4.2.1 Slow process, large young quiescent galaxies
The first type of mechanisms to stop star-formation is cutting off the supply of cold gas, therefore, galaxies naturally run out of fuel to form new stars. In massive dark matter halos, cold gas can be shock heated to high temperature while falling into the halos (Kereš et al., 2005; Dekel et al., 2009). Furthermore, active galactic nuclei (AGN) can inject energy and keep the halo gas hot (Best et al., 2005; Croton et al., 2006; Sijacki et al., 2007; Best et al., 2014; Yesuf et al., 2014; Terrazas et al., 2016; Barišić et al., 2017). The star-formation rates thus gradually drop as the cold gas reservoir depletes. This process does not directly require a change in structure when a galaxy transforms from star-forming to quiescent.
At fixed stellar mass, the size distributions of star-forming and quiescent galaxies overlap with each other in such that the smaller half of star-forming galaxies have similar sizes to the larger half of quiescent galaxies (van der Wel et al., 2014, also Fig. 11). The similarity in stellar masses and sizes makes small star-forming galaxies candidate immediate progenitors of quiescent galaxies. As the SFR declines, a relative small star-forming galaxy naturally becomes a relative large quiescent galaxy with young stellar populations. The average size of the quiescent population also increases.
Carollo et al. (2013) calculated the average size growth of the quiescent population at under the assumption that at any time, newly-formed quiescent galaxies have the same size distributions as the star-forming galaxies at the same epoch. They are able to reproduce the size evolution of massive () quiescent galaxies but over-predict the sizes of lower mass quiescent galaxies. If small star-forming galaxies are progenitors of newly-formed quiescent galaxies, this discrepancy can be mitigated.
In the local Universe, where the total cold gas mass is measurable, the gas content in star-forming galaxies strongly correlates with the size of stellar disks, such that at fixed stellar mass, star-forming galaxies with more compact disks possess less gas (Wu, 2018). This dependence of gas content on disk sizes is likely in place up to based on an inversion of a star formation law (Popping et al., 2015). Once there is no more cold gas supply, smaller star-forming galaxies would use up the fuel quicker.
Moreover, from a dynamical point of view, more compact, high surface density galaxies are expected to be less stable against both global and local growth of instability thus more efficient in turning gas into stars (Dalcanton et al., 1997; Mihos et al., 1997). This size dependence of star-formation efficiency is also required to explain the size dependence of gas-phase metallicity (Wu et al., 2015). The instability may also trigger the gas flows toward the centers of galaxies, which accelerate the growth of the black holes (Bournaud et al., 2011; Gabor & Bournaud, 2013) and enhance the AGN feedback to keep the galaxies quiescent at earlier times. The cosmological simulation IllustrisTNG (Pillepich et al., 2018) also suggests that smaller star-forming galaxies terminate their star-formation activities earlier (Genel et al., 2018).
4.2.2 Fast process, PSB galaxies with various sizes
The other type of mechanisms involve more violent events. Galaxy mergers, interaction, or violent disk instability can efficiently funnel gas into the centers of galaxies, inducing intense star formation in the galaxy centers and exhausting available gas in a short period of time (Yang et al., 2008; Dekel et al., 2009; Zolotov et al., 2015). In addition, AGN triggered by infalling gas and strong supernova feedback after the starburst could eject ISM from galaxies, accelerates the quenching process (Efstathiou, 2000; Springel et al., 2005; Hopkins et al., 2006, 2008). The merger can also enhance turbulence and make the gas stable against gravitational collapse (Ellison et al., 2018). The rapidly rising star-formation rate and the subsequent quenching process can happen within a few hundreds of Myrs. In this scenario, the last period of star-formation can build up a dense core in the centers. The descendant galaxy can thus have smaller than its progenitor (Barnes & Hernquist, 1991; Mihos & Hernquist, 1994; Barnes & Hernquist, 1996; Bournaud et al., 2011; Dekel & Burkert, 2014; Zolotov et al., 2015).
Recent works have identified candidate progenitors of compact PSB galaxies. Case studies on some compact star-forming galaxies at found that they have centrally-concentrated cores in rest-frame UV and optical wavelengths and short gas depletion time (Barro et al., 2016, 2017; Popping et al., 2017), showing that these galaxies are possibly building the central dense cores and rapidly exhausting the gas reservoir simultaneously. After star-formation stops, the stellar population is dominated by A-type stars and the quiescent descendants would be classified as compact PSB galaxies.
4.2.3 Coexistence of Multiple Pathways to Quiescence
Our results suggest strongly that there are at least two types of mechanisms with distinct timescales in effect. Neither of the processes discussed above alone can easily produce the complex relationships among the size, the ages, and the recent star-formation history.
First of all, simply cutting off the supply of cold gas cannot produce PSB galaxies. Comparisons of the cold gas content and the SFRs of star-forming galaxies at generally show that the gas depletion timescale is of the order of 1 Gyr or longer (Leroy et al., 2008; Schiminovich et al., 2010; Bigiel et al., 2011; Saintonge et al., 2011; Schruba et al., 2011; Huang et al., 2012; Tacconi et al., 2013; Genzel et al., 2015; Tacconi et al., 2018). Galaxies with such star-formation histories unlikely go through the post-starburst phase. When the SFR becomes low enough that galaxies are classified as quiescent, the stellar populations have already aged and do not exhibit strong Balmer absorption (Le Borgne et al., 2006). To produce PSB galaxies, a much shorter quenching timescale ( a few hundred Myr) or an additional starburst is necessary (Le Borgne et al., 2006; Wild et al., 2009; Snyder et al., 2011). Moreover, the size of PSB galaxies are significantly smaller than star-forming galaxies of the same mass (Fig. 10 and Fig. 11). To transform a star-forming galaxy to a PSB galaxy, both the SFR and the size must be altered by the quenching mechanism.
Secondly, PSB galaxies are unlikely the progenitors of the majority of quiescent population, at least up to . If the size distribution of PSB galaxies is representative for all new quiescent galaxies, there would not be the age-size correlation that large galaxies are typically younger than smaller galaxies.
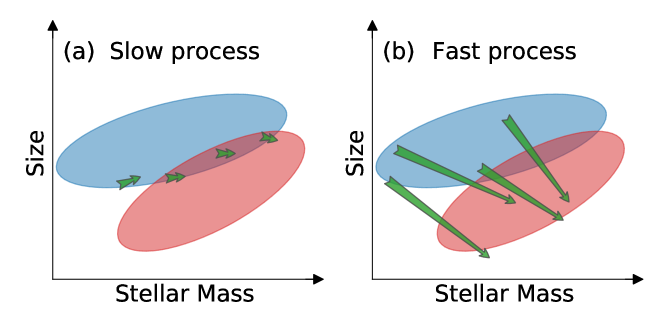
The complex correlation among sizes, ages, and recent star-formation histories warrants multiple mechanisms transforming galaxies from star-forming to quiescent (also see Schawinski et al., 2014; Belli et al., 2015; Maltby et al., 2018). Fig. 12 illustrates these two different processes on the mass-size plane. The red and blue shaded areas represent star-forming and quiescent populations, respectively. The arrows show how galaxies evolve on the mass-size plane relative to the bulk of the population when star-forming galaxies start to leave the main sequence to the time they are defined as quiescent.
Galaxies going through the slow process do not change their stellar masses and sizes much along with the SFRs (Fig. 12a). Galaxies can grow slightly in mass and size due to the residual star formation (Tacchella et al., 2015, 2018). Meanwhile, after the star-forming disk fades, the measured in optical wavelengths would become smaller because the light from star-forming galaxies in dominated by the disk component, which is more extended than the underlying mass profile. (Szomoru et al., 2013; Lang et al., 2014; Mosleh et al., 2017). Empirically, this change in size is found to be in general small (Szomoru et al., 2013; Mosleh et al., 2017). Overall, the newly-formed quiescent galaxies have masses and sizes similar to their progenitor star-forming galaxies and larger than pre-existing, older quiescent galaxies.
On the other hand, mechanisms that shut off the star formation rapidly ( a few hundred Myr) can produce quiescent galaxies much smaller than their progenitor star-forming galaxies. The mass increases due to intense star formation. The size, quantified as , can become a few times smaller because new stars form in the center of the galaxy (Hopkins et al., 2013; Wellons et al., 2015; Tacchella et al., 2016). The amount of change in mass and size depends on the properties of the progenitor (Hopkins et al., 2013; Dekel & Burkert, 2014; Blumenthal & Barnes, 2018).
4.2.4 The relative importance of different routes
The relative importance of different mechanisms likely depends on several factors. In the early universe, the merger rate is higher (Hopkins et al., 2010; Lotz et al., 2011; Xu et al., 2012; Rodriguez-Gomez et al., 2015; Man et al., 2016) and galaxies are gravitational unstable due to high gas fraction, rapid gas inflows and catastrophic events are more common (Dekel et al., 2009; Dekel & Burkert, 2014; Zolotov et al., 2015). Empirically, the abundance of massive PSB galaxies increases along with redshifts up to (Tran et al., 2004; Yan et al., 2009; Vergani et al., 2010; Wu et al., 2014; Wild et al., 2016; Maltby et al., 2018), which also suggests that the star formation in galaxies is more often shut off rapidly at higher redshifts.
The environment is another relevant factor. The fraction of PSB galaxies is larger in galaxy groups and clusters (Tran et al., 2003; Poggianti et al., 2009; Muzzin et al., 2012; Dressler et al., 2013; Wu et al., 2014; Paccagnella et al., 2018). The merger rates is higher in denser regions (Sobral et al., 2011). Moreover, in galaxy clusters, interstellar gas may be removed by interaction with dense intracluster medium, known as ram pressure stripping (Gunn & Gott, 1972). The ram pressure is weak outside galaxy groups and clusters but is considered as an indispensable mechanism in order to explain the high PSB fractions in galaxy clusters (Muzzin et al., 2014; Wu et al., 2014; Paccagnella et al., 2018). Only one PSB galaxy in our sample is a candidate cluster member (according to the catalog of X-ray clusters in the COSMOS field, Finoguenov et al., 2007). Our conclusion in this paper should apply to only field galaxies.
In addition, at low stellar masses, galaxies are prone to environmental effect and AGN and stellar feedback. Extra quenching mechanisms may be in effect and produce low-mass PSB galaxies (Maltby et al., 2018).
In reality, the evolutionary tracks of galaxies will not cleanly separate into slow and fast tracks but can fall anywhere in between. Regardless of the specific characteristics of any slow and fast tracks, our data unequivocally show that the relationship between star-formation history and structural evolution is complex and can vary strongly from one galaxy to another.
4.3 Systematic uncertainties
4.3.1 The effect of metallicity
Both Dn4000 and EW(H) depend on not only ages but also metallicities. In this paper, we interpret the dependence of indices on size as an effect of the age, assuming galaxies of the same masses having the same metallicity. In reality, the stellar mass-stellar metallicity relation of quiescent galaxies at shows a scatter of 0.16 dex (Gallazzi et al., 2014, see also Jørgensen et al. (2017)). The dependence of indices on size may alternatively be an effect of metallicity if the sizes and the metallicity are also correlated. Such a correlation has been observed in the local Universe (McDermid et al., 2015; Wu et al., 2015; Scott et al., 2017; Barone et al., 2018; Li et al., 2018) but not yet at higher redshifts.
Here we examine whether the variations in Dn4000 and EW(H) can be attributed to variations in metallicity (instead of age). We test the most extreme scenario in which the scatter in the mass-size relation corresponds one-to-one to the scatter in the mass-stellar metallicity relation.
We assign a fiducial metallicity to each galaxy based on the size:
| (4) |
This is based on the assumption that the 0.16 dex scatter in the metallicity is entirely due to the variation in the size (0.2 dex scatter, Section 2.5) and a galaxy with the median size has solar metallicity. We assign the same stellar age of 3 Gyr to all galaxies and produce mock spectra using Bruzual & Charlot (2003) SSP models then measure their Dn4000 and EW(H).
Fig. 13 shows how Dn4000 and EW(H) of the mock spectra vary with the size compared to the observed correlations. The similarity is striking, which immediately reveals that metallicity variation can play an important role. However, it is unlikely that the correlation between the size and the metallicity has no intrinsic scatter at all. The general trend we find in Section 3.2 that larger galaxies are younger than smaller galaxies is robust in a qualitative sense. But the metallicity dependence shows that the true correlation may be even weaker than what we find while assuming a fixed, solar metallicity.
Assuming the same 3 Gyr population, the metallicity needs to be to have Å, according to the model of Thomas et al. (2011). This metallicity is extremely low in comparison to the average () and has not yet been measured in galaxies at similar (Gallazzi et al., 2014; Jørgensen et al., 2017) or even higher redshifts (, Sommariva et al., 2012; Marques-Chaves et al., 2018). It is thus unlikely that the strong Balmer absorption in PSB galaxies is entirely due to low metallicities.
4.3.2 The effect of age gradient and slit loss
Our spectra are obtained with slits of 1” width, which corresponds to kpc at . For large face-on galaxies or those misaligned with slits, the spectra miss light from galaxy outskirts, likely consists of younger stellar populations (Szomoru et al., 2011; González Delgado et al., 2015; Goddard et al., 2017; Wang et al., 2017). The age obtained from the spectra may be thus biased old.
We test the potential bias using a subset of spectra that is spatially-resolved. We select 152 larger quiescent galaxies () whose major axes align with the slits () or face-on (). We measure the Dn4000 and EW(H) from the central 1” along the slit direction. The central Dn4000 is on average larger than integrating over the entire galaxy, suggesting the centers of galaxies are older. On the other hand, the difference in EW(H) is consistent with zero, Å. We conclude that our result in Sec 3.2, namely that on average larger galaxies are younger is qualitatively not affected and in fact would be strengthened by the bias introduced by the finite slit width.
We also confirm that the selection of PSB galaxies is not biased in the size; There is only one galaxy that would be defined as a PSB galaxy according to the integrated spectrum but not the central spectrum. Missing light at the outskirts of large galaxies does not result in a bias in the sizes of the PSB sample.
4.3.3 Stellar mass-to-light ratio of PSB galaxies
We measure the sizes using HST F814W images, which corresponds to the rest-frame B-band for galaxies at . The light of PSB galaxies is dominated by A-type stars, which may not necessarily trace the mass profiles well if the last episode of star-formation has distinct spatial distribution from the old stellar populations.
A few works have studied the sizes of PSB galaxies using HST F160W images but focusing on galaxies mainly at , sampling the redder part at the rest-frame optical regime (Belli et al., 2015; Yano et al., 2016; Almaini et al., 2017). These studies generally find that PSB galaxies are dex smaller than average quiescent galaxies. A more reliable size should be measured at longer rest-frame wavelengths, preferentially in rest-frame near-IR. The new ‘drift and shift’ observing mode of the HST WFC3 IR channel allows a much faster survey speed (Momcheva et al., 2017). We have obtained the F160W images of a large fraction of our sample and will examine the structures of galaxies in multiple wavelengths. For PSB galaxies at , it will require JWST to provide images at longer wavelengths.
5 Summary
In this paper, we present the size and age-sensitive spectral features (Dn4000 and EW(H)) of 467 quiescent galaxies with stellar masses at . We measure the sizes from HST F814W images and age indicators using the ultra-deep spectra from the LEGA-C survey. The high quality spectra allows us to measure age indicators accurately for individual galaxies.
At fixed stellar mass, the Dn4000 and EW(H) show large individual variations, distributed over a wide range of and , respectively. These ranges correspond to an age range of Gyr for a solar metallicity SSP. Nevertheless, we find a weak trend that larger galaxies have on average smaller Dn4000 and larger EW(H). Excluding the most compact galaxies, the variation in median Dn4000 and EW(H) is and Å, respectively. The corresponding age variation is Myr. On the contrary, quiescent galaxies with rapid declining star-formation rates (PSB galaxies) do not follow the general age-size correlation; They are among the youngest and much smaller than other young quiescent galaxies.
These two seemingly contradictory statements are often presented separately in the literature and raise some dispute in the formation and evolution of quiescent galaxies. We demonstrate that both observations are correct and only with a large sample of galaxies with high-quality spectra can reveal the complex correlation. While the bulk population have the Dn4000 and EW(H) suggesting that younger galaxies are on average larger, there is a small fraction of galaxies with elevated H absorption, indicating a rapid quenching star-formation history, that are small.
This correlation suggests that there are multiple evolutionary pathways to quiescence. Star-forming galaxies that slowly exhaust their cold gas reservoirs join the large side of the red sequence. These galaxies do not go through a PSB phase because the star-formation fades in a longer timescale. They can drive at least partially the size evolution of quiescent galaxies and produce the progenitor bias. On the other hand, violent events such as galaxy mergers or violent disk instabilities can produce PSB galaxies that are much smaller than their star-forming progenitors and even smaller than the existing quiescent population. The star-formation stops within a few hundred Myrs, accompanied with structural changes that shrink the sizes of galaxies.
References
- Almaini et al. (2017) Almaini, O., Wild, V., Maltby, D. T., et al. 2017, MNRAS, 472, 1401
- Baldry et al. (2004) Baldry, I. K., Glazebrook, K., Brinkmann, J., et al. 2004, ApJ, 600, 681
- Balogh et al. (1999) Balogh, M. L., Morris, S. L., Yee, H. K. C., Carlberg, R. G., & Ellingson, E. 1999, ApJ, 527, 54
- Barišić et al. (2017) Barišić, I., van der Wel, A., Bezanson, R., et al. 2017, ApJ, 847, 72
- Barnes & Hernquist (1996) Barnes, J. E., & Hernquist, L. 1996, ApJ, 471, 115
- Barnes & Hernquist (1991) Barnes, J. E., & Hernquist, L. E. 1991, ApJ, 370, L65
- Barone et al. (2018) Barone, T. M., D’Eugenio, F., Colless, M., et al. 2018, ArXiv e-prints, arXiv:1802.04807
- Barro et al. (2016) Barro, G., Kriek, M., Pérez-González, P. G., et al. 2016, ApJ, 827, L32
- Barro et al. (2017) —. 2017, ApJ, 851, L40
- Bell et al. (2004) Bell, E. F., Wolf, C., Meisenheimer, K., et al. 2004, ApJ, 608, 752
- Belli et al. (2015) Belli, S., Newman, A. B., & Ellis, R. S. 2015, ApJ, 799, 206
- Best et al. (2005) Best, P. N., Kauffmann, G., Heckman, T. M., et al. 2005, MNRAS, 362, 25
- Best et al. (2014) Best, P. N., Ker, L. M., Simpson, C., Rigby, E. E., & Sabater, J. 2014, MNRAS, 445, 955
- Bezanson et al. (2018) Bezanson, R., van der Wel, A., Pacifici, C., et al. 2018, ArXiv e-prints, arXiv:1804.02402
- Bigiel et al. (2011) Bigiel, F., Leroy, A. K., Walter, F., et al. 2011, ApJ, 730, L13
- Blumenthal & Barnes (2018) Blumenthal, K. A., & Barnes, J. E. 2018, MNRAS, 1533
- Bournaud et al. (2011) Bournaud, F., Chapon, D., Teyssier, R., et al. 2011, ApJ, 730, 4
- Bruzual & Charlot (2003) Bruzual, G., & Charlot, S. 2003, MNRAS, 344, 1000
- Calzetti et al. (2000) Calzetti, D., Armus, L., Bohlin, R. C., et al. 2000, ApJ, 533, 682
- Cappellari (2017) Cappellari, M. 2017, MNRAS, 466, 798
- Cappellari & Emsellem (2004) Cappellari, M., & Emsellem, E. 2004, PASP, 116, 138
- Cappellari et al. (2013) Cappellari, M., McDermid, R. M., Alatalo, K., et al. 2013, MNRAS, 432, 1862
- Carollo et al. (2013) Carollo, C. M., Bschorr, T. J., Renzini, A., et al. 2013, ApJ, 773, 112
- Chabrier (2003) Chabrier, G. 2003, PASP, 115, 763
- Chauke et al. (2018) Chauke, P., van der Wel, A., Pacifici, C., et al. 2018, ArXiv e-prints, arXiv:1805.02568
- Cleveland & Devlin (1988) Cleveland, W. S., & Devlin, S. J. 1988, Journal of the American Statistical Association, 83, 596
- Croton et al. (2006) Croton, D. J., Springel, V., White, S. D. M., et al. 2006, MNRAS, 365, 11
- Dalcanton et al. (1997) Dalcanton, J. J., Spergel, D. N., & Summers, F. J. 1997, ApJ, 482, 659
- Dekel & Birnboim (2006) Dekel, A., & Birnboim, Y. 2006, MNRAS, 368, 2
- Dekel & Burkert (2014) Dekel, A., & Burkert, A. 2014, MNRAS, 438, 1870
- Dekel et al. (2009) Dekel, A., Birnboim, Y., Engel, G., et al. 2009, Nature, 457, 451
- Dressler & Gunn (1983) Dressler, A., & Gunn, J. E. 1983, ApJ, 270, 7
- Dressler et al. (2013) Dressler, A., Oemler, Augustus, J., Poggianti, B. M., et al. 2013, ApJ, 770, 62
- Dressler et al. (1999) Dressler, A., Smail, I., Poggianti, B. M., et al. 1999, The Astrophysical Journal Supplement Series, 122, 51
- Efstathiou (2000) Efstathiou, G. 2000, MNRAS, 317, 697
- Ellison et al. (2018) Ellison, S. L., Catinella, B., & Cortese, L. 2018, MNRAS, 1184
- Fabian (2012) Fabian, A. C. 2012, Annual Review of Astronomy and Astrophysics, 50, 455
- Fagioli et al. (2016) Fagioli, M., Carollo, C. M., Renzini, A., et al. 2016, ApJ, 831, 173
- Finoguenov et al. (2007) Finoguenov, A., Guzzo, L., Hasinger, G., et al. 2007, The Astrophysical Journal Supplement Series, 172, 182
- Franzetti et al. (2007) Franzetti, P., Scodeggio, M., Garilli, B., et al. 2007, A&A, 465, 711
- Gabor & Bournaud (2013) Gabor, J. M., & Bournaud, F. 2013, MNRAS, 434, 606
- Gallazzi et al. (2014) Gallazzi, A., Bell, E. F., Zibetti, S., Brinchmann, J., & Kelson, D. D. 2014, ApJ, 788, 72
- Genel et al. (2018) Genel, S., Nelson, D., Pillepich, A., et al. 2018, MNRAS, 474, 3976
- Genzel et al. (2015) Genzel, R., Tacconi, L. J., Lutz, D., et al. 2015, ApJ, 800, 20
- Goddard et al. (2017) Goddard, D., Thomas, D., Maraston, C., et al. 2017, MNRAS, 466, 4731
- González Delgado et al. (2015) González Delgado, R. M., García-Benito, R., Pérez, E., et al. 2015, A&A, 581, A103
- Gunn & Gott (1972) Gunn, J. E., & Gott, J. Richard, I. 1972, ApJ, 176, 1
- Haines et al. (2017) Haines, C. P., Iovino, A., Krywult, J., et al. 2017, A&A, 605, A4
- Hopkins et al. (2013) Hopkins, P. F., Cox, T. J., Hernquist, L., et al. 2013, MNRAS, 430, 1901
- Hopkins et al. (2006) Hopkins, P. F., Hernquist, L., Cox, T. J., et al. 2006, The Astrophysical Journal Supplement Series, 163, 1
- Hopkins et al. (2008) Hopkins, P. F., Hernquist, L., Cox, T. J., & Kereš, D. 2008, ApJS, 175, 356
- Hopkins et al. (2010) Hopkins, P. F., Bundy, K., Croton, D., et al. 2010, ApJ, 715, 202
- Huang et al. (2012) Huang, S., Haynes, M. P., Giovanelli, R., & Brinchmann, J. 2012, ApJ, 756, 113
- Jørgensen et al. (2017) Jørgensen, I., Chiboucas, K., Berkson, E., et al. 2017, AJ, 154, 251
- Kauffmann et al. (2003) Kauffmann, G., Heckman, T. M., White, S. D. M., et al. 2003, MNRAS, 341, 33
- Kaviraj et al. (2007) Kaviraj, S., Kirkby, L. A., Silk, J., & Sarzi, M. 2007, MNRAS, 382, 960
- Keating et al. (2015) Keating, S. K., Abraham, R. G., Schiavon, R., et al. 2015, ApJ, 798, 26
- Kereš et al. (2005) Kereš, D., Katz, N., Weinberg, D. H., & Davé, R. 2005, MNRAS, 363, 2
- Kriek et al. (2009) Kriek, M., van Dokkum, P. G., Labbé, I., et al. 2009, ApJ, 700, 221
- Kriek et al. (2010) Kriek, M., Labbé, I., Conroy, C., et al. 2010, ApJ, 722, L64
- Lang et al. (2014) Lang, P., Wuyts, S., Somerville, R. S., et al. 2014, ApJ, 788, 11
- Le Borgne et al. (2006) Le Borgne, D., Abraham, R., Daniel, K., et al. 2006, ApJ, 642, 48
- Le Fèvre et al. (2003) Le Fèvre, O., Saisse, M., Mancini, D., et al. 2003, in Proc. SPIE, Vol. 4841, Instrument Design and Performance for Optical/Infrared Ground-based Telescopes, ed. M. Iye & A. F. M. Moorwood, 1670–1681
- Lemaux et al. (2010) Lemaux, B. C., Lubin, L. M., Shapley, A., et al. 2010, ApJ, 716, 970
- Lemaux et al. (2017) Lemaux, B. C., Tomczak, A. R., Lubin, L. M., et al. 2017, MNRAS, 472, 419
- Leroy et al. (2008) Leroy, A. K., Walter, F., Brinks, E., et al. 2008, AJ, 136, 2782
- Li et al. (2018) Li, H., Mao, S., Cappellari, M., et al. 2018, ArXiv e-prints, arXiv:1802.01819
- Lilly & Carollo (2016) Lilly, S. J., & Carollo, C. M. 2016, ApJ, 833, 1
- Lotz et al. (2011) Lotz, J. M., Jonsson, P., Cox, T. J., et al. 2011, ApJ, 742, 103
- Maltby et al. (2018) Maltby, D. T., Almaini, O., Wild, V., et al. 2018, MNRAS, 480, 381
- Man et al. (2016) Man, A. W. S., Zirm, A. W., & Toft, S. 2016, ApJ, 830, 89
- Marques-Chaves et al. (2018) Marques-Chaves, R., Pérez-Fournon, I., Gav azzi, R., et al. 2018, ApJ, 854, 151
- McDermid et al. (2015) McDermid, R. M., Alatalo, K., Blitz, L., et al. 2015, MNRAS, 448, 3484
- Mihos & Hernquist (1994) Mihos, J. C., & Hernquist, L. 1994, ApJ, 437, L47
- Mihos et al. (1997) Mihos, J. C., McGaugh, S. S., & de Blok, W. J. G. 1997, ApJ, 477, L79
- Momcheva et al. (2017) Momcheva, I. G., van Dokkum, P. G., van der Wel, A., et al. 2017, Publications of the Astronomical Society of the Pacific, 129, 015004
- Moresco et al. (2013) Moresco, M., Pozzetti, L., Cimatti, A., et al. 2013, A&A, 558, A61
- Mosleh et al. (2017) Mosleh, M., Tacchella, S., Renzini, A., et al. 2017, ApJ, 837, 2
- Muzzin et al. (2012) Muzzin, A., Wilson, G., Yee, H. K. C., et al. 2012, ApJ, 746, 188
- Muzzin et al. (2013) Muzzin, A., Marchesini, D., Stefanon, M., et al. 2013, ApJ, 777, 18
- Muzzin et al. (2014) Muzzin, A., van der Burg, R. F. J., McGee, S. L., et al. 2014, ApJ, 796, 65
- Paccagnella et al. (2018) Paccagnella, A., Vulcani, B., Poggianti, B. M., et al. 2018, ArXiv e-prints, arXiv:1805.11475
- Paulino-Afonso et al. (2017) Paulino-Afonso, A., Sobral, D., Buitrago, F., & Afonso, J. 2017, MNRAS, 465, 2717
- Peng et al. (2010) Peng, C. Y., Ho, L. C., Impey, C. D., & Rix, H.-W. 2010, AJ, 139, 2097
- Pillepich et al. (2018) Pillepich, A., Springel, V., Nelson, D., et al. 2018, MNRAS, 473, 4077
- Poggianti et al. (2009) Poggianti, B. M., Aragón-Salamanca, A., Zaritsky, D., et al. 2009, ApJ, 693, 112
- Poggianti et al. (2013) Poggianti, B. M., Calvi, R., Bindoni, D., et al. 2013, ApJ, 762, 77
- Popping et al. (2015) Popping, G., Caputi, K. I., Trager, S. C., et al. 2015, MNRAS, 454, 2258
- Popping et al. (2017) Popping, G., Decarli, R., Man, A. W. S., et al. 2017, A&A, 602, A11
- Rodriguez-Gomez et al. (2015) Rodriguez-Gomez, V., Genel, S., Vogelsberger, M., et al. 2015, MNRAS, 449, 49
- Saintonge et al. (2011) Saintonge, A., Kauffmann, G., Wang, J., et al. 2011, MNRAS, 415, 61
- Schawinski et al. (2014) Schawinski, K., Urry, C. M., Simmons, B. D., et al. 2014, MNRAS, 440, 889
- Schiminovich et al. (2010) Schiminovich, D., Catinella, B., Kauffmann, G., et al. 2010, MNRAS, 408, 919
- Schruba et al. (2011) Schruba, A., Leroy, A. K., Walter, F., et al. 2011, AJ, 142, 37
- Scott et al. (2017) Scott, N., Brough, S., Croom, S. M., et al. 2017, MNRAS, 472, 2833
- Scoville et al. (2007) Scoville, N., Abraham, R. G., Aussel, H., et al. 2007, ApJS, 172, 38
- Shankar et al. (2010) Shankar, F., Marulli, F., Bernardi, M., et al. 2010, MNRAS, 403, 117
- Shen et al. (2003) Shen, S., Mo, H. J., White, S. D. M., et al. 2003, MNRAS, 343, 978
- Sijacki et al. (2007) Sijacki, D., Springel, V., Di Matteo, T., & Hernquist, L. 2007, MNRAS, 380, 877
- Siudek et al. (2017) Siudek, M., Małek, K., Scodeggio, M., et al. 2017, A&A, 597, A107
- Smercina et al. (2018) Smercina, A., Smith, J. D. T., Dale, D. A., et al. 2018, ApJ, 855, 51
- Snyder et al. (2011) Snyder, G. F., Cox, T. J., Hayward, C. C., Hernquist, L., & Jonsson, P. 2011, ApJ, 741, 77
- Sobral et al. (2011) Sobral, D., Best, P. N., Smail, I., et al. 2011, MNRAS, 411, 675
- Sommariva et al. (2012) Sommariva, V., Mannucci, F., Cresci, G., et al. 2012, A&A, 539, A136
- Springel et al. (2005) Springel, V., Di Matteo, T., & Hernquist, L. 2005, ApJ, 620, L79
- Strateva et al. (2001) Strateva, I., Ivezić, Ž., Knapp, G. R., et al. 2001, AJ, 122, 1861
- Szomoru et al. (2011) Szomoru, D., Franx, M., Bouwens, R. J., et al. 2011, ApJ, 735, L22
- Szomoru et al. (2013) Szomoru, D., Franx, M., van Dokkum, P. G., et al. 2013, ApJ, 763, 73
- Tacchella et al. (2016) Tacchella, S., Dekel, A., Carollo, C. M., et al. 2016, MNRAS, 458, 242
- Tacchella et al. (2015) Tacchella, S., Carollo, C. M., Renzini, A., et al. 2015, Science, 348, 314
- Tacchella et al. (2018) Tacchella, S., Carollo, C. M., Förster Schreiber, N. M., et al. 2018, ApJ, 859, 56
- Tacconi et al. (2013) Tacconi, L. J., Neri, R., Genzel, R., et al. 2013, ApJ, 768, 74
- Tacconi et al. (2018) Tacconi, L. J., Genzel, R., Saintonge, A., et al. 2018, ApJ, 853, 179
- Terrazas et al. (2016) Terrazas, B. A., Bell, E. F., Henriques, B. M. B., et al. 2016, ApJ, 830, L12
- Terrazas et al. (2017) Terrazas, B. A., Bell, E. F., Woo, J., & Henriques, B. M. B. 2017, ApJ, 844, 170
- Thomas et al. (2011) Thomas, D., Maraston, C., & Johansson, J. 2011, MNRAS, 412, 2183
- Tran et al. (2003) Tran, K.-V. H., Franx, M., Illingworth, G., Kelson, D. D., & van Dokkum, P. 2003, ApJ, 599, 865
- Tran et al. (2004) Tran, K.-V. H., Franx, M., Illingworth, G. D., et al. 2004, ApJ, 609, 683
- Trujillo et al. (2007) Trujillo, I., Conselice, C. J., Bundy, K., et al. 2007, MNRAS, 382, 109
- Trujillo et al. (2011) Trujillo, I., Ferreras, I., & de La Rosa, I. G. 2011, MNRAS, 415, 3903
- van der Wel et al. (2009) van der Wel, A., Bell, E. F., van den Bosch, F. C., Gallazzi, A., & Rix, H.-W. 2009, ApJ, 698, 1232
- van der Wel et al. (2012) van der Wel, A., Bell, E. F., Häussler, B., et al. 2012, ApJS, 203, 24
- van der Wel et al. (2014) van der Wel, A., Franx, M., van Dokkum, P. G., et al. 2014, ApJ, 788, 28
- van der Wel et al. (2016) van der Wel, A., Noeske, K., Bezanson, R., et al. 2016, ApJS, 223, 29
- van Dokkum & Franx (2001) van Dokkum, P. G., & Franx, M. 2001, ApJ, 553, 90
- Vergani et al. (2008) Vergani, D., Scodeggio, M., Pozzetti, L., et al. 2008, A&A, 487, 89
- Vergani et al. (2010) Vergani, D., Zamorani, G., Lilly, S., et al. 2010, A&A, 509, A42
- Wang et al. (2017) Wang, E., Li, C., Xiao, T., et al. 2017, ArXiv e-prints, arXiv:1710.07569
- Wellons et al. (2015) Wellons, S., Torrey, P., Ma, C.-P., et al. 2015, MNRAS, 449, 361
- Whitaker et al. (2012) Whitaker, K. E., van Dokkum, P. G., Brammer, G., & Franx, M. 2012, ApJ, 754, L29
- Wild et al. (2016) Wild, V., Almaini, O., Dunlop, J., et al. 2016, MNRAS, 463, 832
- Wild et al. (2009) Wild, V., Walcher, C. J., Johansson, P. H., et al. 2009, MNRAS, 395, 144
- Williams et al. (2017) Williams, C. C., Giavalisco, M., Bezanson, R., et al. 2017, ApJ, 838, 94
- Williams et al. (2010) Williams, R. J., Quadri, R. F., Franx, M., et al. 2010, ApJ, 713, 738
- Willmer et al. (2006) Willmer, C. N. A., Faber, S. M., Koo, D. C., et al. 2006, ApJ, 647, 853
- Worthey & Ottaviani (1997) Worthey, G., & Ottaviani, D. L. 1997, ApJS, 111, 377
- Wu (2018) Wu, P.-F. 2018, MNRAS, 473, 5468
- Wu et al. (2014) Wu, P.-F., Gal, R. R., Lemaux, B. C., et al. 2014, ApJ, 792, 16
- Wu et al. (2015) Wu, P.-F., Kudritzki, R.-P., Tully, R. B., & Neill, J. D. 2015, ApJ, 810, 151
- Wu et al. (2018) Wu, P.-F., van der Wel, A., Gallazzi, A., et al. 2018, ApJ, 855, 85
- Xu et al. (2012) Xu, C. K., Zhao, Y., Scoville, N., et al. 2012, ApJ, 747, 85
- Yan et al. (2006) Yan, R., Newman, J. A., Faber, S. M., et al. 2006, ApJ, 648, 281
- Yan et al. (2009) —. 2009, MNRAS, 398, 735
- Yang et al. (2008) Yang, Y., Zabludoff, A. I., Zaritsky, D., & Mihos, J. C. 2008, ApJ, 688, 945
- Yano et al. (2016) Yano, M., Kriek, M., van der Wel, A., & Whitaker, K. E. 2016, ApJ, 817, L21
- Yesuf et al. (2014) Yesuf, H. M., Faber, S. M., Trump, J. R., et al. 2014, ApJ, 792, 84
- Zahid & Geller (2017) Zahid, H. J., & Geller, M. J. 2017, ApJ, 841, 32
- Zanella et al. (2016) Zanella, A., Scarlata, C., Corsini, E. M., et al. 2016, ApJ, 824, 68
- Zolotov et al. (2015) Zolotov, A., Dekel, A., Mandelker, N., et al. 2015, MNRAS, 450, 2327
Appendix A Using different definitions of quiescence
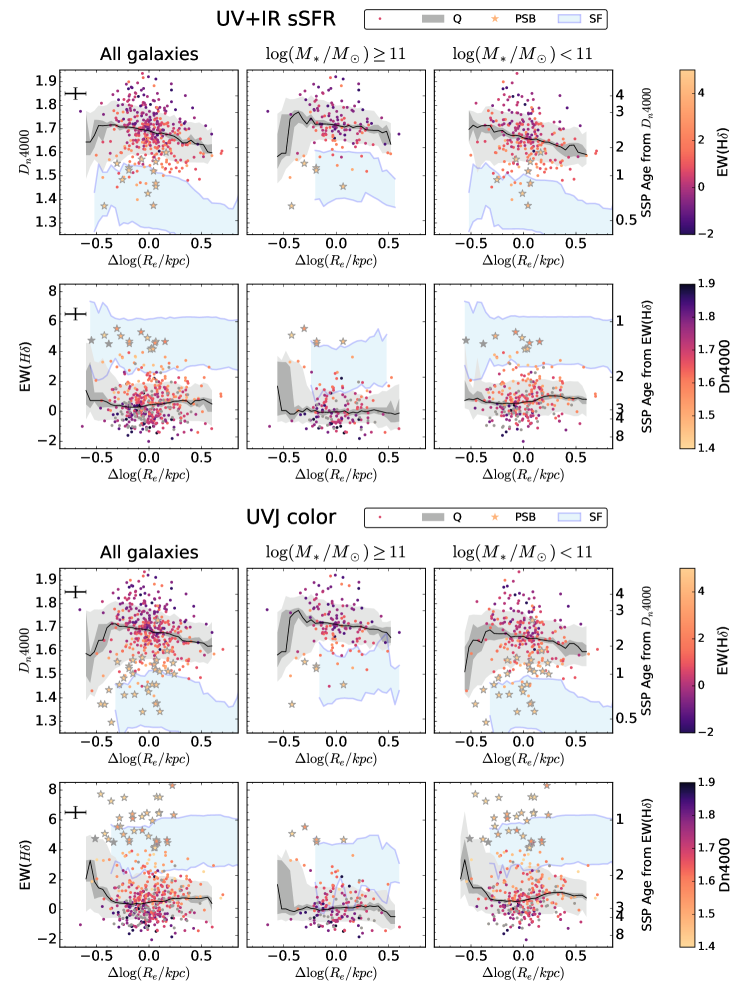
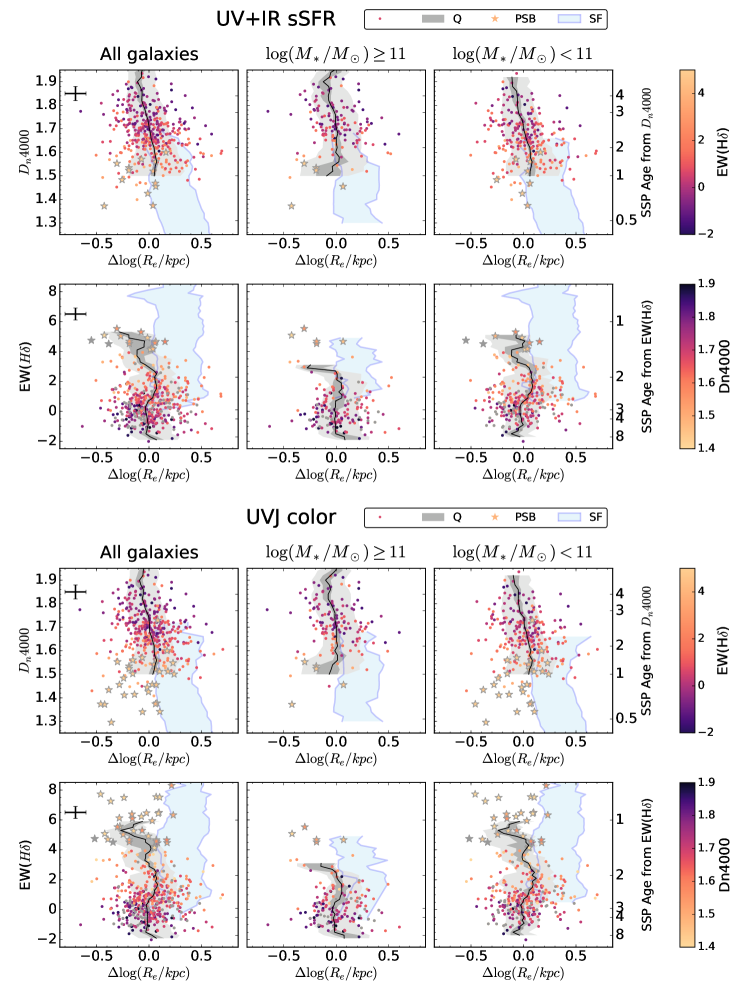
We repeat the analysis in Section 3 using quiescent galaxies selected by the sSFR and UVJ colors. Fig. 14 show the distributions of redshifts and stellar masses of each sample. Comparing to the EW(H) selection used in the main text, these two samples contains galaxies with . The best-fit parameters of the mass-size relation (Fig. 15) is listed in Table 2.
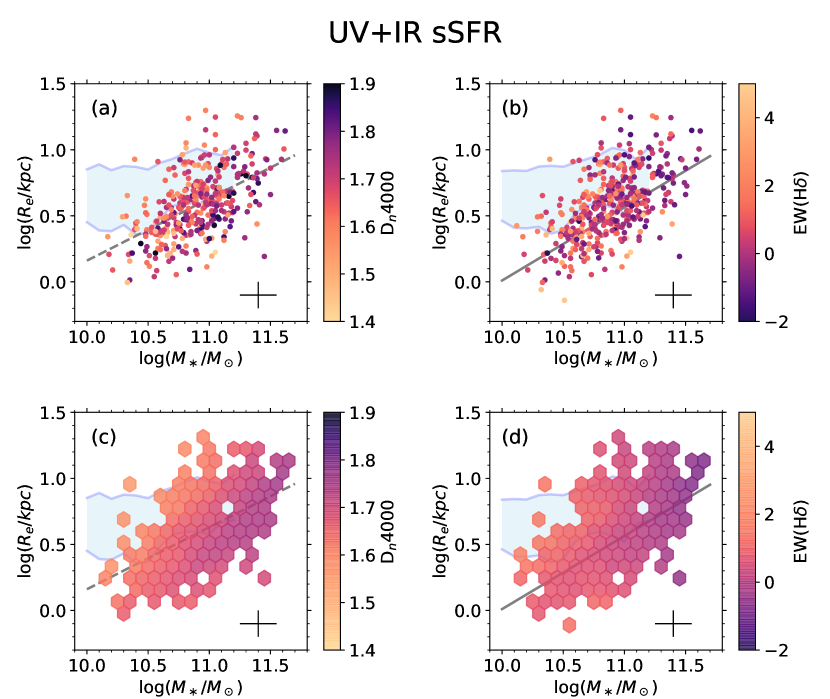
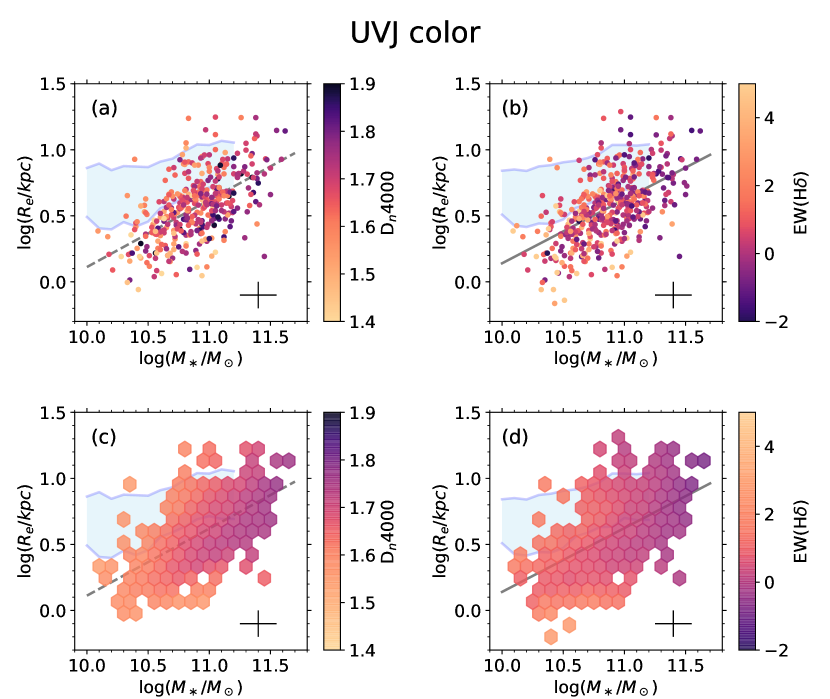
We find qualitative the same conclusions using different definitions of quiescence. More massive galaxies have larger Dn4000 and smaller EW(H) (Fig. 16, 17). Despite large individual variations, larger quiescent galaxies have on average smaller Dn4000 and larger EW(H), indicating younger stellar ages (Fig. 18, 20). On the other hand, PSB galaxies are not large quiescent galaxies and much smaller than star-forming galaxies (Fig. 19, 21).
| Selection | a | b |
|---|---|---|
| UV+IR sSFR | ||
| UV+IR sSFR, Dn4000 | ||
| UVJ color | ||
| UVJ color , Dn4000 |
-
•