Galaxy rotation curve from classical Cepheids
Abstract
The Galaxy rotation curve is usually assumed to be flat. However, some galaxies have rotation curves that are lower than the flat rotation curve. In our Galaxy the Keplerian rotation of interstellar clouds in the galactic longitude was observed.
We use a kinematic approach to derive the rotational velocity of classical Cepheids. The rotational velocity was calculated from radial velocity and from proper motion. The derived rotational velocities of Cepheids are between Keplerian rotation and the flat one. We fit a Galaxy rotation model consisting of a black hole, bulge, disk and halo to the rotation curve. The density of dark matter halo is at least 60% less than the value obtained from the flat rotation curve.
Institute of Theoretical Physics and Astrophysics, Faculty of Mathematics, Physics and Informatics,
University of Gdańsk, ul. Wita Stwosza 57,
80-308 Gdańsk, Poland
1 Introduction
The current consensus is a flat rotation curve of our Galaxy. Reid et al. (2014) have obtained flat rotation curve basing on proper motions and trigonometric parallaxes of masers associated with high-mass star forming regions. To sustain constant linear velocity dark matter must be present in our Galaxy.
The term ’dark matter’ first appeared in the paper by Kepteyn (1922). Later Zwicky (1933) has estimated that the density of dark matter is grater than the amount of visible matter. His estimations were based on velocities of galaxies in the Coma Cluster. Today we observe dark matter due to gravitational lensing of galaxy clusters. In cosmology, in the CDM model we have 26% of density in dark matter, and only 5% of density in barionic matter (Ade et al., 2016).
However, thare are many examples of rotation curves that are lower than the flat rotation curve. Jałocha et al. (2008) have obtained mass distribution of the M 94 galaxy basing on rotation curve, infrared luminosity and H I observations. The authors state that the obtained mass distribution leaves no much room (if any) for dark matter. In a sample of 45 spiral galaxies analyzed by Honma & Sofue (1997) 11 galaxies have Keplerian rotation curve. So about 1/4 of galaxies in their sample show Keplerian rotation.
Sikora et al. (2012) have analyzed microlensing events in the inner part of our Galaxy. The number of microlensing event is consistent with the amount of matter inferred from Galaxy rotation curve. Authors wrote: this result suggests that non-barionic mass component may be negligible in this region.
Galazutdinov et al. (2015) have analyzed the Galactic rotation basing on interstellar clouds. They have used interstellar Ca II absorption line to obtain both radial velocity and distance. They have analyzed only the direction and stated that the Galactic rotation curve outside of the Solar orbit in that direction is Keplerian.
The Galactic rotation of old open clusters was analyzed by Gnaciński & Młynik (2017). The rotation of old open clusters in the outer part of Galaxy agrees better with Keplerian curve than with flat rotation curve. They proposed an explanation of various (flat/Keplerian) results of Galaxy rotation curves. If the orbits of objects are non-circular and the formula for rotation velocity is derived with the assumption of circularity then we get a very large spread of velocities, similar to the observed ones. The non-circularity is justified by radial velocities measured in the Galactic anti-center. Furthermore, a star located 23 kpc from Galaxy center needs 1 Gyr for one rotation around Galaxy (assuming Keplerian rotation). So there may be to few revolutions to circularize the orbit.
In this paper we analyze the rotational velocities of classical Cepheids derived from radial velocities and from proper motions. We perform a fit of a Galaxy rotation model with dark matter halo to the Cepheids rotational velocities.
2 Data
This paper is based on Cepheids catalogue presented by Mel’nik et al. (2015). It is a compilation of measurements for 674 Cepheids. The catalogue includes periods, V-bands magnitude, heliocentric distances, heliocentric radial velocities and proper motions of classical Cepheids.
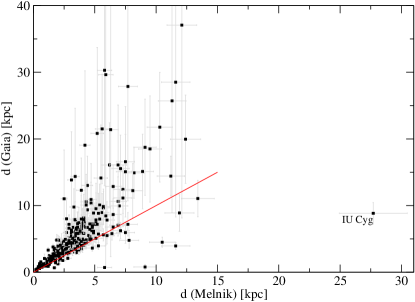
The proper motion in the Mel’nik et al. (2015) catalog comes from the Hipparcos catalog. We have used the proper motions from the latest Gaia Data Release 2 (DR2) catalog. The distances to Cepheids from the Mel’nik et al. (2015) catalog were compared to the distances obtained from Gaia parallaxes (fig. 1). There is a systematic difference between these distances. The Gaia DR2 distances are usually higher than the distances from Cepheids catalog. Moreover, there are problems with the Gaia distances, like negative parallaxes, parallaxes with errors greater than the parallax itself or extremal large distances. Therefore we have used distances from the Mel’nik et al. (2015) catalog.
Lindegren (2018) have analyzed the astrometric solution of Gaia DR2 data. They found a zero point offset of parallaxes -29 as by analyzing the parallaxes of quasars. The zero point offset depends on magnitude, color and position. The comparison of Gaia DR2 parallaxes with external Cepheid catalogue was also performed by Arenou et al. (2018). The zero point offset of Gaia DR2 as compared to Cepheids distances equals to -31.9 as. They found also that there is no zero point offset of proper motion.
The Gaia DR2 parallaxes of Cepheids were compared to parallaxes obtaind from HST photometry by Riess et al. (2018). The measured zero point offsets is -46 as. The found also, that the Gaia DR2 parallaxes for bright Cepheids G6 mag are unreliable because of Gaia’s detectors saturation.
We have used the Sun – Galactic Center distance and the Sun velocity of (Honma et al., 2012, 2015; Sofue, 2017). The rotation velocity of Cepheids was fitted with the Sofue (2015) Galactic rotation curve model. The model consists of central black hole, exponential spherical bulge, exponential disk and halo (Sofue, 2015, 2017). The halo density is given by
| (1) |
with the mass enclosed in radius R
| (2) |
We have used only the mass inside the Galactic center – Sun distance to calculate the Keplerian curve. Using and we got . The Keplerian curve is used for comparison on rotational velocity plots.
According to Bovy et al. (2009) the masers associated with massive star forming regions that are located in the spiral arms are past the apocenter of their orbits. However, McMillan & Binney (2010) argued that the systematic differences in maser velocities are caused by underestimation of solar velocity in the LSR. We assume that no large–scale systematic motion is present in the Cepheids sample. Numerical simulations of Galaxy evolution by Baba et al. (2009) shows that star forming regions and young stars exhibit large non-circular motions. Their motion may be synchronized in a fragment of a spiral arm. Our stars are distributed uniformly in all directions and the average velocities should not be affected by small scale systematic motion.
3 Rotation curve derived from radial velocity
Only 324 of 674 Cepheids catalogued by Mel’nik et al. (2015) have measurements of heliocentric radial velocities. The line-of-sight velocities (-velocities) were converted to the Local Standard of Rest (LSR) velocities:
| (3) |
where is the Sun velocity vector, and are Galactic coordinates of the star. We have considered two values of Sun velocity in the Local Standard of Rest (LSR) from Schönrich et al. (2010), and from Dehnen & Binney (1998).
The rotational velocity was calculated using formula derived for circular orbits (eg. Bhattacharjee et al., 2014)
| (4) |
The star distance is the projection of galactocentric distance on the galactic plane
| (5) |
where is the heliocentric distance to Cepheid. According to Mel’nik et al. (2015) the distances to Cepheids are known with the accuracy of about 10%. We have used this value in our error calculations.
Monte–Carlo simulations (see Gnaciński & Młynik, 2017) of stars on elliptical orbits with Keplerian motion shows that even for huge eccentricities ( distributed uniformly in the range ) the binned average of velocity stays close to the assumed Keplerian rotation curve. This justifies that the calculation of average velocity makes sense even for non-circular motion.
The stars located near Galactic center () and antycenter () must be excluded from the analysis, because the in the denominator of eq. 4 leads to unphysical velocities (larger than the escape velocity from our Galaxy). No cutoff was performed basing on the distance to galactic plane .
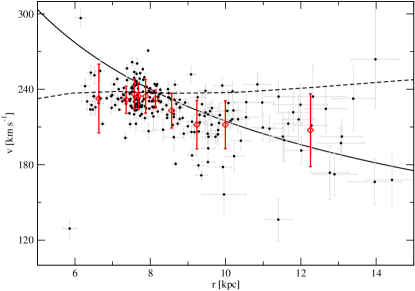
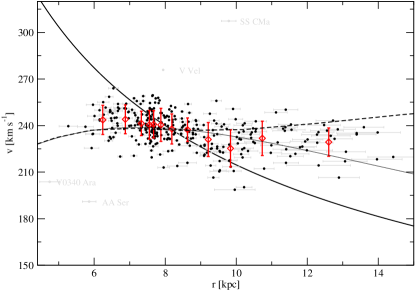
The linear rotation velocities derived from radial velocities are presented on figure 2. The rotation velocities were calculated using the from Dehnen & Binney (1998). The values from Schönrich et al. (2010) gives velocities closer to the flat rotation curve.
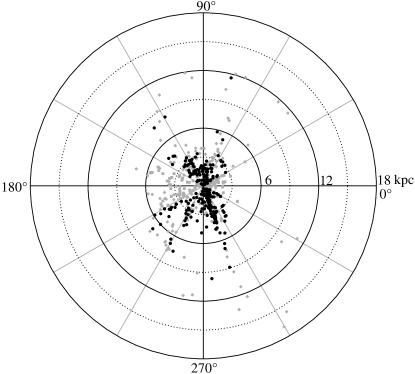
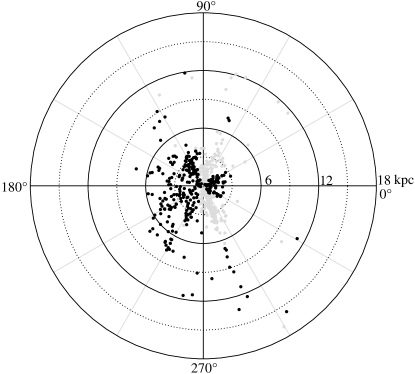
The binned averages of velocity on figure 2 are calculated from 24 successive points. The averages are shown together with their standard deviations. Note that stars with galactocentric distance less than have average velocity close to flat rotation curve, while further stars have average velocities located close to the Keplerian rotation curve. The distribution of analysed Cepheids in the Galactic disk is shown on figure 3.
4 Rotation curve derived from proper motion
The Gaia DR2 catalog (Lindegren, 2018) has proper motions for 498 Cepheids out of 674 in the Mel’nik et al. (2015) catalog. The velocity of Galaxy rotation was calculated using standard formula (derived with the assumption of circular orbits):
| (6) |
where and is the proper motion in galactic longitude multiplied by . The stars with small denominator in eq. 6 were excluded from the analysis, because small denominator leads to nonphysically large velocities.
Five stars were excluded from further analysis. The star V979 Aql was excluded because of negative rotation velocity. Stars IU Cyg, SS CMa, IX Cas and DQ And are outliers. Also 7 stars more distant than 500 pc from the galactic plane were excluded. We have used the Sun distance from Galactic plane , which is the median value from 56 estimations presented by Karim (2016).
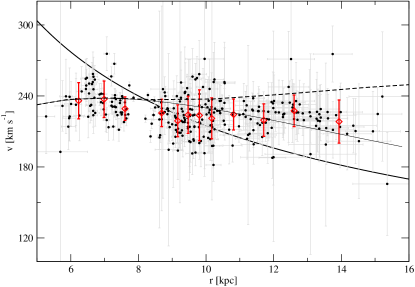
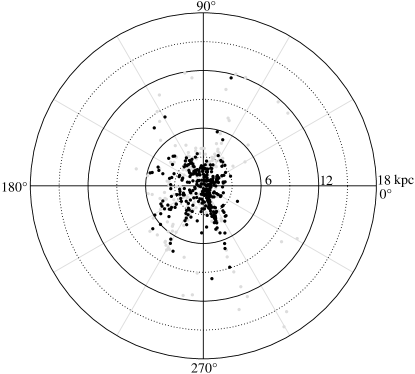
Figure 4 presents linear rotation velocities obtained from Cepheids proper motion. Averages and their standard deviation are calculated from 25 successive points. Figure 5 shows the space distribution of Cepheids used in our analysis. Note that the stars cover the region near and which was excluded in the radial velocity analysis (section 3). The are exactly 100 stars common in the rotational velocity calculations from radial velocity and from the proper motion.
5 3D velocity vector
For stars with radial velocities and proper motion we have calculated the three dimensional velocity vector using the formulas from Reid et al. (2009). There were 318 stars for which the velocity vector could be calculated. Four outliers were removed from further analysis: SS CMa, V Vel, AA Ser, V340 Ara.
The 3D rotation velocity vector was calculated once using the Sun velocity in the Local Standard of Rest (LSR) from Schönrich et al. (2010), and second time using from Dehnen & Binney (1998). The circular velocities of 3D velocity vector are presented on figure 6. Averages were calculated for 26 successive points. The positions of Cepheids with 3D velocity vector are shown on figure 7.
6 Results and discussion
| Data | stars | ||
|---|---|---|---|
| Vcirc from 3D V vector | 160 | 8% | |
| Vcirc from 3D V vector | 160 | 40% | |
| V from proper motion | |||
| AND | 228 | 15% | |
| V from radial velocity | |||
| AND AND | 120 | – | |
| V from radial velocity | |||
| AND AND | 120 | – |
Radial velocity, proper motions and circular component of the 3D velocity vector leads to rotation velocities that are between the Keplerian rotation curve and the flat one. The outer parts of our Galaxy rotate slower than the flat rotation curve.
Monte-Carlo simulations show, that the rotation velocity derived from proper motion in the case of non-circular motion is more accurate, than the rotation velocity derived from radial velocity. Although the 3D velocity gives us the whole information about the velocity vector, the rotational velocity derived from proper motion gives us larger sample of stars. Some of the additional stars are located further from galactic center than the stars for which we have full 3D velocity information.
We have constructed Galaxy rotation data consisting of Sofue (2015) rotation curve up to 8 kpc from the galactic center and from individual velocities for kpc. The velocities were calculated from radial velocities, proper motion and 3D velocity vector. We use the inner rotation curve from Sofue (2015), because the tangent point method used to determine rotation velocity is the most accurate one. We give the weight 1000 to the points from Sofue (2015) rotation curve, because we want to match the Sofue’s model in the region kpc.
The parameter cannot be estimated from the inner rotation curve, because in this region the rotational velocity is dominated by stellar components (bulge and disk). We have kept the halo scale radius fixed to kpc as given by Sofue (2015).
Various galaxy components influence the rotation velocity at different distances from the Galaxy center. Therefore, the fitting of rotation curve was performed in three steps. First we fitted the central black hole and bulge. Next the bulge and disk up to 8 kpc. Then the disk from 2.7 kpc and our velocities were fitted. This procedure was repeated with different distance boundaries to fit the bulge, leading to different bulge masses. The resulting halo densities are presented in table 1.
In the case of circular velocity derived from 3D velocity vector and solar motion from Dehnen & Binney (1998) we got halo density variations of 4 orders of magnitude. Therefore we give only the upper limit of in this case.
The rotational velocities derived from radial velocities lead to rotation curves with almost zero halo density. However this curves are very sensitive to noncircular motion.
The rotational velocities from proper motions are less sensitive to noncircular motion (Gnaciński & Młynik, 2017). It is also the biggest sample in our analysis – 228 stars further than . The Galaxy rotation model fitted to proper motion velocities has halo density , that is 15% of the Sofue (2015) value.
Also the fittings of Galaxy rotation model to circular component of 3D velocity vector (solar LSR velocity from Schönrich et al., 2010) gives repeatable results with M☉ pc-3. It is 40% of halo density by Sofue (2015) for the flat rotation curve. At the Sun distance this halo density equals to M☉ pc-3 or GeV cm-3.
The inner rotation curve is usually determined using the tangent point method. Numerical simulations by Chemin et al. (2015) shows that the bump at the rotation curve below 1 kpc may be caused by the Galaxy bar and does not reflect the true rotation velocity. However, for distances larger than 5 kpc from Galaxy center both the rotation curve and velocity from bulge are not affected by the bar placement. Since we fit our velocity points for kpc the details of bulge/bar placement are not significant for our results.
The analysis of Hipparcos proper motions of 220 Cepheids by Feast & Whitelock (1997) suggests that the Galactic rotation curve declines at the solar distance. The dynamical approach to derive rotation curve was used by Eilers et al. (2019). They used over 23 000 red giants with APOGEE, WISE, 2MASS and Gaia data. Their velocity curve is declining and the derived local dark matter density equals to GeV cm-3.
Recently Mróz et al. (2019) have also analyzed Galaxy rotation curve basing on classical Cepheids. Their rotation curve is also located below the Sofue’s rotation curve, and the outer rotation curve is declining. They did not estimate the halo density. They use median Gaia velocities instead of systemic radial velocities of Cepheids. The difference between the median Gaia velocities used by Mróz et al. (2019) and systemic velocities given by Mel’nik et al. (2015) varies between -25 and +46.7 km/s.
7 Conclusions
Our kinematic approach to Galaxy rotation curve leads to declining rotation curve, that is located below the flat rotation curve by Sofue (2015).
The main results are:
-
•
The rotation velocities of classical Cepheids derived from radial velocities, from proper motion (Gaia DR2) and from three dimensional velocity vector are located between the flat and Keplerian rotation curves.
-
•
The Galaxy rotation model fitted to the rotation velocities gives halo density at least 60% less than the density calculated from the flat rotation curve.
-
•
Lower values of in the LSR leads to lower (or zero) halo density.
Acknowledgments
This research has made use of the SIMBAD database, operated at CDS, Strasbourg, France (Wanger, 2000). This work has made use of data from the European Space Agency (ESA) mission Gaia (https://www.cosmos.esa.int/gaia), processed by the Gaia Data Processing and Analysis Consortium (DPAC, https://www.cosmos.esa.int/web/gaia/dpac/consortium). Funding for the DPAC has been provided by national institutions, in particular the institutions participating in the Gaia Multilateral Agreement.
References
- Ade et al. (2016) Ade P. A. R., Aghanim N., Arnaud M. et al., 2016, A&A, 594, A13
- Arenou et al. (2018) Arenou F., Luri X., Babusiaux C., Fabricius C. et al., 2018, A&A, 616, A17
- Baba et al. (2009) Baba J. et al., 2009, ApJ, 706:471
- Bhattacharjee et al. (2014) Bhattacharjee P., Chaudhury S., Kundu S., 2014, ApJ, 785:63
- Bovy et al. (2009) Bovy J., Hogg D.W., Rix H.–W., 2009, ApJ, 704:1704
- Chemin et al. (2015) Chemin L., Renaud F., Soubiran C., 2015, A&A, 578, A14
- Dehnen & Binney (1998) Dehnen W., Binney J., 1998, MNRAS, 298, 387
- Eilers et al. (2019) Eilers A.-Ch., Hogg D.W., Rix H.-W., Ness M.K., 2019, ApJ, 291:120
- Feast & Whitelock (1997) Feast M., Whitelock P., 1997, MNRAS, 291, 683
- Galazutdinov et al. (2015) Galazutdinov G., Strobel A. et al., 2015, PASP, 127, 126
- Gnaciński & Młynik (2017) Gnaciński P., Młynik T., 2017, PASP, 129, 044101
- Honma & Sofue (1997) Honma M., Sofue Y., 1997, PASJ, 49, 539
- Honma et al. (2012) Honma M., Nagayama T., Ando K. et al., 2012, PASJ, 64, 136
- Honma et al. (2015) Honma M. et al., 2015, PASJ, 67, 70
- Jałocha et al. (2008) Jałocha J., Bratek Ł., Kutschera M., 2008, ApJ, 679:373
- Karim (2016) Karim M.T., Mamajek E.E., 2016, MNRAS, 465, 472
- Kepteyn (1922) Kepteyn J.C., 1922, ApJ, 55, 302
- Lindegren (2018) Lindegren L., Hermández J., Bombrun A., Klioner S et al., 2018, A&A, 616, A2
- McMillan & Binney (2010) McMillan P.J., Binney J.J., 2010, MNRAS, 402, 934
- Mel’nik et al. (2015) Mel’nik A.M., Rautianinen P. et al., 2015, AN, 336, 70
- Mróz et al. (2019) Mróz P., Udalski A. et al., 2019, ApJL, 870:L10
- Reid et al. (2014) Reid M.J., Menten K.M., Brunthaler A., Zheng X.W. et al., 2014, ApJ, 783:130
- Reid et al. (2009) Reid M.J., Menten K.M., Zheng X.W., Brunthaler A. et al., 2009, ApJ, 700:137
- Riess et al. (2018) Riess A.G., Casertano S., Yuan W., Macri L. et al., 2018, ApJ, 861:126
- Schönrich et al. (2010) Schönrich R., Binney J., Dehnen W., 2010, MNRAS, 403, 1829
- Sikora et al. (2012) Sikora S., Bratek Ł., Jałocha J., Kutschera M., 2012, A&A, 546, A126
- Sofue et al. (2009) Sofue Y., Honma M., Omodaka T., 2009, PASJ, 61, 227
- Sofue (2015) Sofue Y., 2015, PASJ, 67(4), 75
- Sofue (2017) Sofue Y., 2017, PASJ, 69(1), R1
- Wanger (2000) Wanger M. et al., 2000, A&AS1439
- Zwicky (1933) Zwicky F., 1933, AcHPh, 6, 110