(2) Max-Planck-Institut für Astronomie, Königstuhl 17, 69117 Heidelberg, Germany
Surface waves in protoplanetary disks induced by outbursts:
Concentric rings in scattered light
Context: Vertically hydrostatic protoplanetary disk models are based
on the assumption that the main heating source, stellar irradiation,
does not vary much with
time. However, it is known that accreting young stars are variable sources of
radiation. This is particularly evident for outbursting sources such as EX
Lupi and FU Orionis stars.
Aim: We investigate how such outbursts affect the vertical
structure of the outer regions of the protoplanetary disk,
in particular their appearance in scattered light at optical and
near-infrared wavelengths.
Methods: We employ the 3D FARGOCA radiation-hydrodynamics code,
in polar coordinates, to compute the time-dependent behavior
of the axisymmetric disk structure. The temperature is computed
self-consistently and time-dependently from the irradiation flux
using a two-stage radiative transfer method: first the direct illumination
is computed; then the diffuse radiation is treated with the flux-limited
diffusion method. The outbursting inner disk region is not included
explicitly. Instead, its luminosity is added to the stellar luminosity
and is thus included in the irradiation of the outer disk regions.
For time snapshots of interest we insert the density structure
into the RADMC-3D radiative transfer code and compute the appearance of
the disk at optical/near-infrared wavelengths, where we observe
stellar light that is scattered off the surface of the disk.
Results: We find that, depending on the amplitude of the outbursts,
the vertical structure of the disk can become highly dynamic, featuring
circular surface waves of considerable amplitude. These “hills” and
“valleys” on the disk’s surface show up in the scattered light images as
bright and dark concentric rings. Initially these rings are small and
act as standing waves, but they subsequently lead to outward propagating
waves, like the waves produced by a stone thrown into a pond. These waves
continue long after the actual outburst has died out.
Conclusions: Single, periodic, or quasiperiodic outbursts of the
innermost regions of protoplanetary disks will necessarily lead to wavy
structures on the surface of these disks at all radii. We propose that some
of the multi-ringed structures seen in optical/infrared images of several
protoplanetary disks may have their origin in outbursts that occurred
decades or centuries ago. However, the multiple rings seen at (sub-)millimeter
wavelengths in HL Tau and several other disks are not expected to be related to
such waves.
Key Words.:
accretion, accretion disks – circumstellar matter – stars: formation, pre-main-sequence – infrared: stars
1 Introduction
With high-contrast optical and near-infrared imaging using 8-meter class telescopes, it has become possible to obtain a detailed view of the surface structure of protoplanetary disks. This new view of protoplanetary disks reveals striking patterns, including single rings (e.g., Avenhaus et al., 2017) or multiple concentric rings (e.g., van Boekel et al., 2017), spirals (e.g., Benisty et al., 2017), warps (Marino et al., 2015), and moving shadows (Stolker et al., 2017). Sometimes the rings seen in these disks have a radial width that is narrower than the vertical scale height of the disk, for example in the case of RXJ 1615 (de Boer et al., 2016). Such structures are hard to explain as equilibrium structures in the disk, and are more suggestive of a surface wave phenomenon of some kind. The question is then, what could produce such waves?
The self-shadowing instability (D’Alessio et al., 1999; Dullemond, 2000; Watanabe & Lin, 2008; Siebenmorgen & Heymann, 2012) could be one possibility. This could either lead to inward-moving waves or to stationary-state waves, depending on the details of the disk structure and the central star.
In this Letter we propose an alternative explanation. We posit that protoplanetary disks will not be in hydrostatic equilibrium in their intermediate to outer regions () if the star and the inner disk regions () experience accretion outbursts of the EX Lupi or FU Orionis kind. Such outbursts would, for a period of half a year to many tens of years, heat the outer disk regions through irradiation. These regions will thus become overpressurized and will start to expand vertically. Once the outburst is over, the outer disk regions cool again. However, by this time, the disk gas is already in motion, and the return to the “normal” temperature comes too late, so to speak, to prevent the violent vertical oscillation of the disk gas. Given that the Kepler frequency is different at different radii, the vertical oscillation of the gas occurs on different timescales even though the entire disk experienced the same duration of the outburst.
We tested this hypothesis by numerical radiation-hydrodynamic simulations followed by diagnostic radiative transfer computations to compute the optical appearance of the disks.
2 Model
We use a modified version (Bitsch et al., 2014; Lega et al., 2014) of the legacy FARGO code (Masset, 2000), which is designed to model the hydrodynamics of protoplanetary disks. This modified version (hereafter FARGOCA) implements the stellar irradiation by radial ray-tracing of the stellar light followed by a flux-limited-diffusion treatment of the thermal radiation of the disk (Bitsch et al., 2013). It is implemented on a 3D grid in spherical coordinates . In this Letter we assume the disk to be axially symmetric, which reduces the problem effectively to 2D, with coordinates . For stability the irradiation is blocked within 7∘ of the midplane, mimicking the shadow cast by the unresolved innermost disk.
Before we can start the actual simulation, we need to find as an initial condition an unperturbed steady-state disk model. We do this by setting up an initial guess of a density and temperature distribution, and letting it undergo radiation-hydrodynamic relaxation. Our initial guess has a power law index for the surface density. We then get
| (1) |
where is the vertical distance from the midplane, approximately equal to . The quantity is an estimate of the vertical scale height of the disk at radius . We initialize the disk with a fair guess of the starting values, assuring that this initial guess has a flaring geometry, and then wait for the disk to reach hydrostatic equilibrium with irradiation and heating.
We use reflective boundaries in the -direction and in the radial direction at the inner edge of the disk. The radial outer boundary remains open. For numerical stability we introduce a floor density of .
We use a grid with 500 logarithmic spaced cells in -direction between 5.2 and 400 au. For we use 100 linearly spaced cells between and (the midplane), i.e., we model only the upper half of the disk.
For our initial guess setup we chose the surface density power law index , and a surface density value at the fiducial radius of . For the star we chose , , and . The opacity model used for the radiation-hydrodynamics is that from Bell & Lin (1994).
After relaxing the model to a quiescent state, requiring years of model time, we activated the outburst. Since the outburst occurs in the disk well within the inner radius of our model, we treated the outburst simply as an increase in the stellar luminosity by a given factor, lasting for a given time, after which the star returns to its original luminosity. For numerical stability we implemented a smoothed increase and decrease in luminosity. We then followed the evolution for over 1000 years after the outburst had ceased.
To compute scattered-light images, we post-processed our hydrodynamical simulation using the code package RADMC-3D (Dullemond et al., 2012). For a given distribution of dust, RADMC-3D calculates the scattered light image that would be observed using an instrument such as VLT/SPHERE. We calculated the dust opacities with a Mie code using the Draine (2003) optical constants, assuming a Gaussian distribution of dust grains with a mean size of and a width of .
Because the opacities of Draine (2003) and Bell & Lin (1994) are not fully compatible with each other, we increased the canonical dust-to-gas ratio for the RADMC-3D model by a factor of (leading to a dust-to-gas ratio of ), such that the Rosseland mean opacity computed from the Draine (2003) matches that of Bell & Lin (1994) for temperatures below about 150 K. In other words, instead of adding water ice to the opacity, for simplicity we adjusted the silicate abundance. Likewise, we adjusted the “stellar opacity” (the opacity of the dust grains at stellar wavelengths) used in FARGOCA to be consistent with the Draine (2003) opacity, leading to a gas+dust absorption opacity for stellar light at of .
3 Results
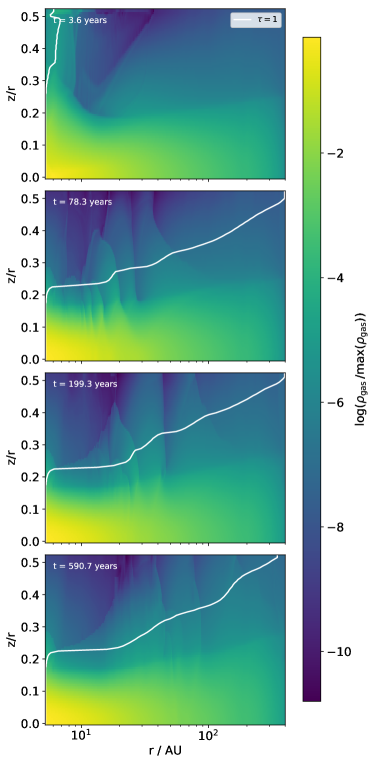
We show the results for an outburst with a duration of 1.89 years, during which the luminosity increases by a factor of 30. The resulting radial-vertical density structure of the disk at different epochs after the start of the outburst is shown in Fig. 1. It can be seen that the outburst, leading to heating of the disk, causes strong vertical expansion of the surface layers of the disk in a wavy manner. Once in motion, the expansion continues even after the end of the outburst. The wavy character of the expansion is, at least in part, due to the fact that at any radius the disk reacts roughly on the local Kepler timescale. While the outer disk regions are still vertically expanding, the inner regions have already collapsed and may already be bouncing back up. The vertical expansion leads to a vertical displacement of the surface of the short-wavelength radiation from the star. The wavy radial behavior of the vertical expansion/collapse/bounce-back thus leads to “mountains” and “valleys” on the disk surface.
Soon after the disk has been set in vertical motion, the waves also propagate outward. This wave is a combination of pressure wave (sound wave) and surface wave (gravity wave). In particular in the surface layers these waves are shocks. Their physical character is the same as the spiral waves induced by companions or planets, but they are radially outward moving, and manifest themselves as one or multiple concentric rings.
As can be seen in this figure, after about 200 years the inner regions of the disk (inward of 10 au) have calmed down, but the wave is still propagating in the regions beyond that. After 590 years the surface layers of the outer disk regions (100 – 400 ) are still vertically expanding due to the outburst heating event and the outward propagating wave has reached about 90 .
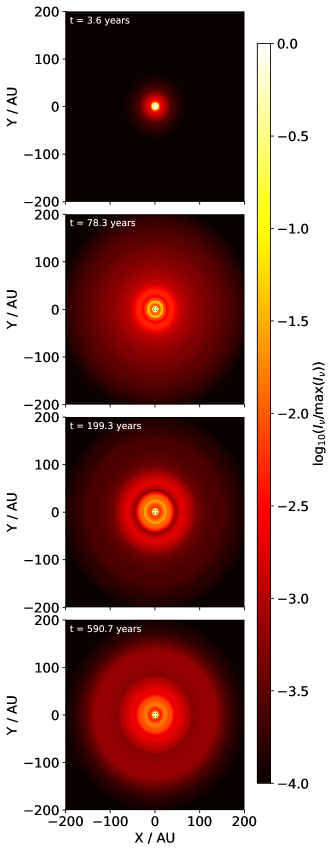
The scattered light images computed for the same time snapshots as in Fig. 1 are shown in Fig. 2. They show that the ringlike mountains and valleys have sunny sides and shadowed sides, visible as bright and dark rings in the images. The contrast between peaks and valleys in the image are on the order of a factor of two to four. For comparison, the contrast of the rings seen in the scattered light image of TW Hydra (van Boekel et al., 2017) is on the order of a factor of two, and for RXJ 1615 (de Boer et al., 2016) it is, depending on the ring/valley pair, on the order of tens of percent to a factor of 5 to 10. The order of magnitude of the ring contrast thus appears to match the observations of these sources.
It should be noted, however, that the outburst amplitude of the fiducial model shown in this Letter is a bit large for an EX Lupi-like outburst. In EX Lupi itself, the bolometric luminosity amplification factor during the 2008 outburst was on the order of 10, even though in the V band it was up to a factor of 100 (Ábrahám et al., 2009). We also made a model calculation with luminosity factors of 5 for which we found contrast ratios on the order of 1.3 up to 2. FU Orionis outbursts can be very bright, but they also last longer. Our models also find circular waves in those cases.
The rings in our model images move outward with time. The outward speed of the rings is about 1 km/s amounting to about 0.25 for the current setup. For broad rings, such as those seen in TW Hydra, it may take a few years between consecutive images to be able to discern the outward motion. For narrow rings, such as the rings seen in RXJ 1615, the time baseline may be smaller.
4 Discussion
A strong prediction of this model is that the rings seen in scattered light should move radially outward, meaning that over a time baseline of several years a discernable change in the radius of the rings should be detectable. If the rings observed in a specific source can be shown to be static on a timescale on the order of half the wavelength (crest-to-crest radial distance) divided by the sound speed, then the model is disproven for that source.
Measurement of the radial velocities caused by the outward propagating waves using CO molecular lines with ALMA would provide strong evidence for the wave scenario, but the amplitude of these radial velocity waves depends strongly on the strength and duration of the outburst, and it requires a more detailed study to determine which radial velocities are expected for a given amplitude of the bright and dark rings in the scattered light images.
If our scenario is correct for a particular source, then the radial velocity pattern, as measured in different CO isotopologues, may also offer the opportunity to do tomography of the disk in a way similar to the recent work by Juhász & Rosotti (2018). It would also allow us to compute the time in the past, the duration, and the strength of the putative outburst.
The present models are still rather simplified. Given that the phenomenon is driven by irradiation, a better treatment of the dust opacities, possibly with dust settling included, will be necessary in future work. The effect of multiple smaller outbursts should be investigated, and in general a detailed parameter study with comparison to sources on a case-by-case basis should be undertaken.
5 Conclusions
We have shown that the sudden luminosity increase of the central regions of a protoplanetary disk will cause long-lasting surface waves in the disk’s outer regions. The sudden irradiative heating by the luminosity burst drives the disk, or at least its surface layers, out of vertical hydrostatic equilibrium. The ring-shaped mountains and valleys that are formed are seen in scattered light as alternating bright and dark rings. We speculate that these multi-ringed patterns in scattered light may explain some of the multi-ringed scattered light patterns seen in several nearby protoplanetary disks, such as TW Hydra (van Boekel et al., 2017) and RXJ 1615 (de Boer et al., 2016).
Clearly, strong enough outbursts of EX Lupi or FU Orionis type must cause circular waves in the disk in the way described in this Letter. Whether the rings we see in scattered light in several nearby disks are caused by such outbursts remains to be determined, but if they are not due to this mechanism, then it would be worthwhile to search for these patterns in disks that are known to have experienced outbursts in the past.
Acknowledgements.
C.P.D. thanks Antonella Natta for discussions that motivated this work. We acknowledge support from the High Performance and Cloud Computing Group at the Zentrum für Datenverarbeitung of the University of Tübingen, the state of Baden-Württemberg through bwHPC, and the German Research Foundation (DFG) through grant no. INST 37/935-1 FUGG. We also acknowledge support from DFG grant DU 414/23-1, which is part of the Forschergruppe FOR 2634 “Transitional Disks”. B.B. thanks the European Research Council (ERC Starting Grant 757448-PAMDORA) for their financial support. We thank the anonymous referee for the useful remarks that helped improve the manuscript.References
- Ábrahám et al. (2009) Ábrahám, P., Juhász, A., Dullemond, C. P., et al. 2009, Nature, 459, 224
- Avenhaus et al. (2017) Avenhaus, H., Quanz, S. P., Schmid, H. M., et al. 2017, AJ, 154, 33
- Bell & Lin (1994) Bell, K. R. & Lin, D. N. C. 1994, ApJ, 427, 987
- Benisty et al. (2017) Benisty, M., Stolker, T., Pohl, A., et al. 2017, A&A, 597, A42
- Bitsch et al. (2013) Bitsch, B., Crida, A., Morbidelli, A., Kley, W., & Dobbs-Dixon, I. 2013, A&A, 549, A124
- Bitsch et al. (2014) Bitsch, B., Morbidelli, A., Lega, E., & Crida, A. 2014, A&A, 564, A135
- D’Alessio et al. (1999) D’Alessio, P., Cantó, J., Hartmann, L., Calvet, N., & Lizano, S. 1999, ApJ, 511, 896
- de Boer et al. (2016) de Boer, J., Salter, G., Benisty, M., et al. 2016, A&A, 595, A114
- Draine (2003) Draine, B. T. 2003, ApJ, 598, 1017
- Dullemond (2000) Dullemond, C. P. 2000, A&A, 361, L17
- Dullemond et al. (2012) Dullemond, C. P., Juhasz, A., Pohl, A., et al. 2012, RADMC-3D: A multi-purpose radiative transfer tool, Astrophysics Source Code Library
- Juhász & Rosotti (2018) Juhász, A. & Rosotti, G. P. 2018, MNRAS, 474, L32
- Lega et al. (2014) Lega, E., Crida, A., Bitsch, B., & Morbidelli, A. 2014, MNRAS, 440, 683
- Marino et al. (2015) Marino, S., Perez, S., & Casassus, S. 2015, ApJL, 798, L44
- Masset (2000) Masset, F. 2000, A&AS, 141, 165
- Siebenmorgen & Heymann (2012) Siebenmorgen, R. & Heymann, F. 2012, A&A, 539, A20
- Stolker et al. (2017) Stolker, T., Sitko, M., Lazareff, B., et al. 2017, ApJ, 849, 143
- van Boekel et al. (2017) van Boekel, R., Henning, T., Menu, J., et al. 2017, ApJ, 837, 132
- Watanabe & Lin (2008) Watanabe, S.-i. & Lin, D. N. C. 2008, ApJ, 672, 1183