Entanglement reduction induced by geometrical confinement in polymer thin films
Abstract
We report simulation results on melts of entangled linear polymers confined in a free-standing thin film. We study how the geometric constraints imposed by the confinement alter the entanglement state of the system compared to the equivalent bulk system using various observables. We find that the confinement compresses the chain conformation uniaxially, decreasing the volume pervaded by the chain, which in turn reduces the number of the accessible inter-chain contact that could lead to entanglements. This local and non-uniform effect depends on the position of the chain within the film. We also test a recently presented theory that predicts how the number of entanglements decreases with geometrical confinement.
keywords:
American Chemical Society, LaTeXUniv. Grenoble Alpes, CNRS, Liphy, 140 Rue de la Physique, 38402 Saint-Martin-d’Hères, France \abbreviationsIR,NMR,UV
1 Introduction
Viscoelastic properties of polymer in melts or concentrated solutions depend strongly on the molecular weight of the polymer chains. The main effect of increasing molecular weight is the apparition of topological constraints between the chains called entanglements. These constraints are a universal aspect of polymer physics and arise in any flexible polymer if the chain is sufficiently long and the concentration is high enough. Under these conditions, the effect of entanglements becomes so relevant that system dramatically changes their physical properties such as viscosity, diffusion, rheological and mechanical behavior.
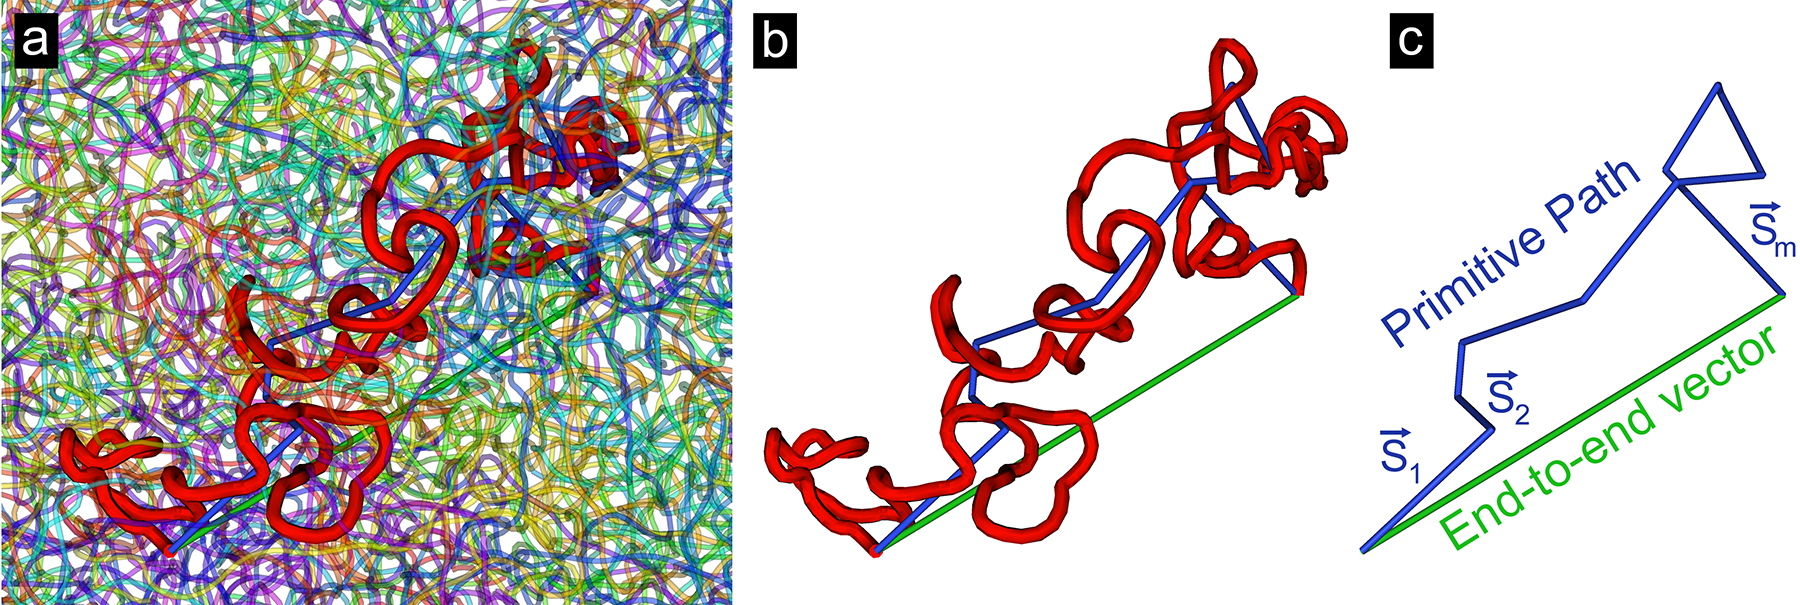
Nowadays, the most extended and successful theory regarding entangled polymer dynamics is the Tube model presented by Doi and Edwards 1 and extended as Reptation model by de Gennes 2, 3 which provided a framework for understanding many aspects of the underlying polymer physic in both regimes: melt and solution. The theory averages the collective effect of all surroundings chains over a given strand to a tubelike-region of confinement whose central axis is one segment of the called primitive path (). In this approach, the primitive path is an essential theoretical concept introduced by Edwards 4, 5 and defined as the shortest path connecting the two ends of the chain preserving its topology. As a result of this confinement in a virtual tube, the strand moves back and forth performing a slithering motion inside the tube (reptates). Despite its conceptual simplicity this theory proved to be a powerful tool to understand polymer dynamics and their quantitative predictions fit quite well with experimental results.
Polymer thin films have numerous applications (e.g., coatings, dielectrics, adhesives, lubricants6, 7, 8), but are also of fundamental interest. Thin films below a certain thickness induce geometrical confinement so that the polymeric material exhibits unusual physical properties compared to its bulk behavior9, 10. Viscoelastic properties are not the exception and are affected below of a certain confinement strength. This is clearly reported in experiments11, 12; however, the precise link between these modifications and the changes in the topological structure, or entanglement network, are not fully understood yet. Indeed, the manner in which the entanglement network is modified under confinement is a subject of current interest.
As entanglements are not directly observable via experiments, numerical simulations are an essential tool to study their nature. Since entangled chains have very long relaxation times, classical Molecular Dynamics is quite limited for such studies. Recently new coarse-graining techniques were introduced to simulate entanglements such as slip-springs or slip-links which introduce a temporary attractive force between nearby beads, imitating entanglement effects13, 14, 15, 16, 17, 18. However, in such studies, the effect of heterogeneity or confinement on the slip link (entanglement) density has to be specified somewhat arbitrarily, so that it becomes essential to inform such techniques using a more microscopic approach, numerical or theoretical.
Recently, a step in this direction was performed by extending the principle of conformational transfer of Silberberg to predict the entanglement reduction in thin films or cylinders as a function of the aspect ratio between the film thickness (or cylinder radius) and the end-to-end chain distance19, 20. The predictions of the theory were tested using molecular dynamics simulations, however in weakly entangled systems.
In this paper, we extend this analysis to more strongly entangled systems, using a technique that uses ultrasoft potentials to speed up the simulation 21. Our primary aim is to unveil how, in a thin film built with linear polymers, the geometrical confinement acts as an external field that modifies the entanglement state of the system, and what are its most relevant consequences. The article is organized as follow: In the next section, we describe the simulation model and the methods and protocols used in our study. Then, the section “Results and discussion” presents the results, with five subsections addressing different aspects of the confinement effect. The main conclusions are summarized in the last section.
2 Model and methods
The model is based on a new original approach to simulate entangled of polymer in melt or concentrated solution condition, reported in an earlier work 21, and which was recently successfully used to study polymer brushes under shear flow22.
The main idea is to use a pseudo-continuous model of a polymer solution, consisting of long chains interacting through a soft potential field. The motion is then resolved using Brownian dynamics with large time steps.
The motion of chains in dense conditions, each described by a continuous curve , with variables for time and as the monomer index, is solved numerically. The continuous backbone , uses a finite number of discrete points to, generally, oversample the chains. Choosing the chain is reduced to the standard bead-spring model, which for this soft-potential has gaps that may allow chains to cross each other. This is a novelty aspect on this coarse-graining, where the crosses are avoided oversampling enough the chains to suppress the gaps along the backbone effectively. In this work, we found that is sufficient to describe the chains in all our simulations well.
Every chain has degrees of freedom that correspond to the usual Rouse modes (or alternatively to beads through the usual Rouse transformation, see Ref. 21), and follows the stochastic first order equation of motion:
| (1) |
here is the friction coefficient of the chain center of mass.
The strength of the thermal noise is modeled by a Wiener process .
In Eq. 1 models the bonded interaction (bead-spring):
| (2) |
where is the mean square end-to-end distance of a free chain, and can be combined with other parameters to define the microscopic unit of time, .
describes the nonbonded interactions between chains:
| (3) |
Here, we propose as a soft potential model through a combination of Gaussian functions, that takes into account both relevance interaction; excluded volume and attractive force:
| (4) |
where is a parameter to control the relative weight of the attractive part. At this point, it is important to remark that in potentials such as the one proposed in Eq. 4 a problem of thermodynamic stability may arise, so the selection of the value for is not a trivial question. In fact is well known23, 24, 25 that when interacting bodies without an infinitely repulsive core (i.e., finite force value at zero separation) also interact through attractive forces, if the attraction is too strong the weak short-range repulsion may not be sufficient to prevent a “collapse” of the system allowing all particles eventually to overlap in a finite region of space: the thermodynamic catastrophe occurs. Well-defined criteria to ensure thermodynamic stability were derived by Fisher and Ruelle26, 27. In this work, we determined a thermodynamic safety interval of values for applying these criteria following a straightforward approach proposed in Ref. 28. We found that the stability condition is for this parameter, and we use the value for all the simulation reported here. More details are given in Appendix I.
A central point of this coarse-grained description is the use of an approximate but high-speed method of evaluating the interparticle forces. The technique involves splitting the force into two terms and evaluate them on a staggered grid. The first term takes into account short-range interactions and the second one the long-range contributions. The short-range part is calculated through linearization of the gaussian force, and the long-range part using a convolution between the density field and the potential in Fourier space, where the periodic boundary conditions are incorporated naturally.
The matrix-matched nature of this problem allows the implementation of a transparent parallelization into the GPU paradigm, which enabled us to take advantage of these high-performance devices. Hence, the simulation code was programmed in CUDA with an optimized implementation of the available memories and all simulations reported in this manuscript were run in two GPU cards Nvidia Quadro P1000 both included in a conventional desktop computer.
In order to reach the equilibrium state quickly, we use the method proposed in Ref. 29. The method starts by locating randomly monomer in a box with the proper dimensions to set the target density. Initially, there are chains with one monomer each one. Then, the method adds monomer systematically along the chain backbone, rescaling the box properly to conserve the density. This process is repeated until the desired chain-length is reached. We then run a simulation in which the mean square displacement (MSD) of the central monomer is followed and ensure that the chains diffuse enough distance to sample the film thickness adequately and the equilibration time is already passed before starting to compute observables.
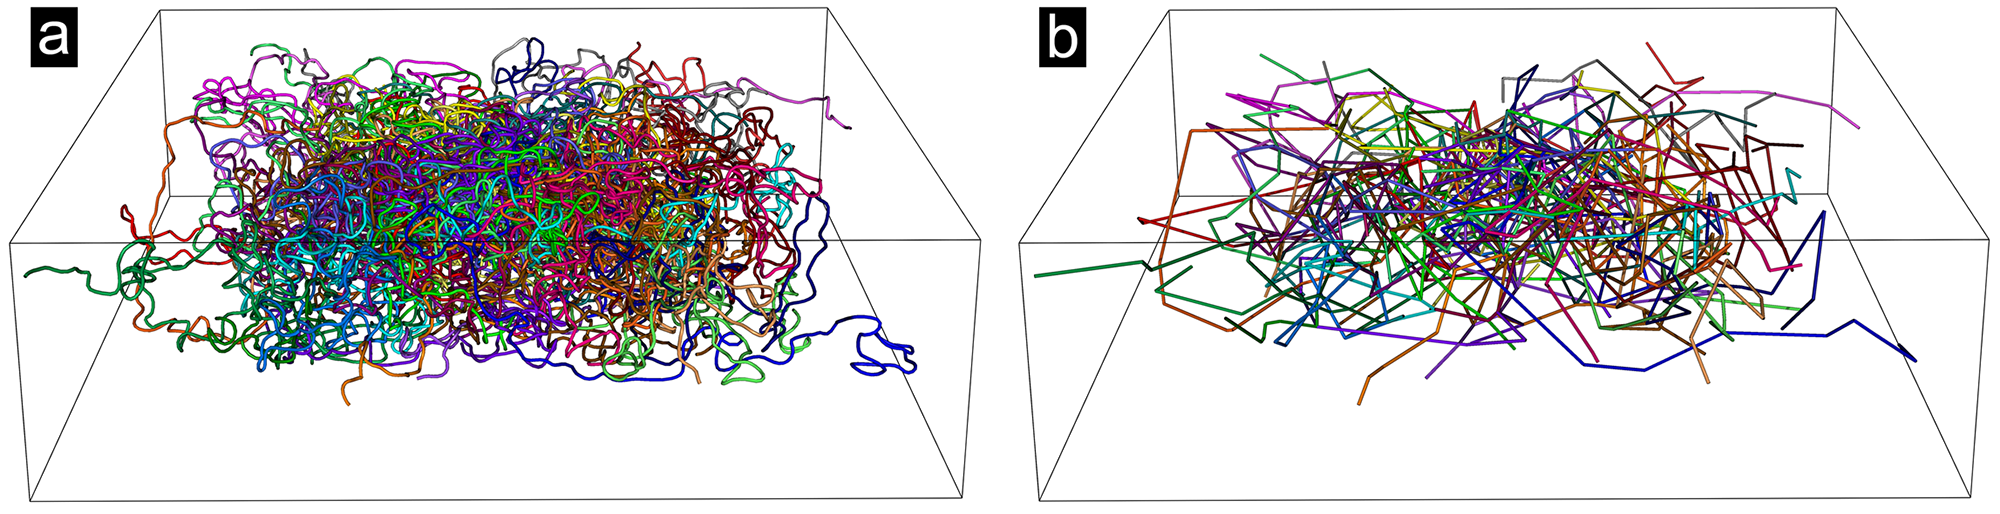
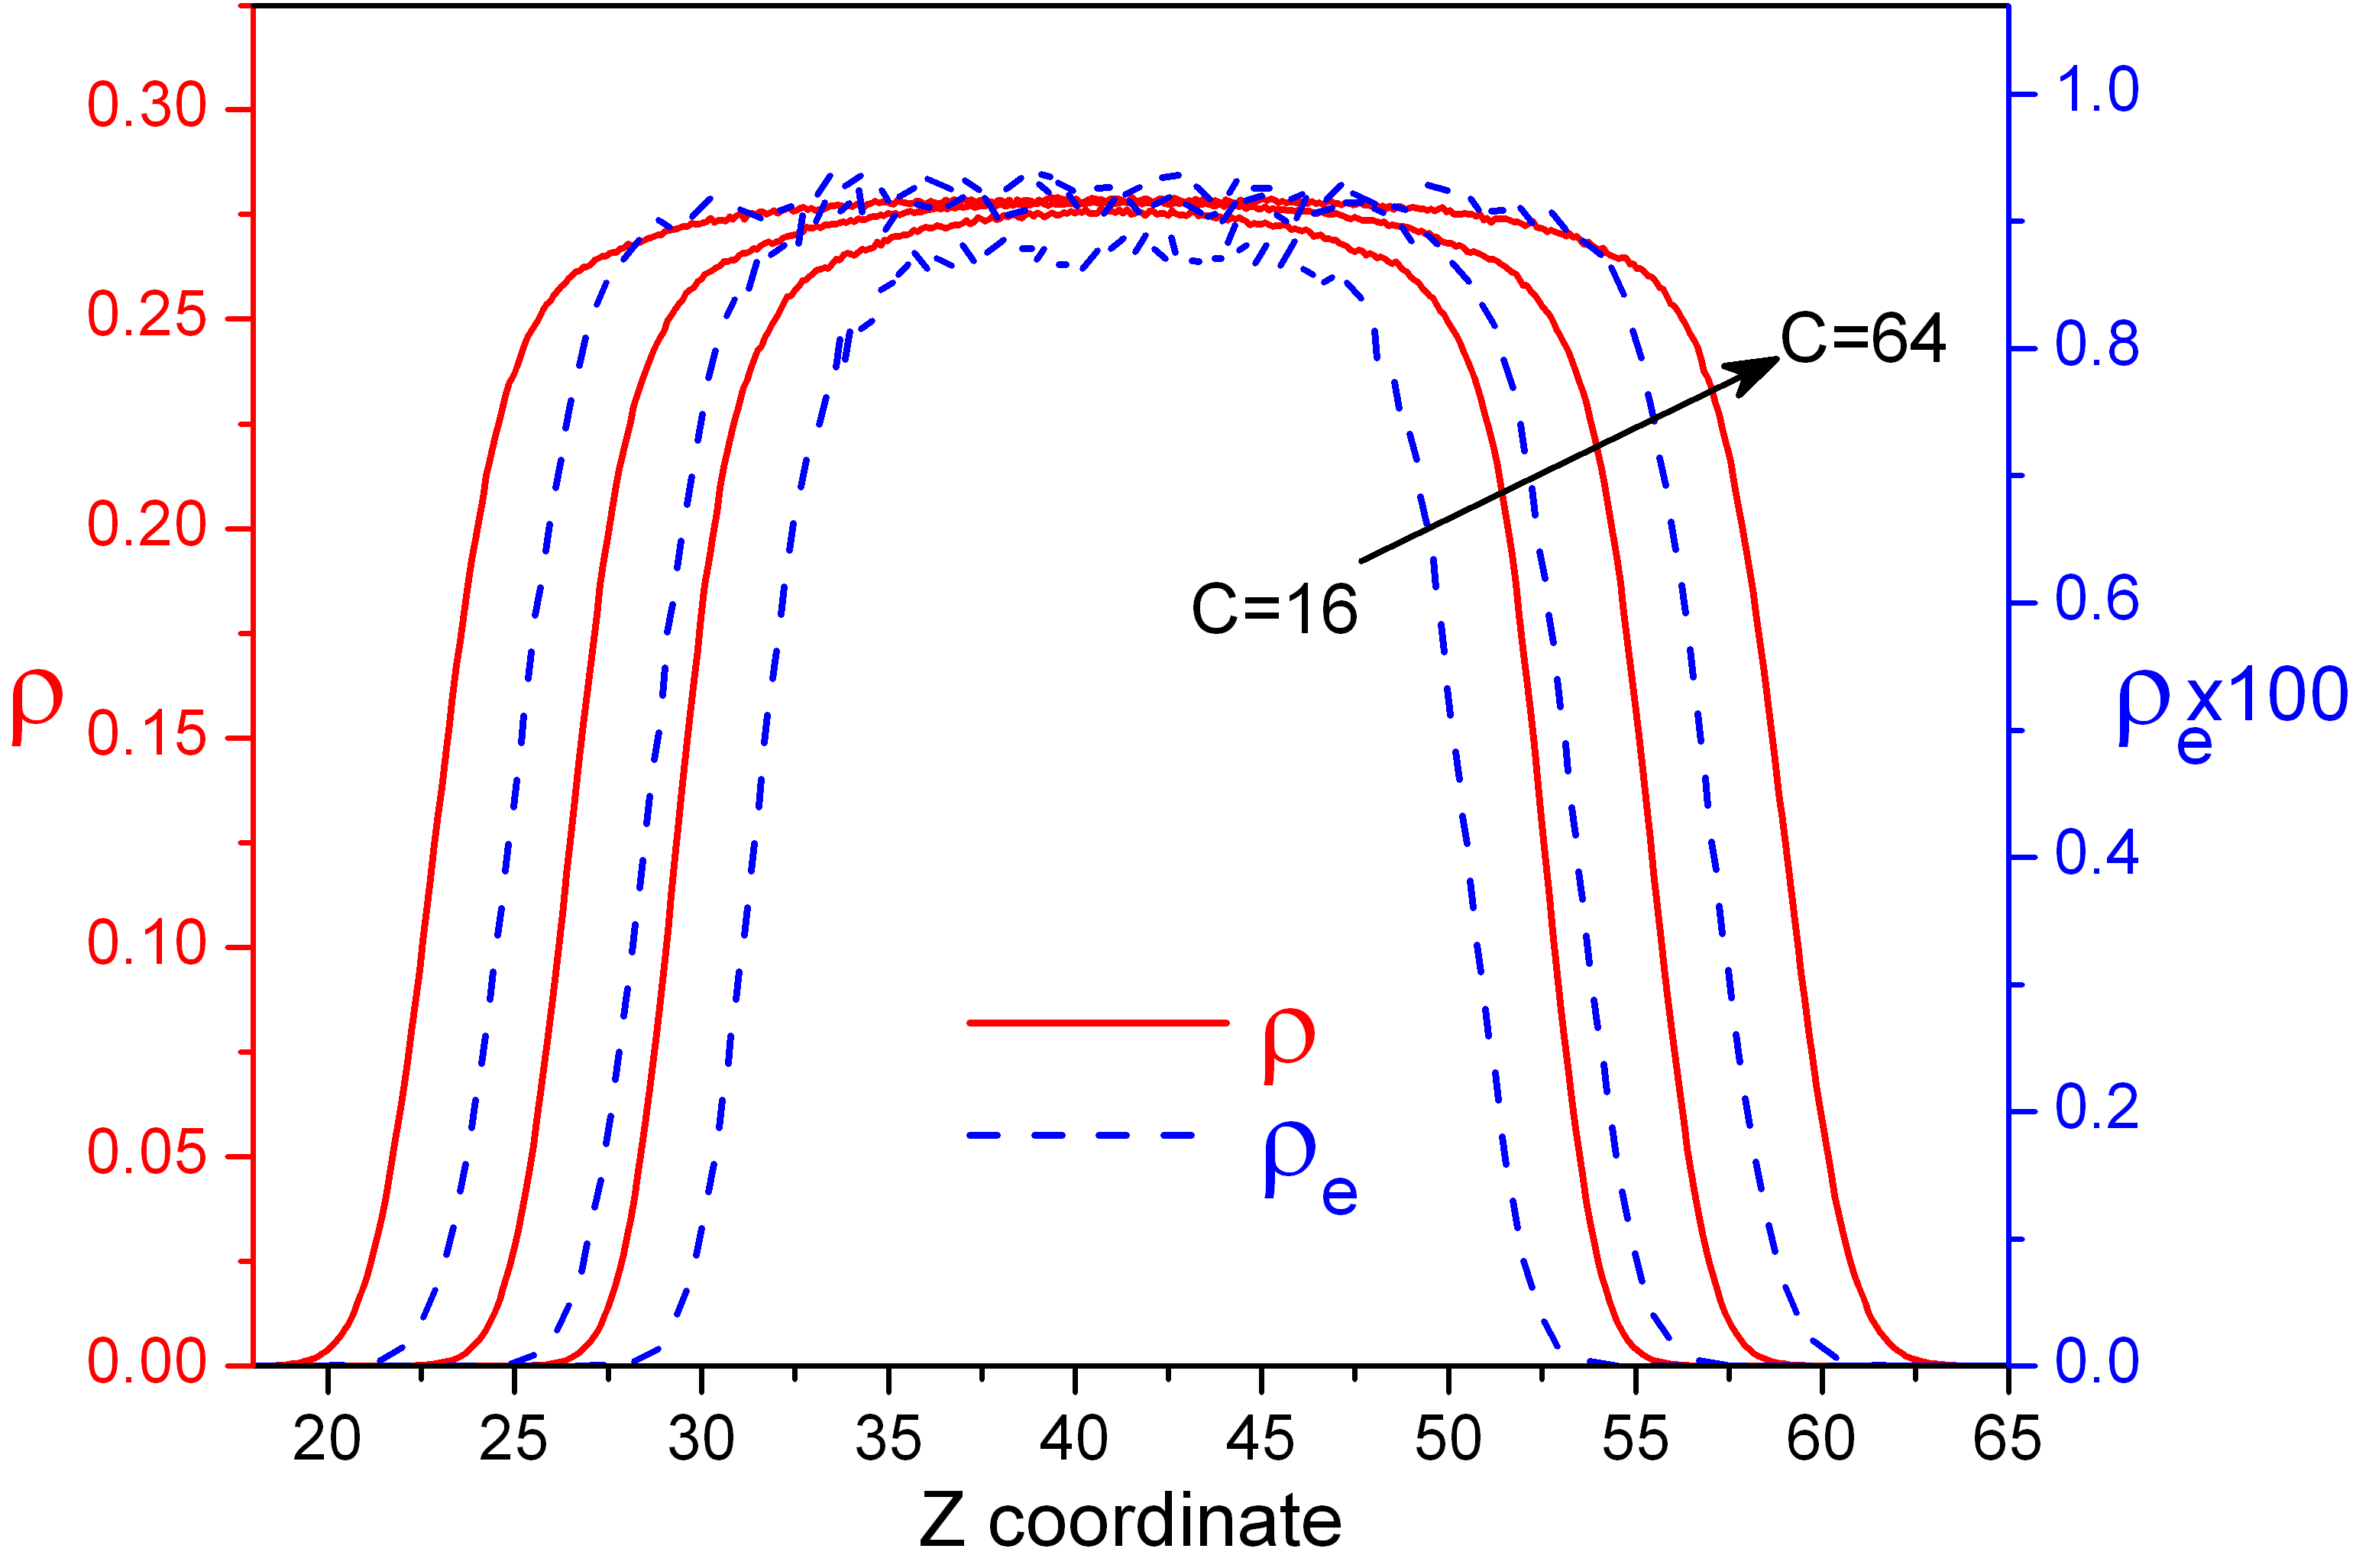
The dimensions of the cubic simulation box were chosen to create a system with initial monomer density of , so . As a result of the attractive interaction, the system spontaneously forms a thin film in a central region of the box, reaching an equilibrium density of inside the film. This value is determined from the density profile shown in Figure 2. This final density depends on the parameter which, as we mentioned before, is fixed to in our study. We also confirmed that the largest radius of gyration is roughly three times smaller than , which should be enough to ensure that the chains do not interact with their periodic images. Figure 1a shows an instantaneous configuration of a free-standing film obtained with this preparation protocol.
We have chosen to work with monodisperse linear chains of , and monomers conforming self-confined films containing , , , , , , and chains. Also, in order to have systems of reference for the different chains lengths, it was performed simulations of chains with , and monomers with the same parameters as before but in bulk conditions, i.e., setting the box dimension correctly to get a constant density of .
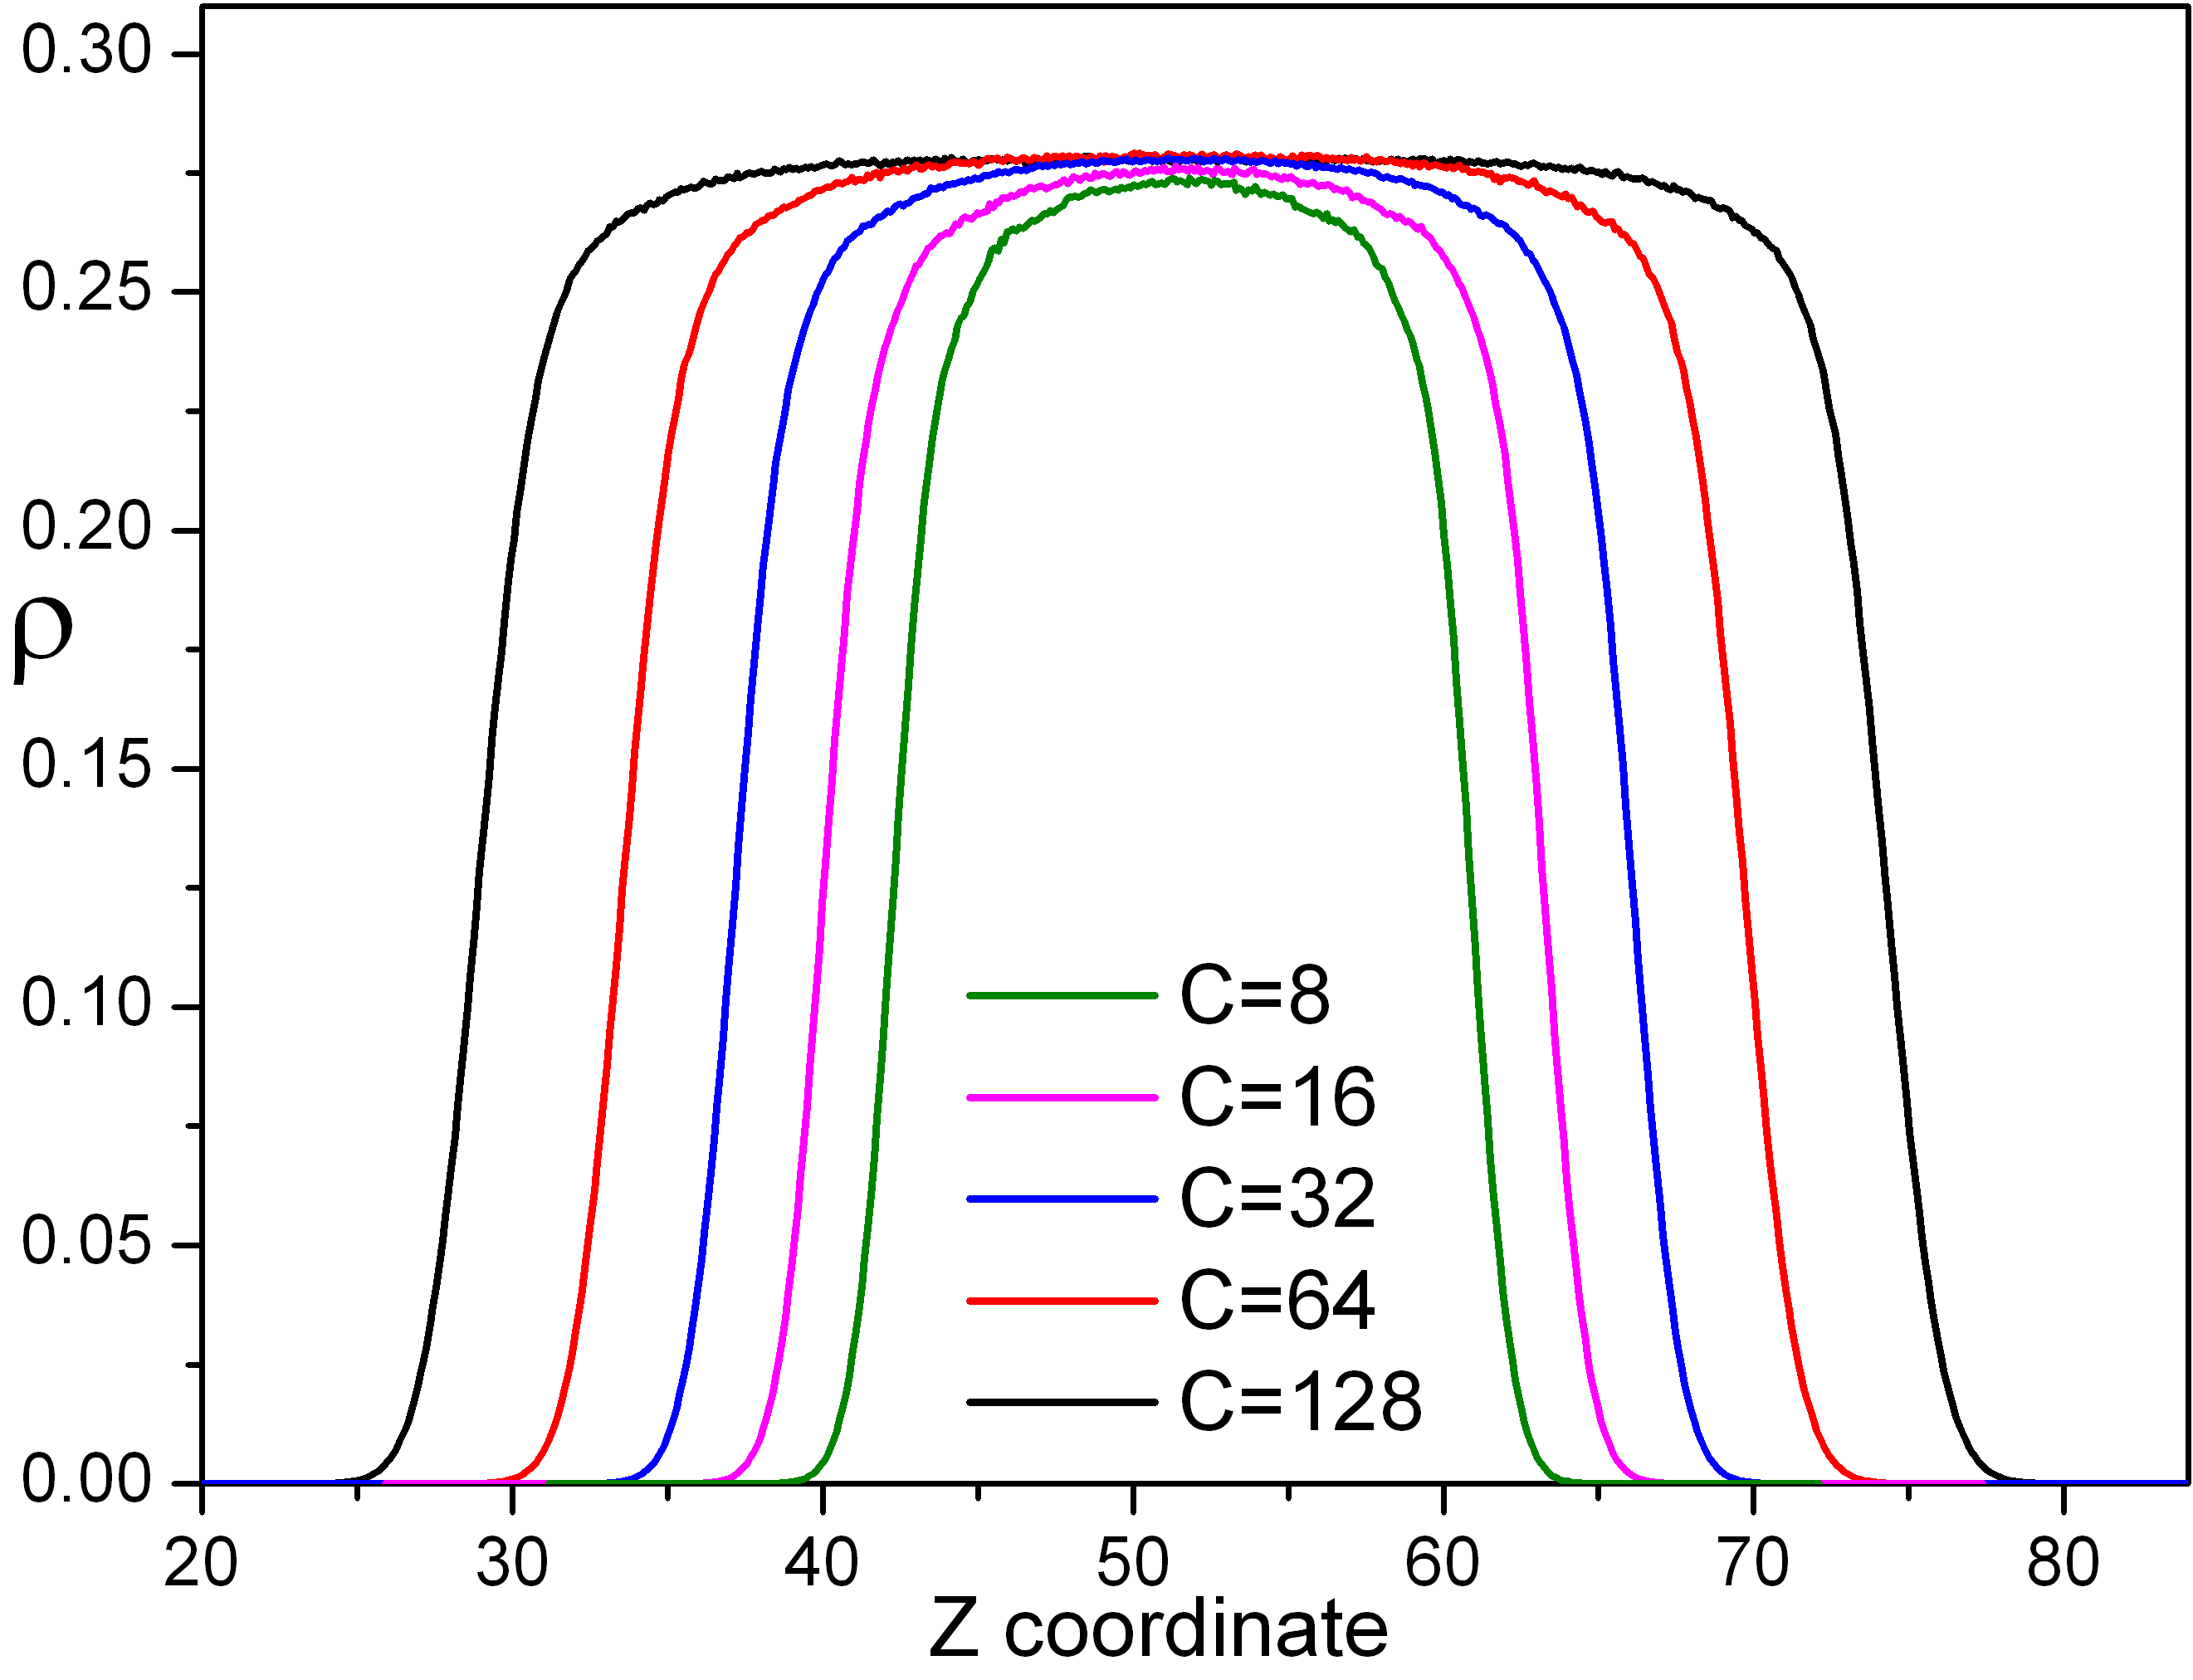
Figure 2 shows the monomer density profiles for some films built with chains of length . The film thickness is obtained by fitting these profiles with the following hyperbolic tangent function as a function of the coordinate:
| (5) |
where is the density in the interior of the film, is the half width of the interior thickness, is the position of the middle film, and is a measure of the width of the interface, which is a consequence of the density fluctuations near the surface. Finally, the effective film thickness can be reduced to . By this measure, the thickness of the profiles in Figure 2 were , , , , and in units of the monomer diameter and the inner density for all of them is . As is expected, these values are in good agreement with the direct estimation of the thickness from .
To characterize the behavior of some important vectors (segments of , , etc.), we will use the second Legendre polynomial:
| (6) |
where is the angle between the vector under study and a given fixed direction of interest defined by a unit vector called the director, which will be explicitly indicated in each case. is widely used to study nematic order in diverse systems (liquid crystal, etc.), and is also helpful to quantify the behavior of a vector (or a vector field) around a given direction of interest. This order parameter lies within the interval , where a value of indicates that vectors under analysis align perfectly with the direction of reference, corresponds to an isotropic distribution around the reference direction. The negative value of the lower bound, , corresponds to vectors all oriented in a plane perpendicular to the director.
The topological analysis of the systems presented in the following are all performed using the algorithm 30, 31, 32, 33, a method based on the MD trajectories which finds entanglement by geometrical minimization. In this code, all chain ends are maintained them fixed in the space, excluded volume interactions are disabled, but the chain uncrossability condition is preserved. Then, a set of geometric operations are applied over of all this pseudo-chains, which monotonically reduce its contour lengths. Eventually, the method builds a for each chain thereby reducing the linear polymer system to an entanglement network of . This iterative geometrical minimization procedure terminates as soon as the mean length of all has converged. Figure 1b shows the network obtained by applying algorithm to the film plotted in Figure 1a, here is important to remark that the chains are drawn entirely, i.e., without cutting at the periodic boundary conditions of the simulation box. As a result, some chains (or extremes) which appear isolated, have entanglements, as they cross the box boundary and are effectively surrounded by periodic images of the chains represented.
Additionally, the code provides the statistical properties of the underlying topological network but also the positions of the interior kinks31, 32 along the three-dimensional for each chain. For long chains, the number of kinks is proportional to the number of entanglements and in this context, both terms can be considered as equivalents. In this approach, self-entanglements (intramolecular knots) are neglected, as they represent a small fraction and are irrelevant for most polymeric systems.
3 Results and discussion
3.1 Statistics of entanglements in bulk
As a reference, we start by using the algorithm30, 31, 33, 32 to perform a topological analysis of the bulk system configurations.
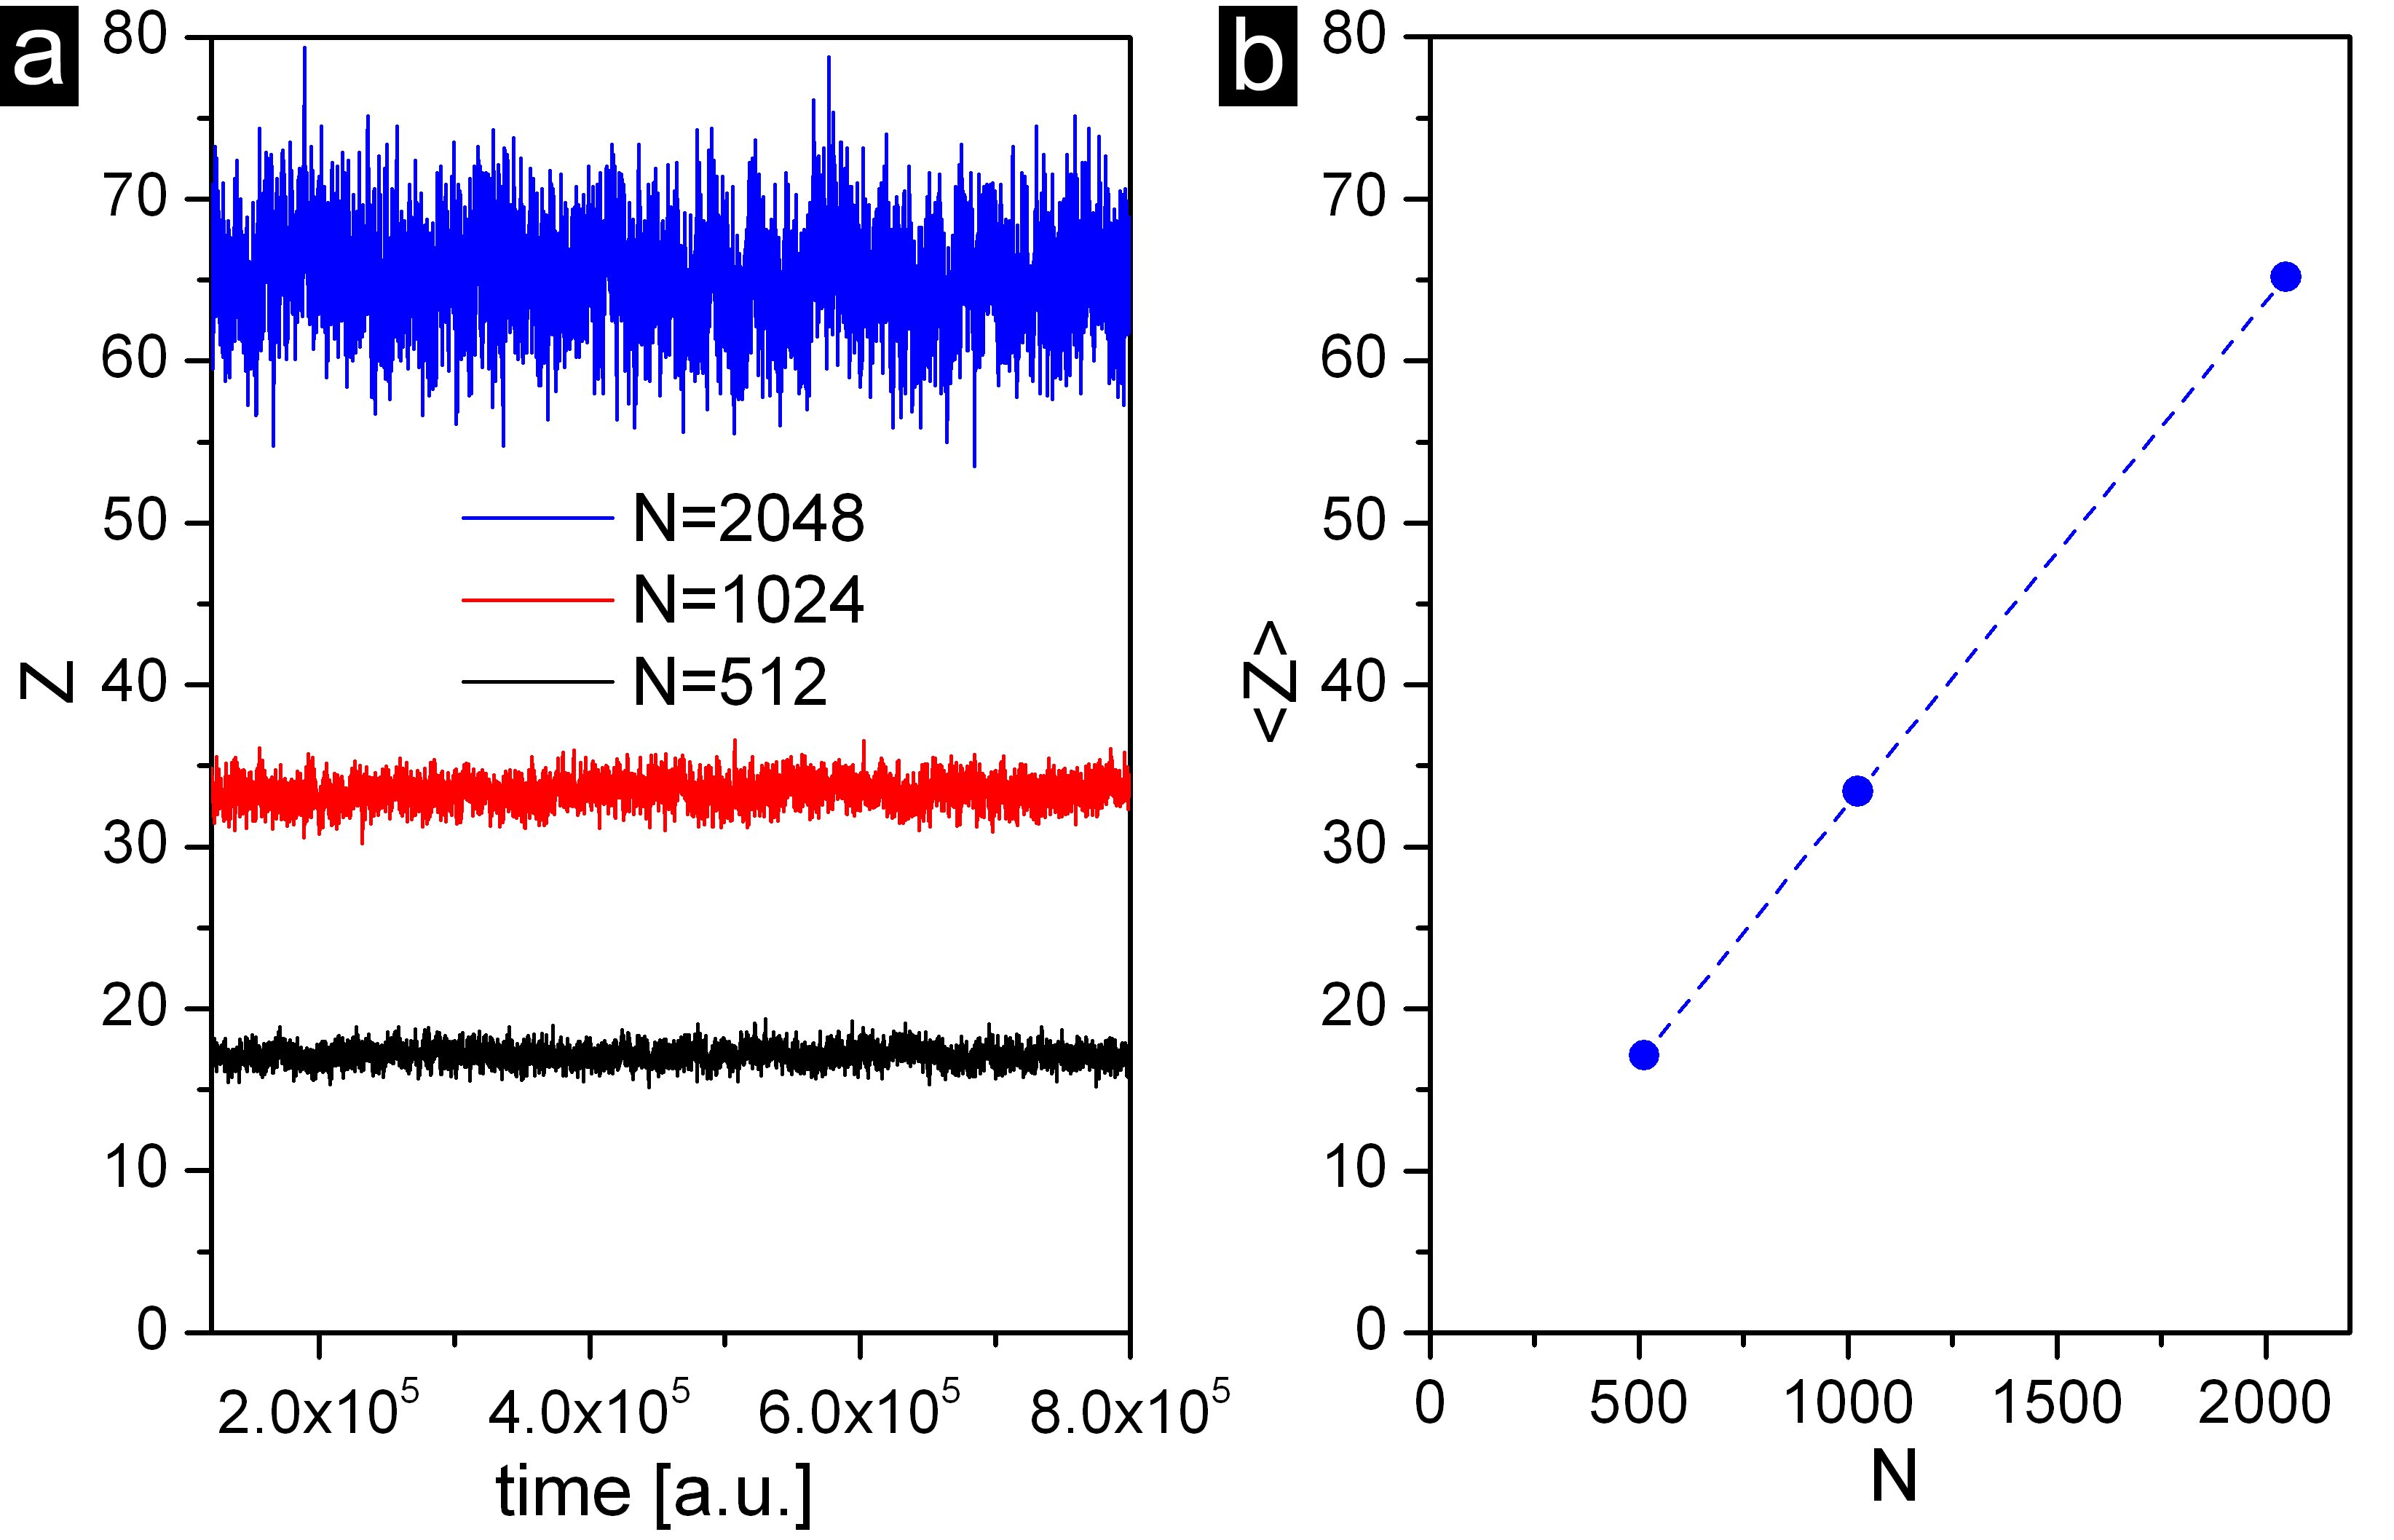
Figure 3a shows the temporal evolution of the total numbers of entanglements per chain () after equilibration. This number fluctuates slightly around its average value, which is an indicator that the systems were well equilibrated. Moreover, as is expected in bulk at fixed density, the average value of the number of entanglements per chain increases linearly with the chain-length , with a slope of (Figure 3b). This slope is just the reciprocal of the entanglement length (in number of monomers), which can be used to characterize the crossover between the Rouse and Reptation regimes. In the reptation model, is defined as the arc length of a chain with mean-square end-to-end distance equal to tube diameter (, being the statistical segment length).
The statistic of entanglements in bulk systems is well explained by the chain packing model34, 35, 36. Mostly, the idea is that the larger the dimensions of a chain, the greater the volume pervaded by that chain, so the greater the number of other neighbors chains it will encounter and with which it might entangle. In this model, is defined as the ratio of the pervaded volume to the real volume occupied by the chain . Although is not easy to calculate, a well-accepted estimate is proportional to the volume covered by one of their characteristic lengths of the chain: or . Thus, the pervaded volume can be estimated as while the effective volume occupied by the chain is . This model assumes that an entanglement arises when the molecular weight and the concentration are such that at least two chains share the same pervaded volume, i.e., .
These volumes scale differently with molecular weight, while . As a result, increasing the chain length increases the number of chains that are allowed to share the same pervaded volume, favoring the interchain contacts that lead to entanglements. In the following, we will, however, see that this model is not sufficient to explain the statistics of entanglements in confined systems.
3.2 Global impact of the confinement on the entanglements
Figure 4 shows the total number of entanglements per chain compared to its bulk value, , for thin films of various thickness. The film thickness is normalized here using the average end-to-end distance in bulk conditions for the same chain length. This normalization is guided by the proposal of reference 19, which suggests that the corresponding curve should be universal in the limit of large molecular weight.
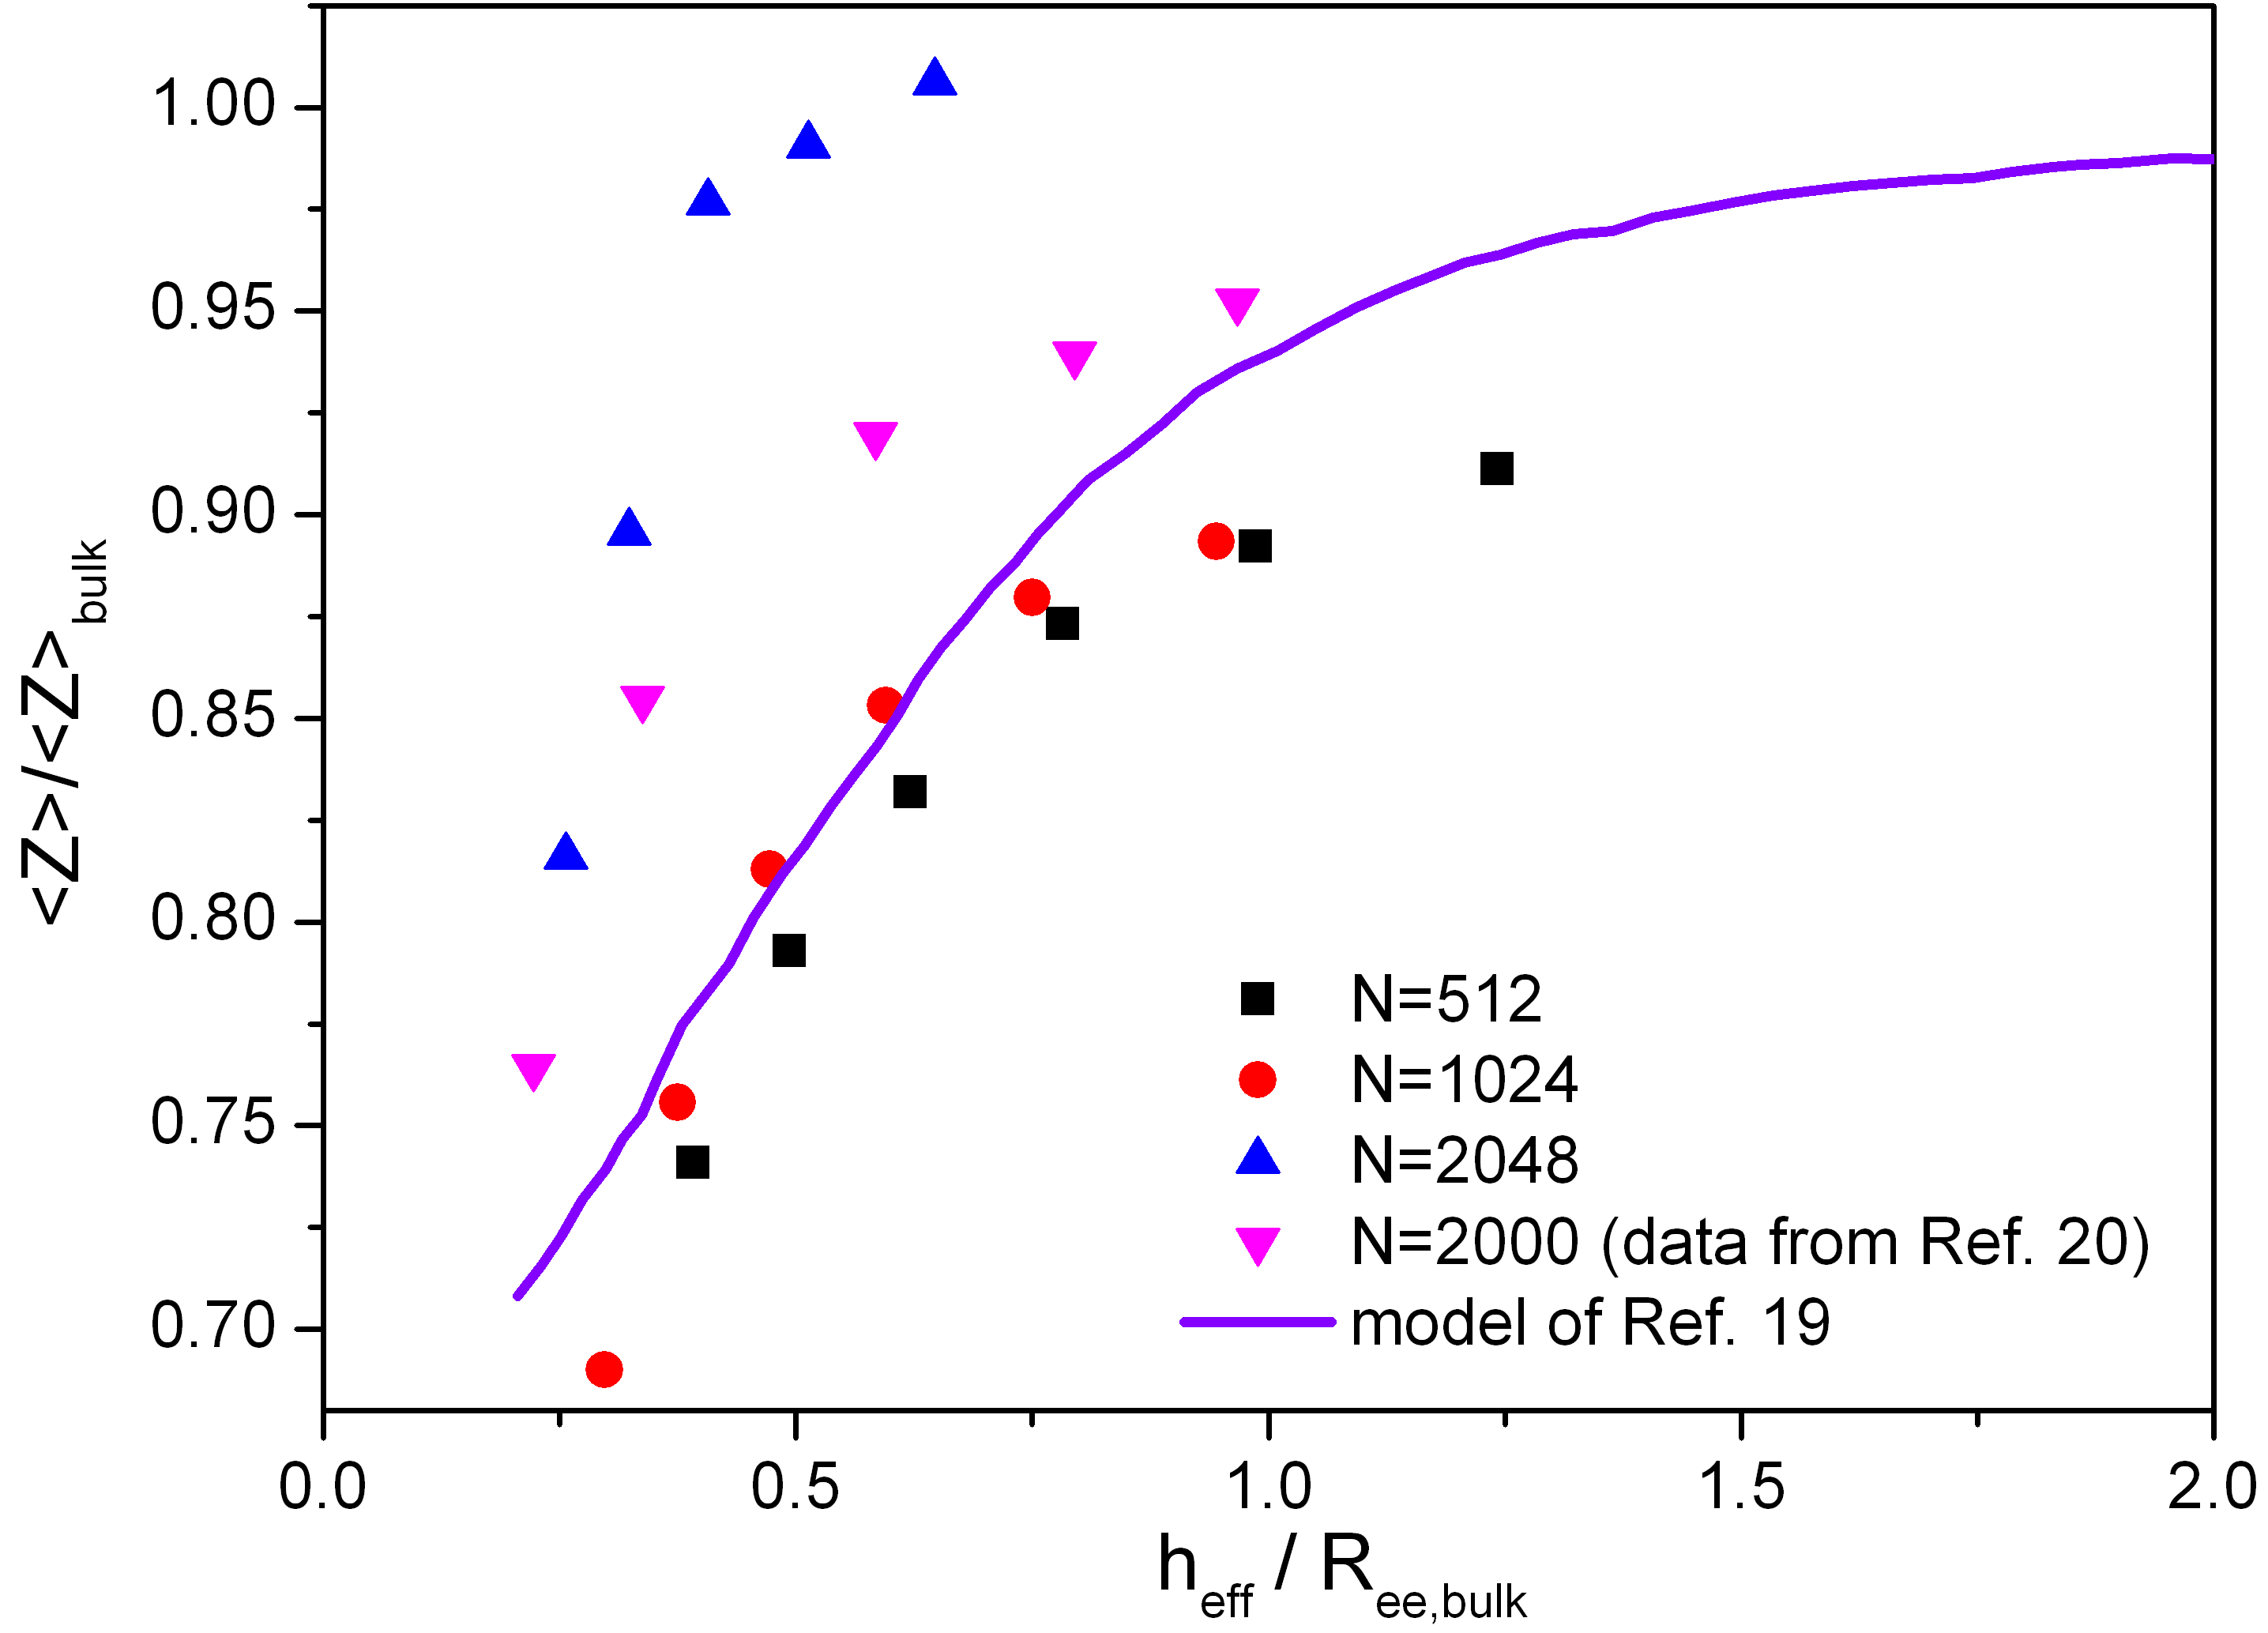
Globally, we find that confinement leads to a decrease in the average number of entanglements per chain. Qualitatively, this result is in good agreement with the one observed in experiments37, 10, 38, simulations39, 40, 17, and with the theoretical model proposed in Ref. 19. However, Figure 4 shows that, quantitatively, there is a notable difference between our results and the model proposed by Sussman and coworkers19. Figure 4 clearly shows that the model accounts reasonably well for the data obtained for shorter chains, but strong deviations are observable for thin films made of long chains. In those films, the decrease of the entanglements is observed only for films that are significantly thinner than the size of the unperturbed chain. Data for extracted from a recent manuscript20 displays a similar trend. In the next section, we discuss possible reasons for the origin of the discrepancy between theory and simulation.
The algorithm also provides the primitive path () conformation of each chain, from which it was possible to determinate the position of entanglements within the film. A spatially resolved profile of the entanglement density across the film is shown in Figure 5 and compared with the monomer density profile for films of different thickness built with chains of monomers.
Is interesting to note in Figure 5, that entanglements sample the space uniformly within the film exhibiting a notable decrease only near to the surface.
3.3 Understanding the discrepancy between simulations and theory
The theoretical model presented in Ref. 19 is based on three fundamental hypothesis: (I) validity the principle of conformational transfer proposed by Silberberg41, generalized to a thin film geometry, (II) the distribution of orientations of the end-to-end vector is made anisotropic by the geometric confinement, and this orientation distribution is directly communicated to the primitive path network, (III) the distribution of orientations at the scale is used to predict the changes in the entanglement network. In the following, we will analyze the validity of these assumptions for our simulations, in order to understand the origin of the observed discrepancy.
Hypothesis (I), involves a modification of the Silberberg model41 which treats the chain as a random walk using reflecting boundary conditions to compute changes to the chain conformation in the presence of a wall. The original model formulated by Silberberg consider the perturbation of chains near to one wall in space and makes quantitative predictions for the statistics of the chain conformations in the direction normal to the surface.
Following the philosophy of Silberberg, the authors of Ref. 19 proposed an extension of this idea for thin films. Two walls with reflecting boundary condition delimit the film, and the contribution of both surfaces are added to obtain the chain conformation inside the film. At first order, the early two reflections are taken into account. Formally, in analogy with the method of images in electrostatics, second and higher order reflections should also be taken into account, so that the final results involves summing an infinite series. Fortunately, due to the fast decaying of the superior order contributions, the convergence of the series is quick, and only a few terms are needed to reach an accuracy. This extended model allows one to predict the change in the normal component of the mean end-to-end vector as a function of the distance from the final random walk step to the surface, . Integrating this function through the film thickness, it is possible to compute the global change in the normal component as a function of the film thickness. For further information on this approach see Ref. 19.
In Figure 6, the prediction of this extended Silberberg model for the perpendicular component of the bulk normalized mean end-to-end vector as a function of the normalized films thicknesses is compared with our simulation results for different chain length exhibiting an excellent agreement and supporting the validity of this first hypothesis.
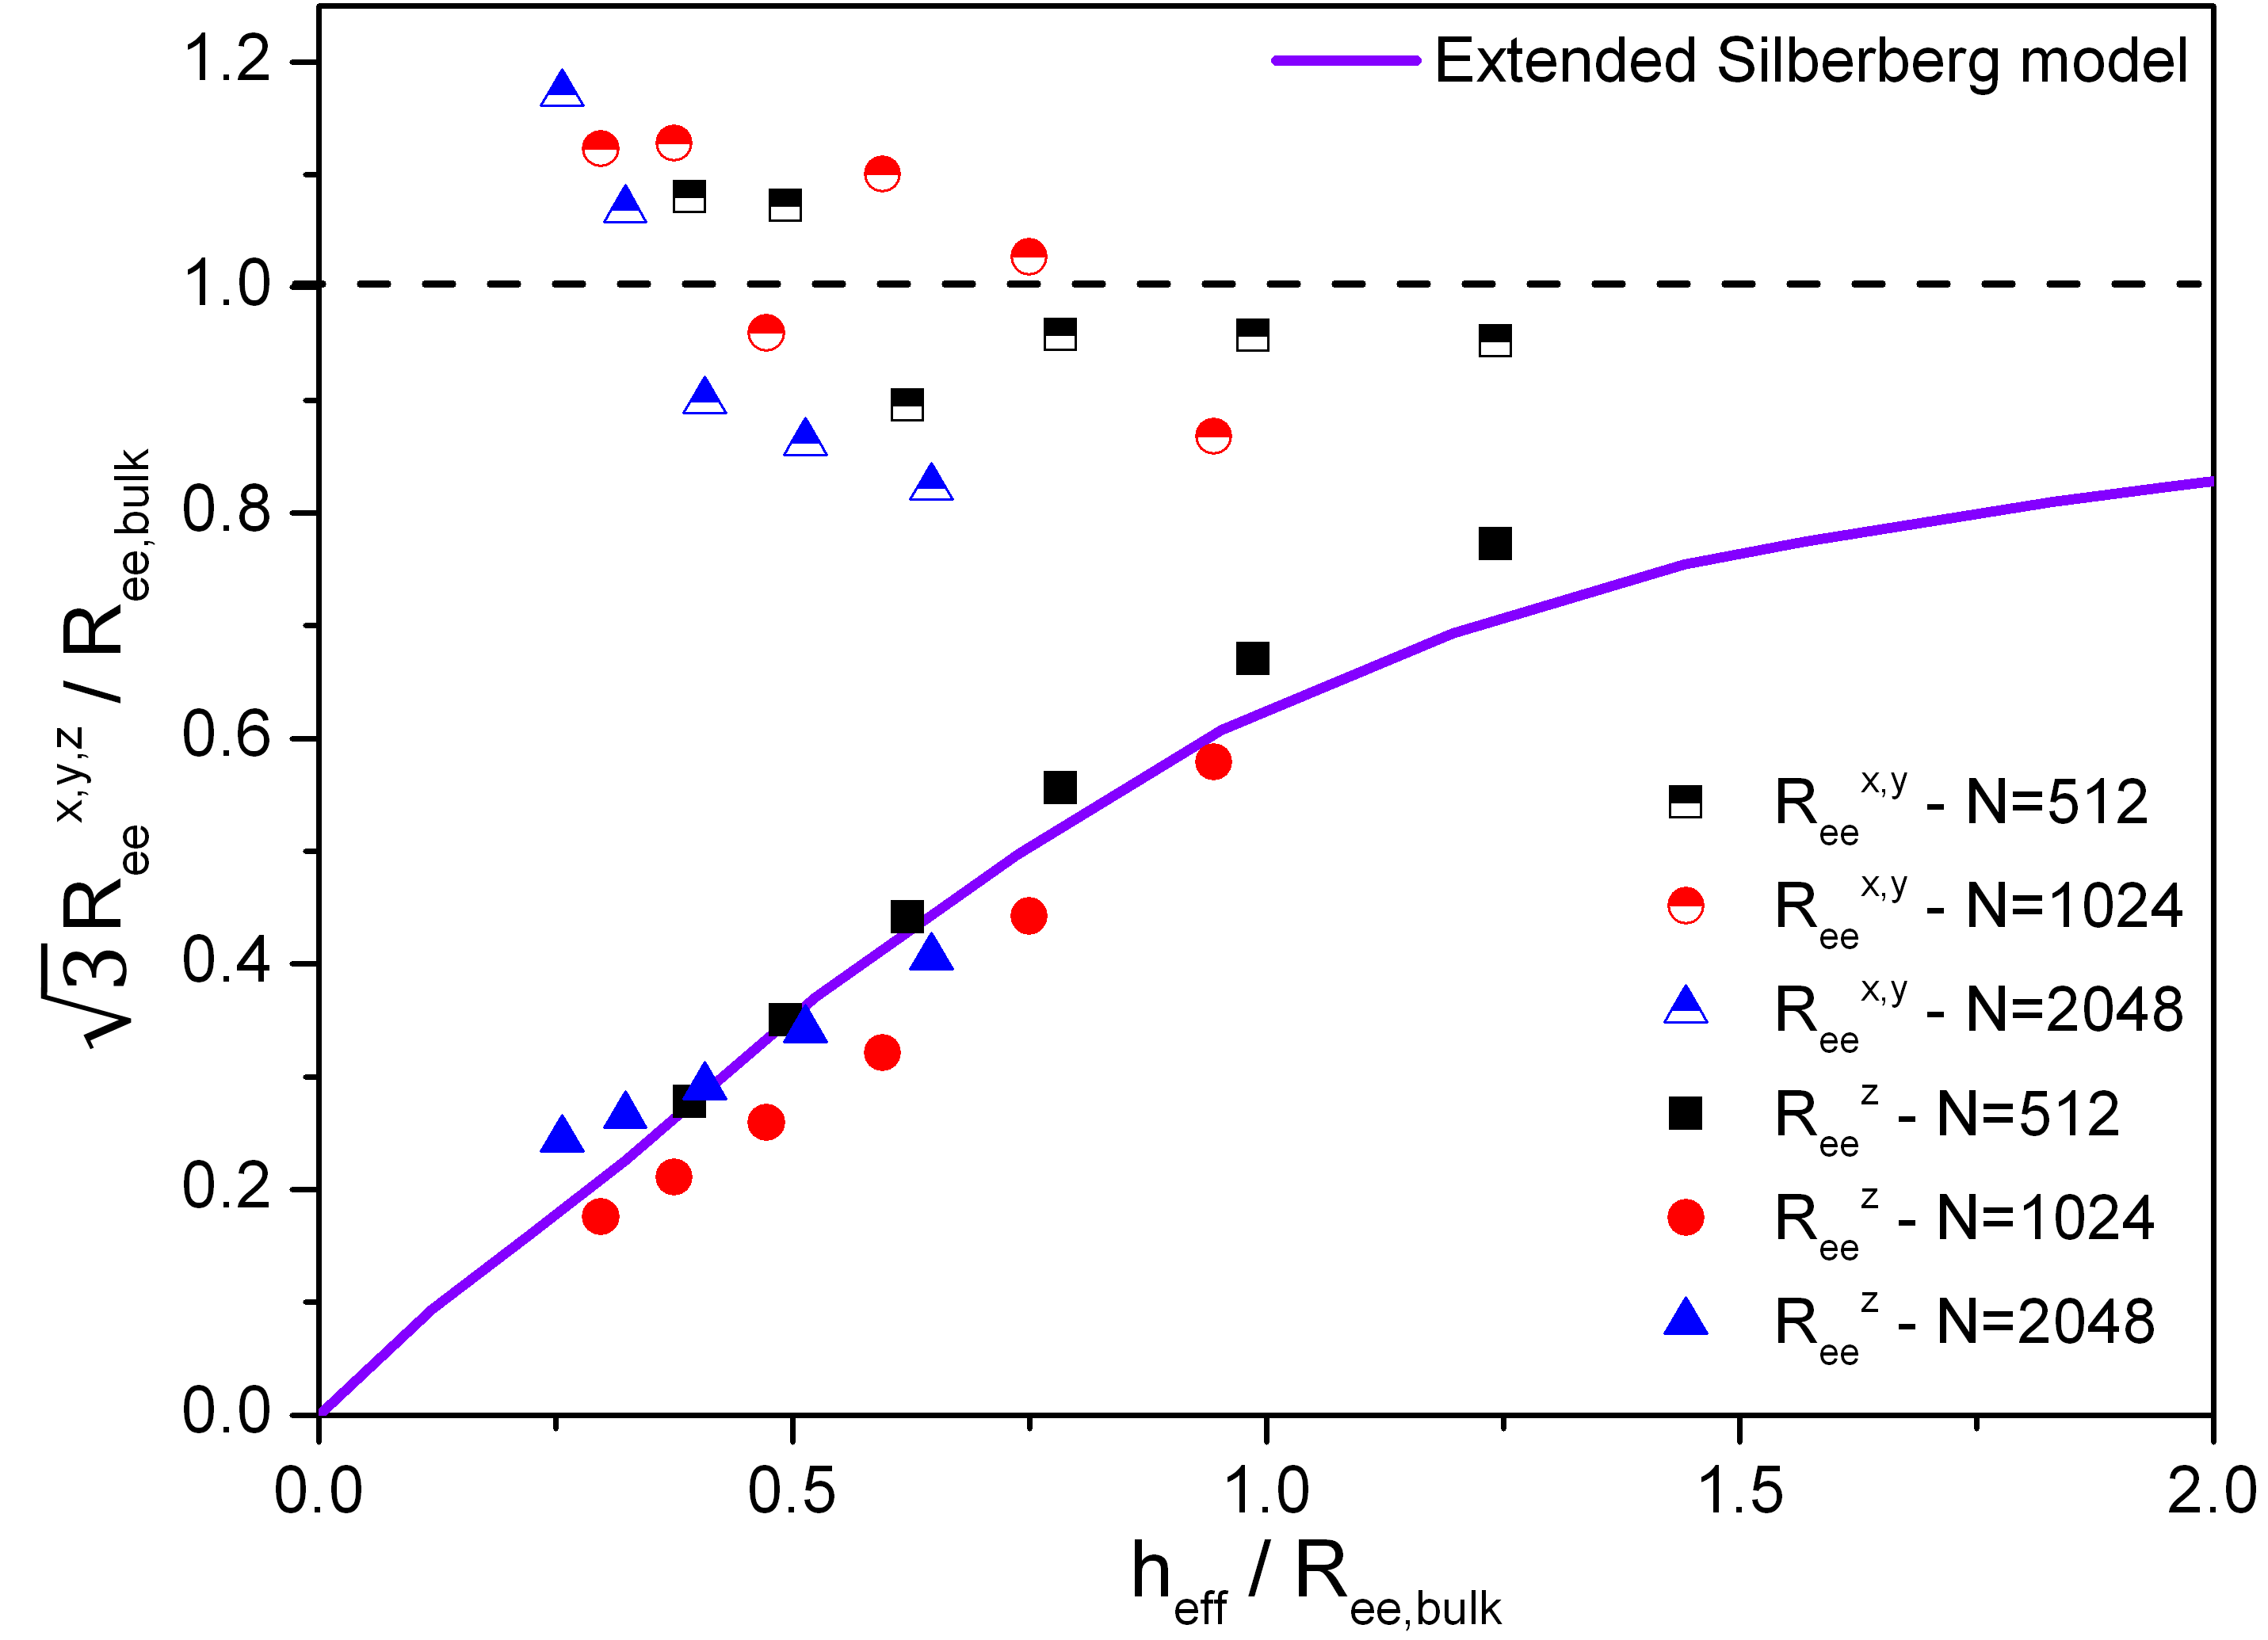
Figure 6 also displays the normalized parallel components (, ) averaged over the film thickness. As expected, these components are only slightly affected by confinement and exhibit a bulk-like behavior.
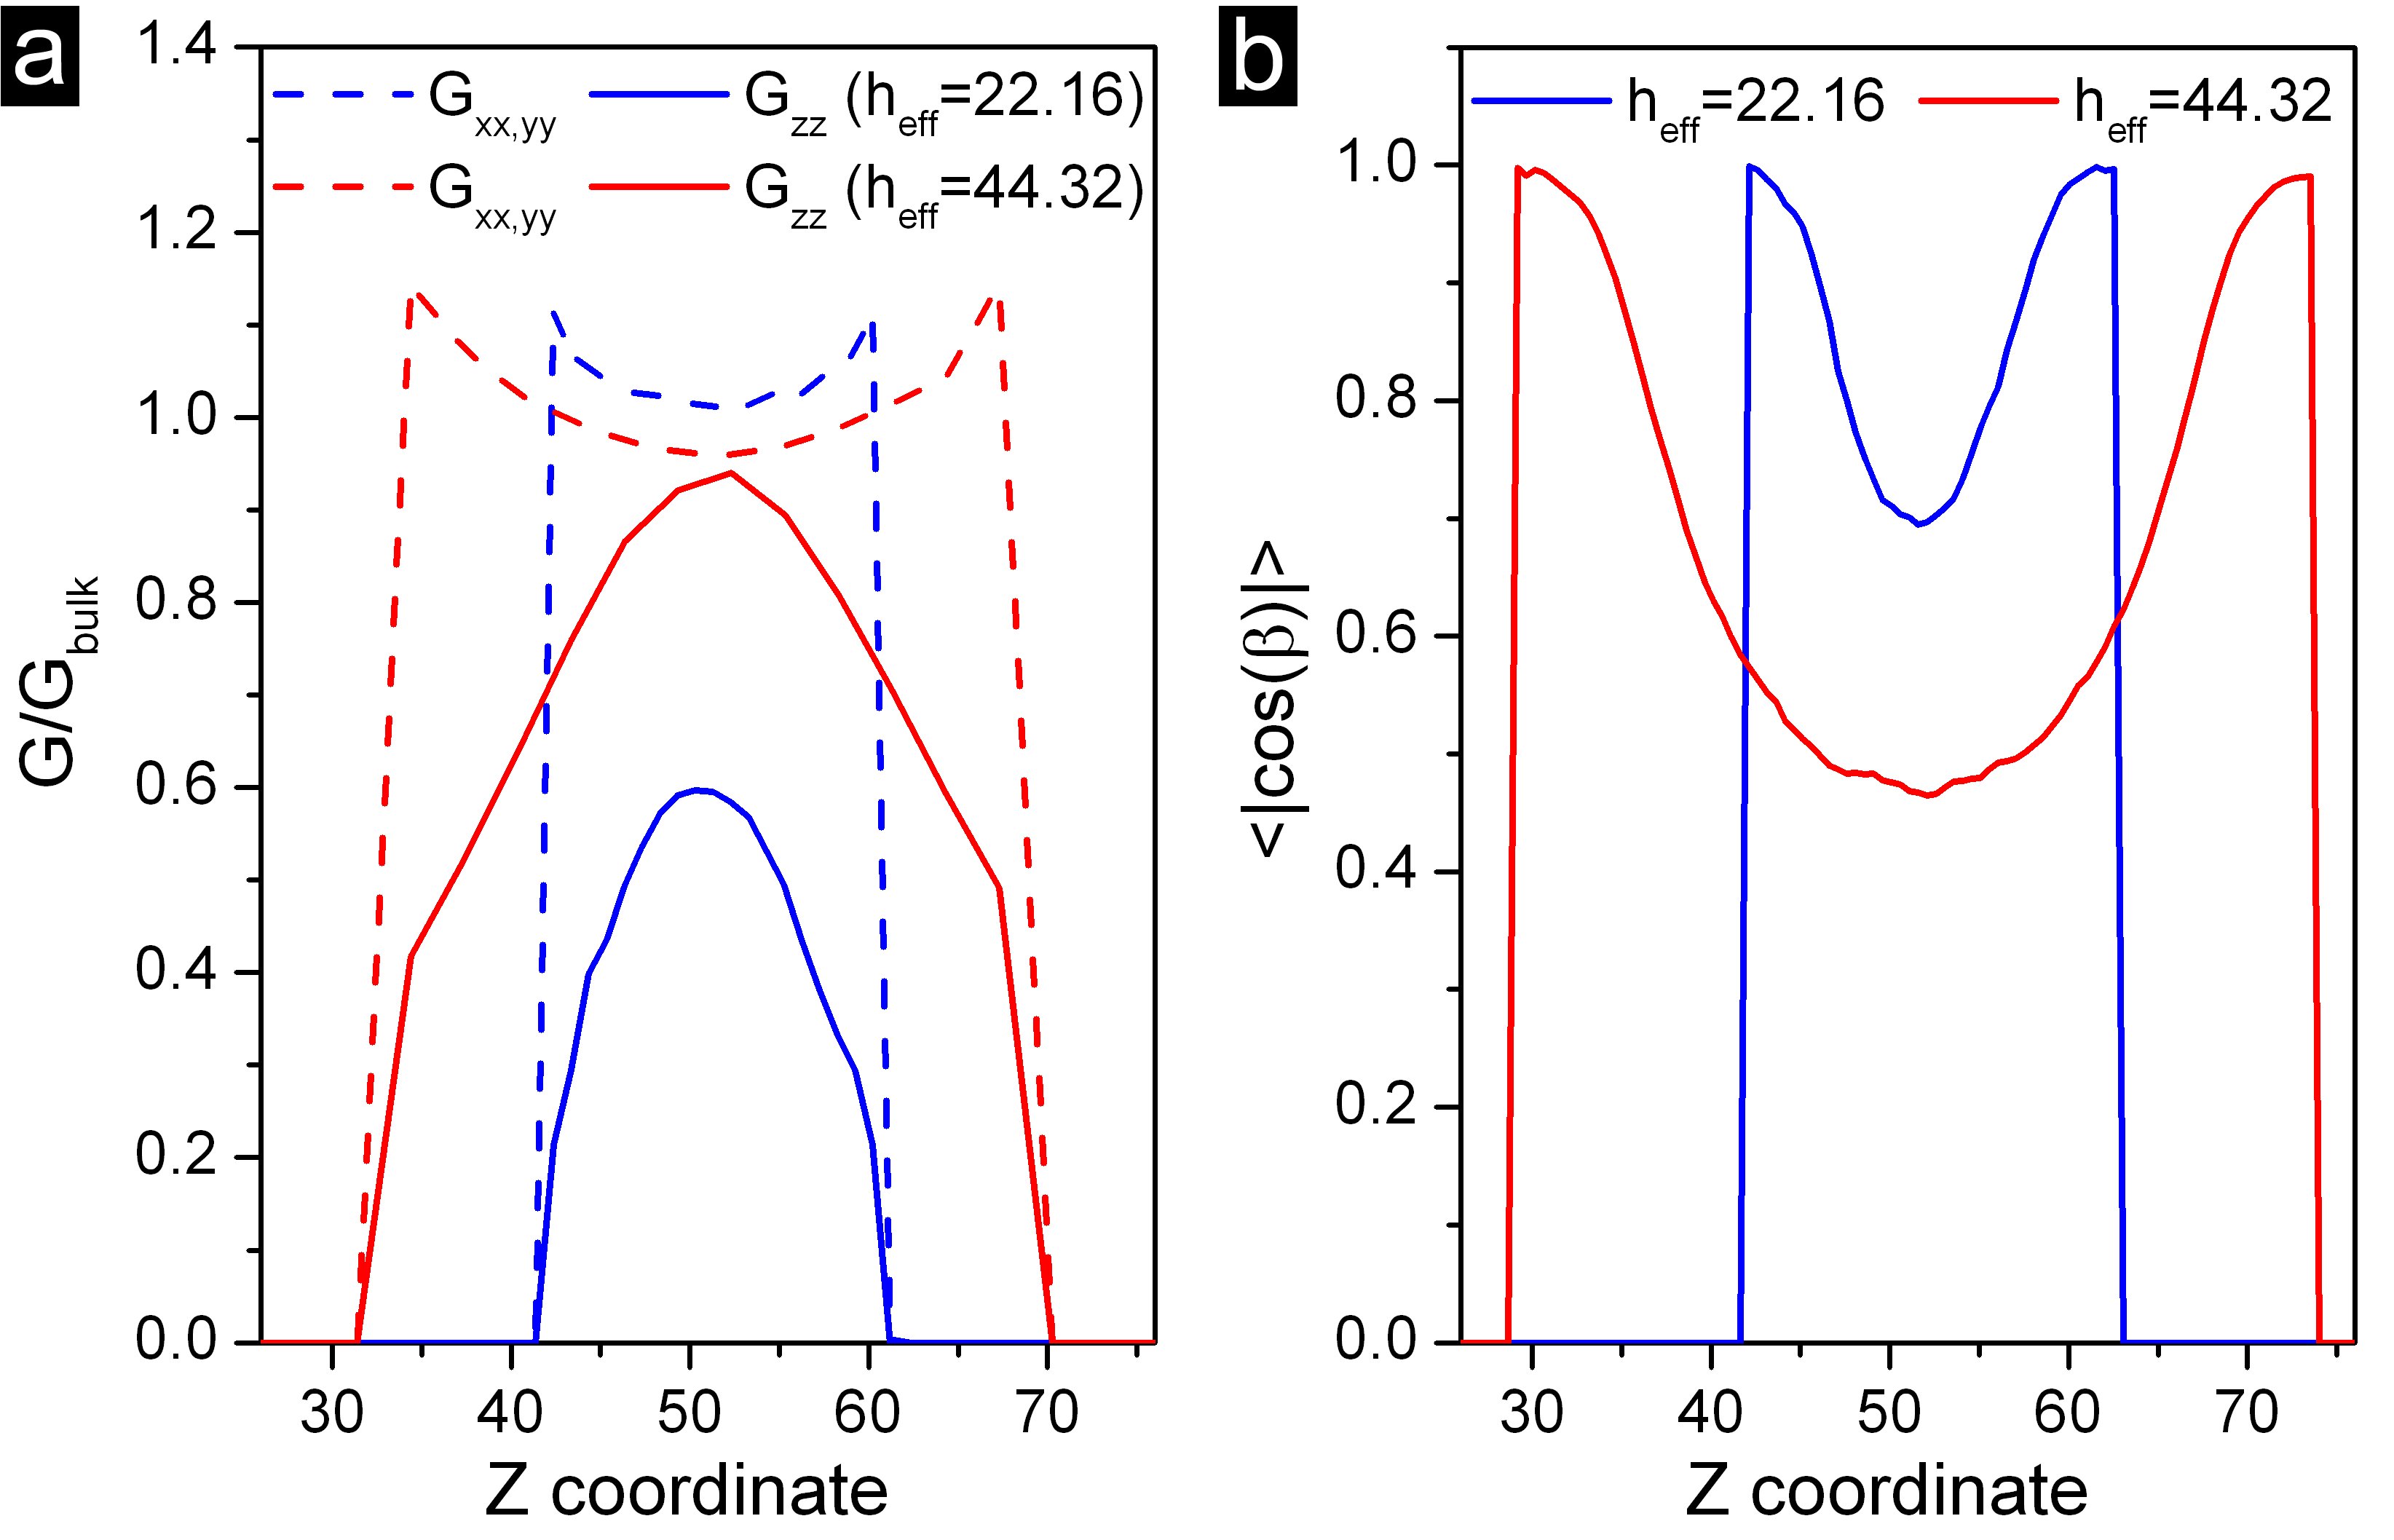
In order to check the second hypothesis (II), we analyzed the orientational probability distributions of the segments and vectors concerning the -direction for different degrees of confinement, here expressed as . These results are shown in Figure 7a, b and c where is immediately evident, at least globally speaking, the orientations present are not communicated to the length scale, shedding doubt on the validity of this second hypothesis.
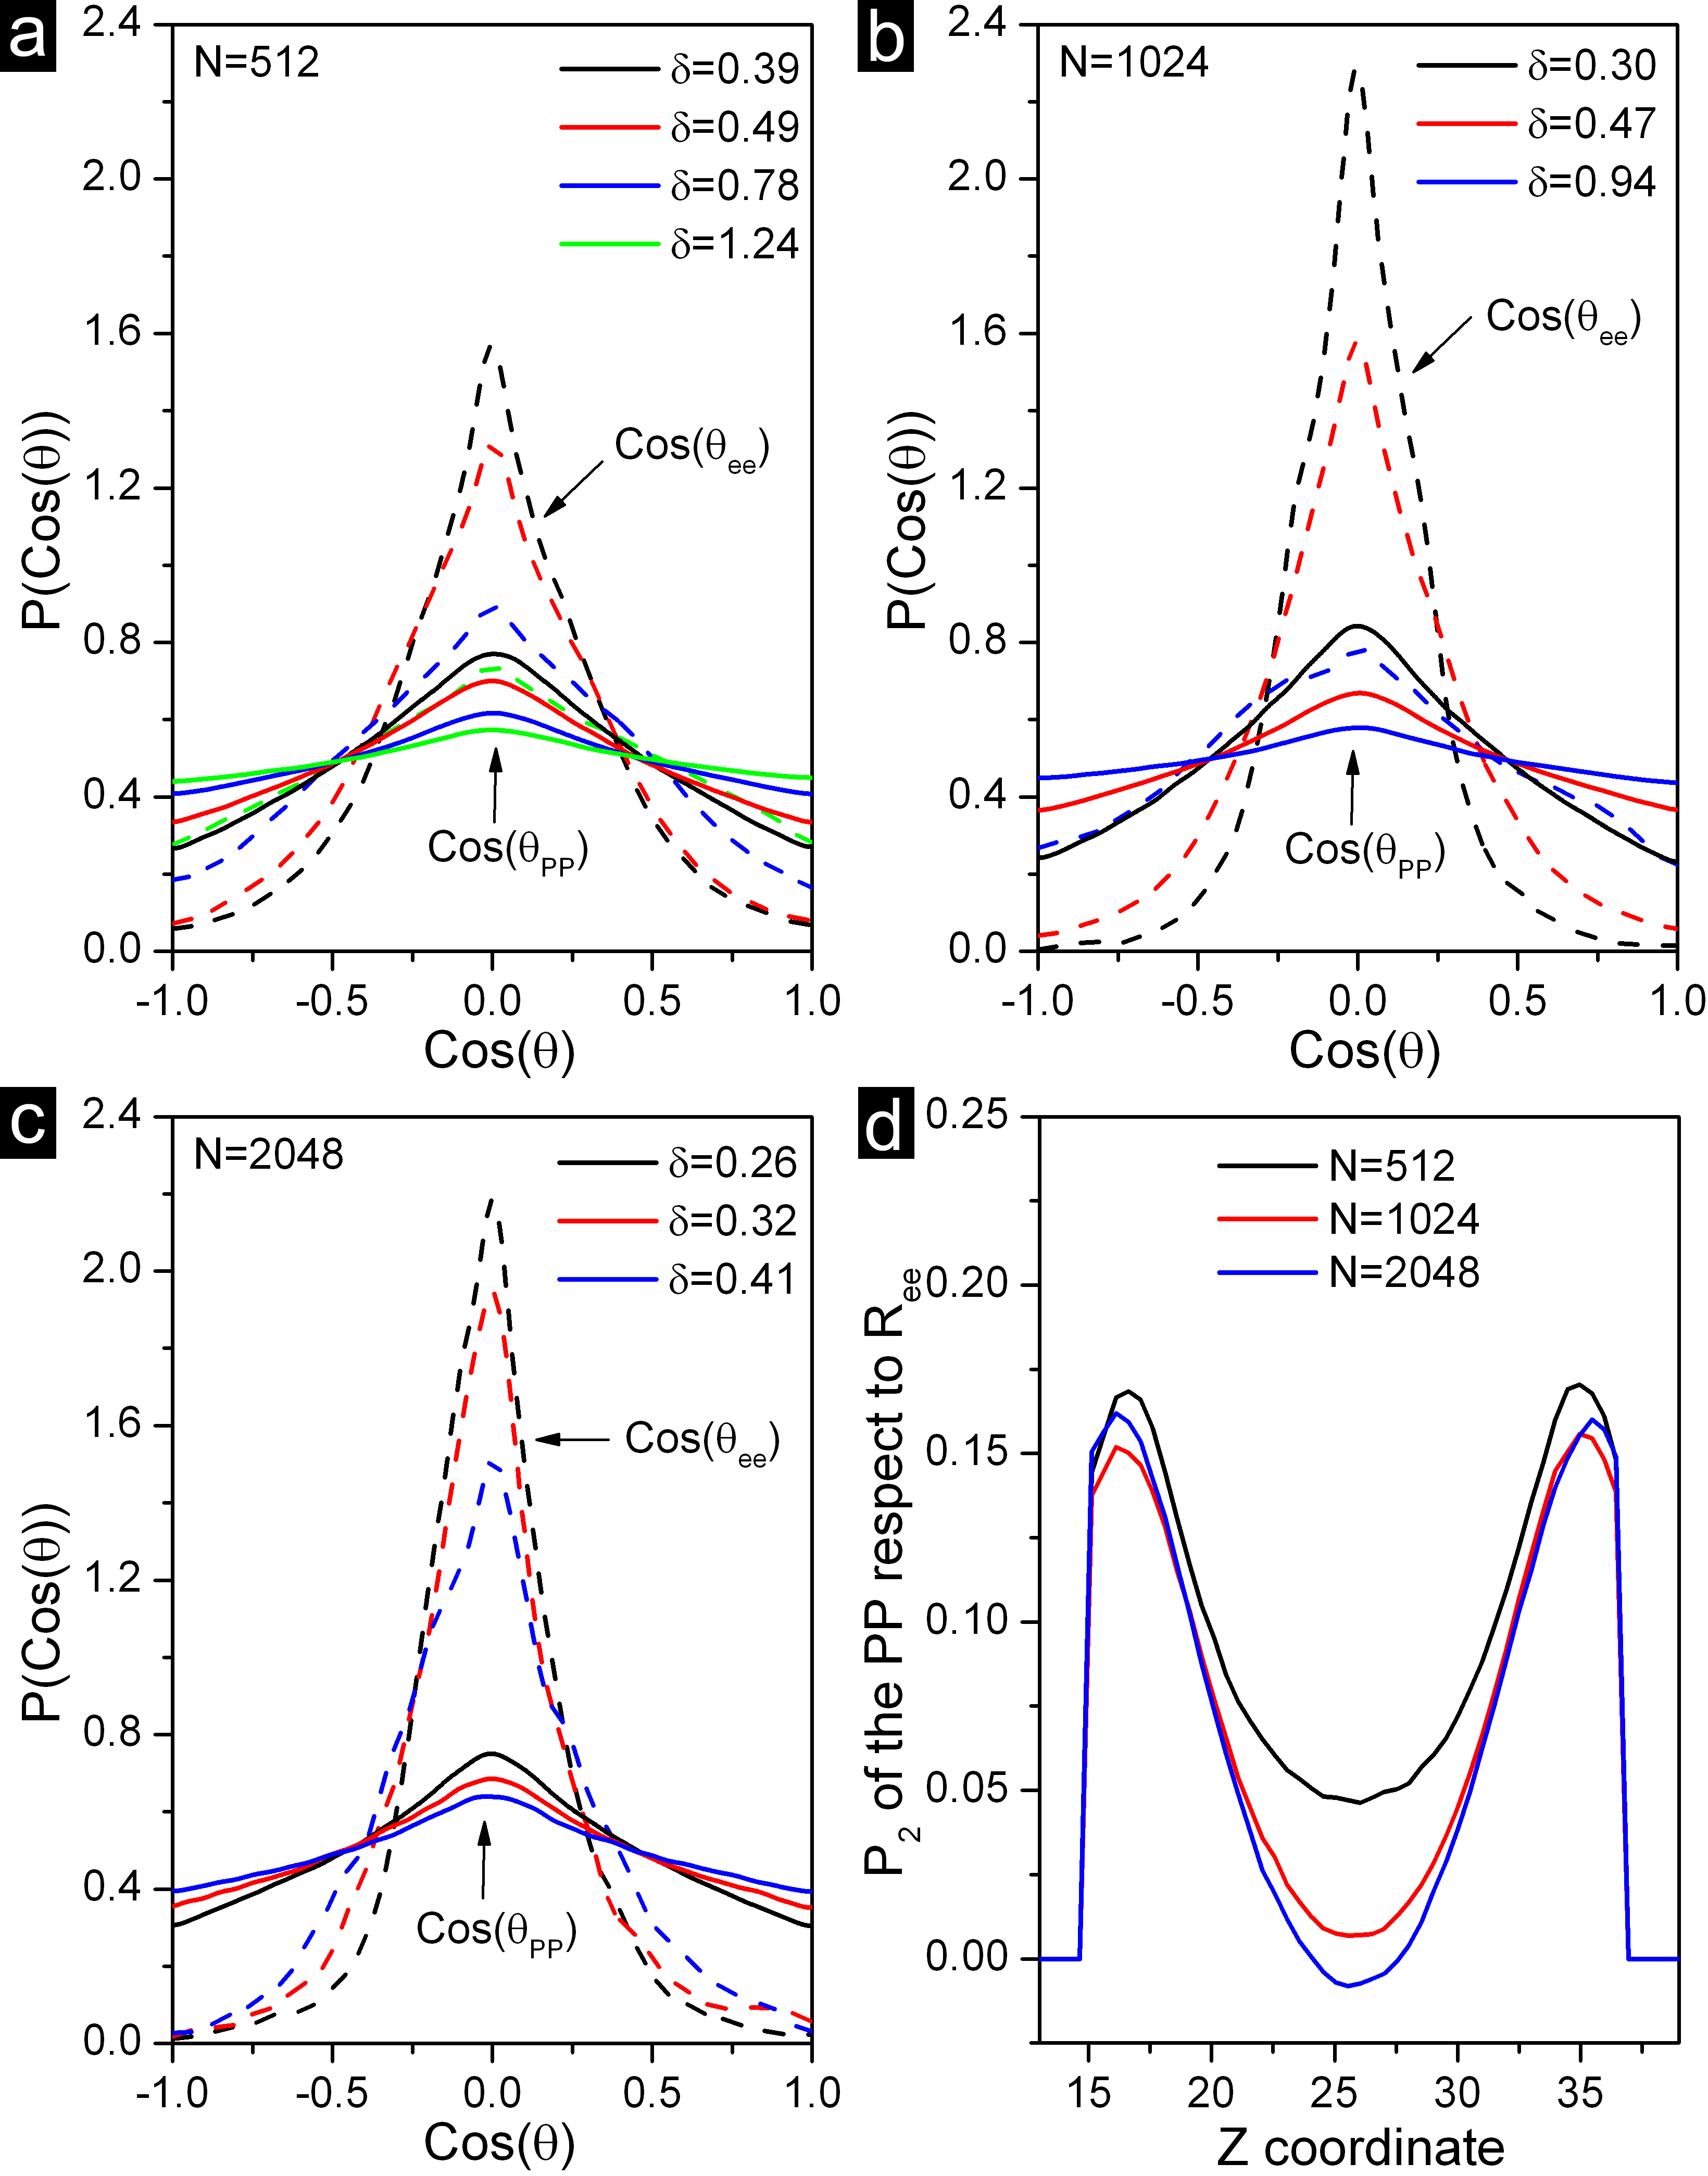
The chains are much more strongly oriented at the scale of the end-to-end vector than at the scale of the primitive path segments. The data in Figure 7a shows that as the confinement increases ( decreases) the two distribution become peaked around zero, i.e., the chain tend to lie parallel to the interface. However, the order of magnitude of the effect is much more pronounced for the end-to-end vector than for the primitive path segments.
Furthermore, this difference becomes more notable for longer chains. The distributions for becomes more peaked for (Figure 7b) and even more for (Figure 7c) for a similar degree of confinement, while the orientation of the primitive path seems insensitive to the chain length and only slightly dependent on .
In addition to this global analysis, we have studied the local behavior of both vectors to assess the possible existence of a local correlation. We have evaluated a profile of the order parameter for the angle between the end-to-end vector of a chain and the vectors (segments) belonging to this chain. The sketch in Figure 8 illustrates this idea and Figure 7d reports this observable.
The local correlation becomes more important near the surface, however, all values remain below , indicating a very poor orientational correlation between these vectors. Moreover, the range over which the correlation is felt appears to be independent of chain length, and for longer chains, the correlation is completely lost in the middle of the film.
Clearly, these observations indicate that, while the extension of the Silberberg model gives an accurate picture of the global chain conformation, the primitive path is much less affected by confinement than expected in the theory. Indeed, the thickness over which the orientation of the primitive path is affected does not appear to scale with molecular weight but is restricted to a finite thickness layer at the surface of the film. This leads to the deviation of from the scaling reported in figure 4.
3.4 Chains conformations and the importance of surface effect
Heretofore, we have studied how the confinement affects the statistics of entanglements and the distributions of end-to-end vectors or primitive paths segment self-confined free-standing films. In this section, we investigate how the confinement alters the global shape of the chains.
The first set of descriptors are the three diagonal components of the inertia tensor (or gyration tensor) , and . The squared gyration radius can be expressed as . Figure 9 shows the averaged value of these components normalized with the corresponding bulk value as a function of the position of the center of mass of the chain. To avoid redundancy of data, we report these observables for only two different thicknesses ( blue lines, red lines) built with chains of monomers, but the data obtained with varying lengths of chain are very similar.
In Figure 9a is possible to see that for both thicknesses (continuous lines) the component , associated with the direction of confinement, tends to induce a noticeable shrinking of the chains on that direction, i.e., the chains break their spatial isotropy and tend to adopt a flat shape near the surface. In counterpart, the components slightly change their values, increasing as much a compared to their bulk value (dashed lines in Figure 9a), which is in good agreement with previous works42.
Until now, we have used the tensor as is, expressed in the canonical system of reference , i.e., without diagonalizing in its principal axes. By diagonalizing the tensor and studying the cosine director of the eigenvector associated with the minimum eigenvalue (which represent the most important direction to where the chain is elongated), it is possible to know the main direction of this flatness. In Figure 9b is reported how the average orientation of this vector is dictated by the position of the chain within the film. Independently of the molecular weight, all chains are flat at the edges of the film, then this effect decreases monotonically while entering in the film. This idea is also in good agreement with the predicted compression of the end-to-end vector discussed in the previous section.
In Figure 9a and Figure 9b it is seen that the flattening alters the chain shape all across the film thickness for this chain-length (, ). In Figure 9a, at the edge of the thicker film (, red lines) the chain compression reaches a maximum of around compared to its bulk value as is evidenced in the component of the radius gyration perpendicular to the plane of confinement (). Then, the compression decreases monotonically along the film achieving a bulk-like state in the center. Considering here that the film thickness is around two times (i.e., the chain size is comparable with the film thickness) it is reasonable that the chain whose center of mass is located roughly in the middle film adopt bulk-like conformations.
In the case of the thinner film (, blue lines) the chains experience a stronger shrinkage at the boundary, and although the effect decreases inside the film, the bulk state is not reached in the center. Which is also reasonable due to this thickness is almost the half of the chain size (), so the chain conformation is strongly confined. Even in the center of the film the chain reaches only around half of its bulk size in the -direction. This simple analysis provide an accurate picture of the chain conformations across the film.
3.5 Primitive path network under confinement
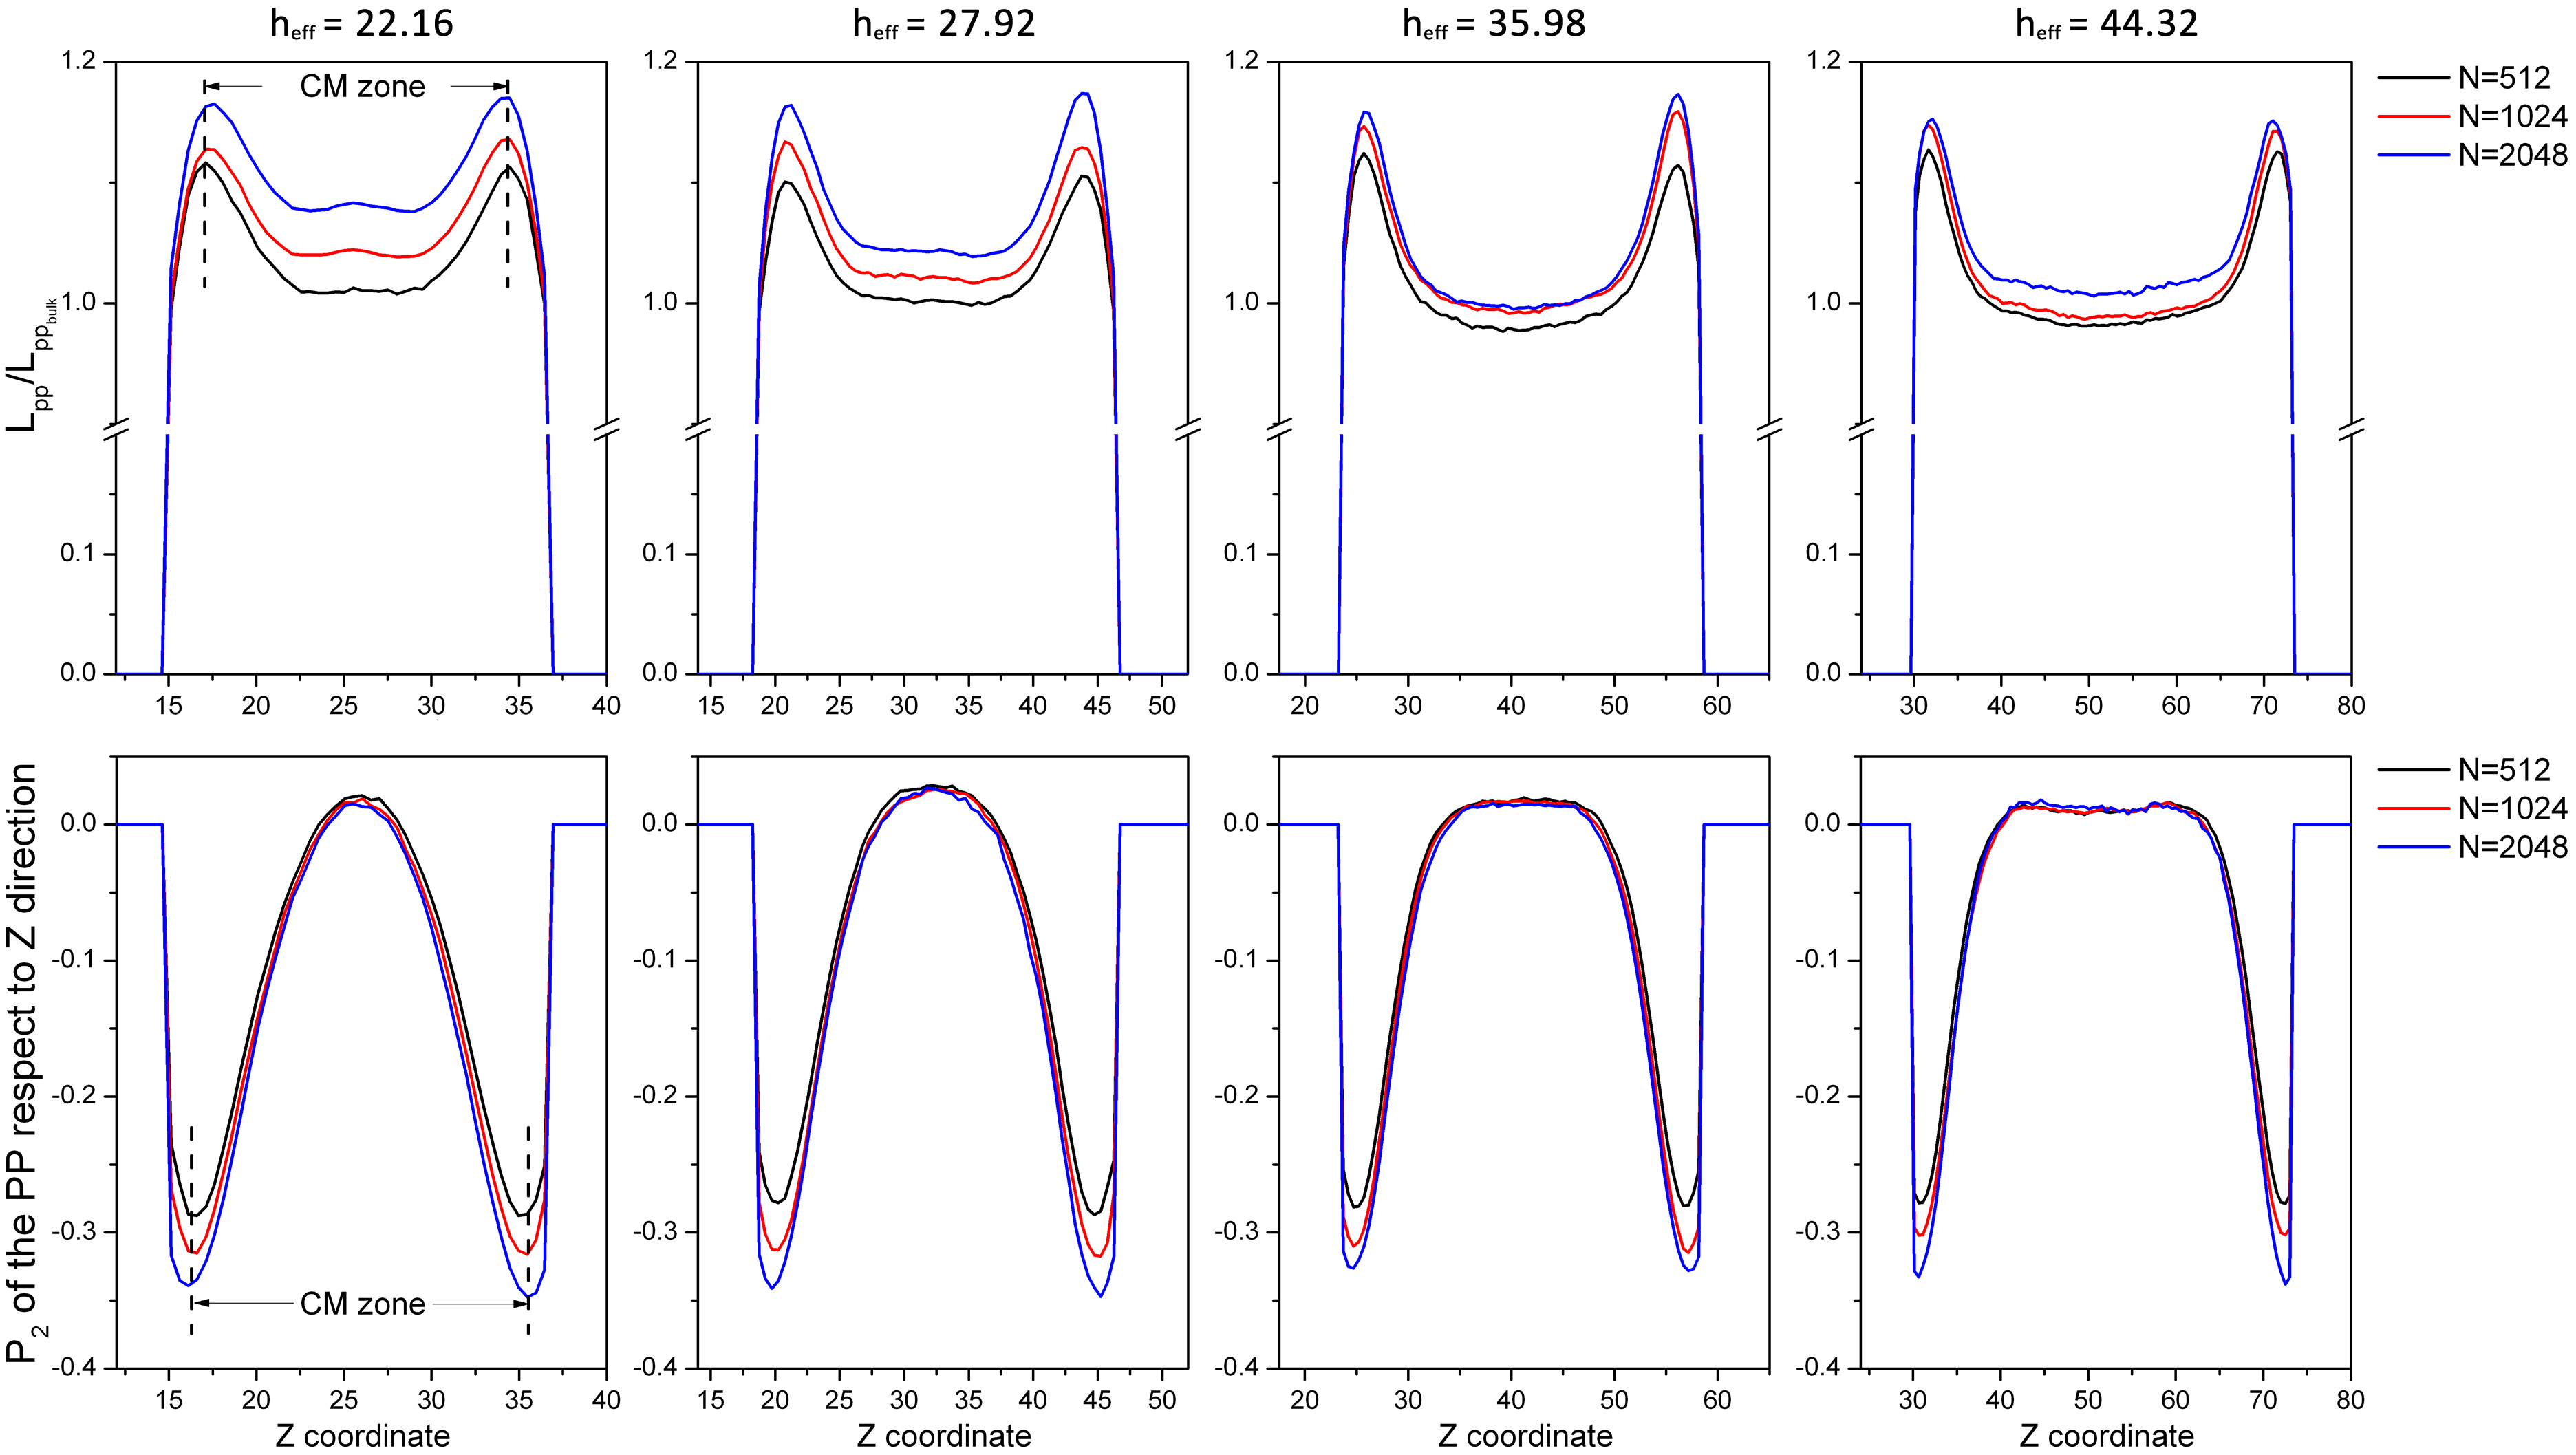
In this section, we study how the confinement impacts the primitive path network. To quantify this confinement effect, we have calculated the profiles across the film of two characteristic quantities of the segments. One is the profile of the order parameter for the angle between the segments and the normal to the plane of confinement () and the other one is the length of the segments. The location within the film was computed using the geometrical center of the segments.
Here, is relevant to mention that we just will consider these observables inside of the called “center of mass zone” (marked as CM zone in Figure 10)), i.e., the zone within the film reachable by the centers of mass of chains. Due to the nature of the segments, they can exist beyond the space reachable by the center of mass of the chains and that is the reason of why ( of ) after achieving a maximum(minimum) goes to zero. We note that the location of these extrema coincides with the boundary of the center of the mass zone. Beyond this limit, the data is mostly related to the tails of the chains.
Interestingly, we found that the primitive path segments are quite insensitive to the confinement and the chain-length exhibit two characteristic weak response depending on their location within the film. There is a relatively vast region of the center-film where the length of the segments is constant, and at some point, near to the edge, their length increases monotonically, stretching up to . We note that the starting point for these deviations is at a distance of around one segment length of from the edge. This seems reasonable if we consider that the segments contributing statistically to this part of the data are in the zone of maximum chain compression and, as we explained before, decreases the number of entanglement locally increasing at the same time segments length. Furthermore, this compression forces the to align parallel to the surface of confinement as seen in the bottom graphs showing in figure 10, where the negative number indicates perpendicularity with the -direction.
This behavior seems universal for the network and only weakly dependent on the confinement strength and the molecular weight. Only for strong confinement (, ), the curves obtained for different molecular weights slightly depart from each other by a small vertical shift.
4 Summary and conclusions
In summary, we have performed an analysis of entanglement statistics in a coarse-grained model of free-standing thin films made out of long linear polymers.
We found that the geometric confinement breaks the isotropic conformation of the chains, compressing and flattening their shape in the direction perpendicular to the plane of confinement as is shown in Figure 9a and 9b. This anisotropic contraction seems not completely compensated in the other direction, and their lateral extension increases by just around ( in Figure 9a), which results in an effective decrease of the volume pervaded by the chain.
This decrease in the pervaded volume reduces the number of neighbor chains inside the shared volume, lowering the potential contacts between them, with as chief consequence the effective reduction of entanglements, while the monomer density remains constant. However, the flattening effect is poorly captured by the network, as is reported in Figure 10. First, for all chain length under weak confinement (), the segments seems to be unaffected and behave in a bulk-like manner for a wide range in the center of the film. It is only near to the surface that the flattening becomes more important, inducing the segments to becomes parallel to the surface of confinement and increasing slightly (around a ) their length. This pronounced change in both observables takes place when the is within a distance comparable to from the surface.
In the first two graphs of in Figure 10 it is notable how, under strong confinement, () only the segments associated with longer chains shift their length slightly (just around with respect to the bulk value) inside the film while conserving the characteristic effect of increasing near to the film edge.
We also performed a comparison of our data with the theory proposed in Ref. 19, which models the entanglement reduction in confined systems as a function of the strength of confinement. After detailed tests of the central hypothesis, we found evidence that the second hypothesis: “the oriental correlation at the end-to-end vector scales created by geometric confinement are directly communicated to the primitive path network”, seems not to be right. In fact, we found substantial evidence that these vectors have uncorrelated orientations, except for a thin layer close to the surface, and this effect is even more notable for longer chains. However, the extension of the Silberberg model proposed by the same authors fits the results for the chain conformation quite well in all the simulated range. A better understanding of the response of the primitive path to global chain deformation would be desirable to generalize the ideas of Ref. 19.
5 Appendix I
As mentioned in section II, since the interparticle potential used in this study is built with a soft-core repulsion and an attractive tail, depending on the relative weight of both interaction a problem of thermodynamic stability may arise. Thus, to ensure the stability of our system it was necessary to determine a safety range of values for the independent parameter (see Eq. 4).
Originally, the theoretical framework for predicting the stability of these kinds of systems was provided by Fisher and Ruelle26, 27. According to Proposition 3.2.2 in Ref. 27 the stability is ensured if the total potential energy of a given system with particles interacting through a pair potential satisfies the inequality:
| (7) |
where is the vector position of the particle , and is a finite constant independent of . This inequality ensures the convergence of the grand partition function.
Beyond this formal criterion, Fisher and Ruelle also provided two more straightforward rules which help one to decide whether a potential will lead to a steady thermodynamic state. The first criterion is a weaker condition:
| (8) |
which is necessary but not sufficient, i.e., if the system is unstable.
A sufficient condition for stability is that given in Ref. 26
| (9) |
with the following equivalent form28:
| (10) |
that must be verified for all . Then, applying this criterion to our potential (replacing Eq. 4 in Eq. 10) and integrating, an inequality in terms of is obtained:
| (11) |
where is easy to see that the sign of this expression is given for the expression inside the parenthesis:
| (12) |
as all other terms are positive. Moreover, in Eq. 12 is clear that the term is greater or equal to 1 for all values, and in particular the inequality is verified independently of if . Then and since this inequality should be satisfied for all values, without loss of generality we can take , so the final condition is reduced to:
| (13) |
which is always satisfied if:
| (14) |
Finally, taking in the interval ensures the thermodynamic stability for our system.
We are grateful to Prof. Martin Kröger (ETH Zürich) for his help with the algorithm.
References
- Doi and Edwards 1986 Doi, M.; Edwards, S. F. The theory of polymer dynamics; Internat. Ser. Mono. Phys.; Oxford Univ. Press: Oxford, 1986
- de Gennes 1971 de Gennes, P. G. Reptation of a Polymer Chain in the Presence of Fixed Obstacles. The Journal of Chemical Physics 1971, 55, 572–579
- de Gennes 1976 de Gennes, P. G. Dynamics of Entangled Polymer Solutions. II. Inclusion of Hydrodynamic Interactions. Macromolecules 1976, 9, 594–598
- Edwards 1965 Edwards, S. F. The statistical mechanics of polymers with excluded volume. Proceedings of the Physical Society 1965, 85, 613–624
- Edwards 1967 Edwards, S. F. The statistical mechanics of polymerized material. Proceedings of the Physical Society 1967, 92, 9
- Rayss et al. 1993 Rayss, J.; PodkośCielny, W. M.; Widomski, J. The properties of polymer protective coatings of optical fibers. I. The influence of active diluent concentration on the properties of UV-cured epoxyacrylate coatings. Journal of Applied Polymer Science 1993, 49, 835–838
- Zhang and Bell 1999 Zhang, X.; Bell, J. P. Synthesis of protective coatings on steel by surface spontaneous polymerization. 3: Process development and coating property studies. Polymer Engineering & Science 1999, 39, 119–127
- Marencic and Register 2010 Marencic, A. P.; Register, R. A. Controlling Order in Block Copolymer Thin Films for Nanopatterning Applications. Annual Review of Chemical and Biomolecular Engineering 2010, 1, 277–297, PMID: 22432582
- Tsui and Zhang 2001 Tsui, O. K. C.; Zhang, H. F. Effects of Chain Ends and Chain Entanglement on the Glass Transition Temperature of Polymer Thin Films. Macromolecules 2001, 34, 9139–9142
- Rathfon et al. 2011 Rathfon, J. M.; Cohn, R. W.; Crosby, A. J.; Rothstein, J. P.; Tew, G. N. Confinement Effects on Chain Entanglement in Free-Standing Polystyrene Ultrathin Films. Macromolecules 2011, 44, 5436–5442
- Campise et al. 2017 Campise, F.; Agudelo, D. C.; Acosta, R. H.; Villar, M. A.; Vallés, E. M.; Monti, G. A.; Vega, D. A. Contribution of Entanglements to Polymer Network Elasticity. Macromolecules 2017, 50, 2964–2972
- Aoki et al. 2008 Aoki, H.; Morita, S.; Sekine, R.; Ito, S. Conformation of Single Poly(methyl methacrylate) Chains in an Ultra-Thin Film Studied by Scanning Near-Field Optical Microscopy. Polymer Journal 2008, 40
- Chappa et al. 2012 Chappa, V. C.; Morse, D. C.; Zippelius, A.; Müller, M. Translationally invariant slip-spring model for entangled polymer dynamics. Physical Review Letters 2012, 109, 1–5
- Del Biondo et al. 2013 Del Biondo, D.; Masnada, E. M.; Merabia, S.; Couty, M.; Barrat, J.-L. Numerical study of a slip-link model for polymer melts and nanocomposites. Journal of Chemical Physics 2013, 138
- Masnada et al. 2013 Masnada, E.; Merabia, S.; Couty, M.; Barrat, J.-L. Entanglement-induced reinforcement in polymer nanocomposites. Soft Matter 2013, 9, 10532–10544
- Ramírez-Hernández et al. 2013 Ramírez-Hernández, A.; Müller, M.; de Pablo, J. J. Theoretically informed entangled polymer simulations: linear and non-linear rheology of melts. Soft Matter 2013, 9, 2030
- Ramírez-Hernández et al. 2015 Ramírez-Hernández, A.; Peters, B. L.; Andreev, M.; Schieber, J. D.; de Pablo, J. J. A multichain polymer slip-spring model with fluctuating number of entanglements for linear and nonlinear rheology. The Journal of Chemical Physics 2015, 143, 243147
- Ramírez-Hernández et al. 2017 Ramírez-Hernández, A.; Peters, B. L.; Schneider, L.; Andreev, M.; Schieber, J. D.; Müller, M.; De Pablo, J. J. A multi-chain polymer slip-spring model with fluctuating number of entanglements: Density fluctuations, confinement, and phase separation. Journal of Chemical Physics 2017, 146
- Sussman et al. 2014 Sussman, D. M.; Tung, W.-S.; Winey, K. I.; Schweizer, K. S.; Riggleman, R. A. Entanglement Reduction and Anisotropic Chain and Primitive Path Conformations in Polymer Melts under Thin Film and Cylindrical Confinement. Macromolecules 2014, 47, 6462–6472
- Sussman 2016 Sussman, D. M. Spatial distribution of entanglements in thin free-standing films. Physical Review E 2016, 94, 1–9
- Korolkovas et al. 2016 Korolkovas, A.; Gutfreund, P.; Barrat, J.-L. Simulation of entangled polymer solutions. The Journal of Chemical Physics 2016, 145, 124113
- Korolkovas et al. 2017 Korolkovas, A.; Rodriguez-Emmenegger, C.; de los Santos Pereira, A.; Chennevière, A.; Restagno, F.; Wolff, M.; Adlmann, F. A.; Dennison, A. J. C.; Gutfreund, P. Polymer Brush Collapse under Shear Flow. Macromolecules 2017, 50, 1215–1224
- Louis et al. 2000 Louis, A. A.; Bolhuis, P. G.; Hansen, J. P. Mean-field fluid behavior of the Gaussian core model. Phys. Rev. E 2000, 62, 7961–7972
- Brańka and Heyes 2008 Brańka, A. C.; Heyes, D. M. Thermodynamic and mechanical stability of many-body systems interacting with coarse-grained bounded potentials. physica status solidi (b) 2008, 245, 2415–2421
- Heyes 2010 Heyes, D. M. Thermodynamic stability of soft-core Lennard-Jones fluids and their mixtures. The Journal of Chemical Physics 2010, 132, 064504
- Fisher and Ruelle 1966 Fisher, M. E.; Ruelle, D. The Stability of Many-Particle Systems. Journal of Mathematical Physics 1966, 7, 260–270
- David 1999 David, R. Statistical Mechanics: Rigorous Results; World Scientific Publishing Company, 1999
- Heyes and Rickayzen 2007 Heyes, D. M.; Rickayzen, G. The stability of many-body systems. Journal of Physics: Condensed Matter 2007, 19, 416101
- Subramanian 2010 Subramanian, G. A topology preserving method for generating equilibrated polymer melts in computer simulations. Journal of Chemical Physics 2010, 133
- Kröger 2005 Kröger, M. Shortest multiple disconnected path for the analysis of entanglements in two- and three-dimensional polymeric systems. Computer Physics Communications 2005, 168, 209–232
- Shanbhag and Kröger 2007 Shanbhag, S.; Kröger, M. Primitive path networks generated by annealing and geometrical methods: Insights into differences. Macromolecules 2007, 40, 2897–2903
- Karayiannis and Kröger 2009 Karayiannis, N. C.; Kröger, M. Combined molecular algorithms for the generation, equilibration and topological analysis of entangled polymers: Methodology and performance. International Journal of Molecular Sciences 2009, 10, 5054–5089
- Hoy et al. 2009 Hoy, R. S.; Foteinopoulou, K.; Kröger, M. Topological analysis of polymeric melts: Chain-length effects and fast-converging estimators for entanglement length. Physical Review E - Statistical, Nonlinear, and Soft Matter Physics 2009, 80, 14–16
- Lin 1987 Lin, Y. H. Number of entanglement strands per cubed tube diameter, a fundamental aspect of topological universality in polymer viscoelasticity. Macromolecules 1987, 20, 3080–3083
- Kavassalis and Noolandi 1988 Kavassalis, T. A.; Noolandi, J. A new theory of entanglements and dynamics in dense polymer systems. Macromolecules 1988, 21, 2869–2879
- Fetters et al. 1994 Fetters, L. J.; Lohse, D. J.; Richter, D.; Witten, T. A.; Zirkel, A. Connection between Polymer Molecular Weight, Density, Chain Dimensions, and Melt Viscoelastic Properties. Macromolecules 1994, 27, 4639–4647
- Si et al. 2005 Si, L.; Massa, M. V.; Dalnoki-Veress, K.; Brown, H. R.; Jones, R. A. L. Chain Entanglement in Thin Freestanding Polymer Films. Phys. Rev. Lett. 2005, 94, 127801
- Liu et al. 2015 Liu, Y.; Chen, Y.-C.; Hutchens, S.; Lawrence, J.; Emrick, T.; Crosby, A. J. Directly Measuring the Complete Stress-Strain Response of Ultrathin Polymer Films. Macromolecules 2015, 48, 6534–6540
- Cavallo et al. 2005 Cavallo, A.; Müller, M.; Wittmer, J. P.; Johner, A.; Binder, K. Single chain structure in thin polymer films: corrections to Flory’s and Silberberg’s hypotheses. Journal of Physics: Condensed Matter 2005, 17, S1697
- Vladkov and Barrat 2007 Vladkov, M.; Barrat, J.-L. Local Dynamics and Primitive Path Analysis for a Model Polymer Melt near a Surface. Macromolecules 2007, 40, 3797–3804
- Silberberg 1982 Silberberg, A. Distribution of conformations and chain ends near the surface of a melt of linear flexible macromolecules. Journal of Colloid and Interface Science 1982, 90, 86 – 91
- Müller 2002 Müller, M. Chain conformations and correlations in thin polymer films: A Monte Carlo study. The Journal of Chemical Physics 2002, 116, 9930–9938