BAT AGN Spectroscopic Survey – XII. The relation between coronal properties of Active Galactic Nuclei and the Eddington ratio
Abstract
The bulk of the X-ray emission in Active Galactic Nuclei (AGN) is produced very close to the accreting supermassive black hole (SMBH), in a corona of hot electrons which up scatters optical and ultraviolet photons from the accretion flow. The cutoff energy () of the primary X-ray continuum emission carries important information on the physical characteristics of the X-ray emitting plasma, but little is currently known about its potential relation with the properties of accreting SMBHs. Using the largest broad-band (0.3–150 keV) X-ray spectroscopic study available to date, we investigate how the corona is related to the AGN luminosity, black hole mass and Eddington ratio (). Assuming a slab corona the median values of the temperature and optical depth of the Comptonizing plasma are keV and , respectively. When we properly account for the large number of lower limits, we find a statistically significant dependence of the cutoff energy on the Eddington ratio. In particular, objects with have a significantly lower median cutoff energy ( keV) than those with ( keV). This is consistent with the idea that radiatively compact coronae are also cooler, because they tend to avoid the region in the temperature-compactness parameter space where runaway pair production would dominate. We show that this behaviour could also straightforwardly explain the suggested positive correlation between the photon index () and the Eddington ratio, being able to reproduce the observed slope of the trend.
keywords:
galaxies: active — X-rays: general — galaxies: Seyfert — quasars: general — quasars: supermassive black holes1 Introduction
Accreting supermassive black holes (SMBHs) are known to ubiquitously produce radiation in the X-ray band. The X-ray emission of these Active Galactic Nuclei (AGN) is thought to be produced in a corona of hot electrons, which up-scatters optical and UV photons into the X-ray band through inverse Compton scattering (e.g., Haardt & Maraschi 1991, 1993; Merloni & Fabian 2001; Merloni 2003; Liu et al. 2015, 2017). The size of the X-ray corona has been shown to be relatively small (, where is the gravitational radius for a SMBH of mass ) from the rapid X-ray variability (e.g., McHardy et al. 2005), and the short timescales of X-ray eclipses (e.g., Risaliti et al. 2005, 2011). This has been also confirmed by microlensing studies (e.g., Chartas et al. 2009), which have found a half-light radius of the corona of . Reverberation studies of X-ray radiation reprocessed by the accretion disk have suggested that the X-ray source is located very close to the SMBH and the accretion disk (e.g., Fabian et al. 2009; Zoghbi et al. 2012; De Marco et al. 2013; Kara et al. 2013; Reis & Miller 2013), typically within . Despite these advances in localization and size estimates of the X-ray source, its physical characteristics are still debated. Besides providing critical insights on the physics of the innermost regions of SMBHs, a clear understanding of the typical characteristics of the X-ray emitting plasma for different intervals of the accretion rate is extremely important to assess the impact of radiative heating (Xie et al. 2017) in the feedback process linking AGN to their host galaxies (e.g. Ferrarese & Merritt 2000; Gebhardt et al. 2000; Schawinski et al. 2006; Fabian 2012; Kormendy & Ho 2013; King & Pounds 2015).
X-ray spectroscopy, and in particular the study of the primary X-ray emission produced in the Comptonizing plasma, can provide important insights on the physical parameters of the corona, such as its temperature () and optical depth (). The two main spectral parameters carrying information on the physical properties of the X-ray corona are the photon index () and the energy of the cutoff (; e.g., Mushotzky et al. 1993). While the photon index has been routinely studied over the past two decades by observations carried out in the 0.3–10 keV band, the cutoff energy has been more difficult to constrain, since it requires good-quality data above 10 keV. Indirect constraints on the cutoff energy have been obtained by Gilli et al. (2007) who, studying the cosmic X-ray background (CXB, see also Treister et al. 2009), showed that the mean cutoff energy should lie below 300 keV; Treister & Urry (2005) and Ueda et al. (2014) were able to reproduce the CXB assuming ; fitting the X-ray luminosity function of local AGN in four energy bands, Ballantyne (2014) found that the typical cutoff energy should be keV. Spectroscopic studies carried out using the Gamma Ray Observatory/OSSE (e.g., Zdziarski et al. 1996; Johnson et al. 1997), BeppoSAX (e.g., Nicastro et al. 2000; Dadina 2007), INTEGRAL IBIS/ISGRI (e.g., Beckmann et al. 2009; Molina et al. 2009; Lubiński et al. 2010, 2016; Ricci et al. 2011; Panessa et al. 2011; de Rosa et al. 2012; Malizia et al. 2014), Swift/BAT (e.g., Vasudevan et al. 2013) and Suzaku/PIN (e.g., Tazaki et al. 2011) were able to constrain the cutoff energies of several local bright AGN.
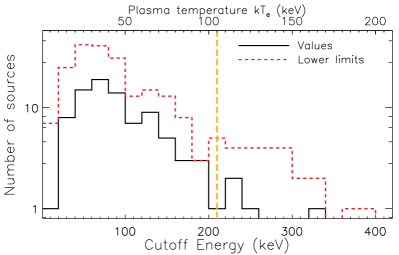
More recently, in Ricci et al. (2017a), we carried out the largest study of broad-band X-ray spectra (0.3–150 keV) to date (836 AGN), showing that, in the large majority () of the non-blazar AGN, the spectral slope of the 14–195 keV emission is steeper than that in the 0.3–10 keV band. This suggests that a high-energy cutoff is almost ubiquitous in AGN. The detailed broad-band X-ray spectral analysis of all sources of the sample showed that the median value of the cutoff energy of local AGN is keV (Ricci et al. 2017a). The recent launch of NuSTAR (Harrison et al. 2013) has greatly improved our understanding of cutoff energies, allowing to accurately constrain this parameter for a growing number of AGN, most of which reside at low redshifts (e.g., Ballantyne et al. 2014; Brenneman et al. 2014; Matt et al. 2014; Marinucci et al. 2014; Baloković et al. 2015; Matt et al. 2015; Parker et al. 2014; Ursini et al. 2015; Lohfink et al. 2015, 2017; Lanzuisi et al. 2016; Kara et al. 2017; Xu et al. 2017; Tortosa et al. 2017, 2018a, 2018b). Exploiting the revolutionary capabilities of NuSTAR, Fabian et al. (2015; see also Fabian et al. 2017) have shown that coronae lie close to the boundary of the region in the temperature–compactness parameter space which is forbidden due to runaway pair production (see §4). Studying 19 Swift/BAT AGN with NuSTAR, Tortosa et al. (2018b) found no evidence of a significant correlation between and black hole mass or Eddington ratio. However, the sample of bright AGN that are observed by NuSTAR and have reliable determinations of these key SMBH properties is still small, and does not allow to exclude the existence of relations between the coronal properties and the physical characteristics of the SMBH.
In order to improve our understanding of the properties of accreting SMBHs in the local Universe, our group has been systematically studying the properties of Swift/BAT AGN across the electromagnetic spectrum, in the framework of the BAT AGN Spectroscopic Survey (BASS111http://www.bass-survey.com, Koss et al. 2017; Ricci et al. 2017a). Previous publications based on BASS have studied the optical lines (Berney et al. 2015; Oh et al. 2017), the near-infrared emission (Lamperti et al. 2017), the X-ray photon index (Trakhtenbrot et al. 2017) and the absorption properties (Ricci et al. 2015, 2017b; Shimizu et al. 2018) of Swift/BAT AGN. Exploiting the rich multi-wavelength database available for BASS AGN, here we investigate the relation between the high-energy cutoff and the fundamental properties of AGN, such as their luminosity (), black hole mass () and Eddington ratio (, see Eq. 1). The paper is structured as follows. In §2 we introduce the sample used for this work, while in §3 we study how the cutoff energy is related to luminosity, black hole mass and Eddington ratio, showing that AGN accreting at high Eddington ratios () typically have lower cutoff energies than those accreting at lower Eddington ratios (). In §4 we discuss how our sources are distributed in the temperature–compactness parameter space, and how this relates to the dissimilar typical cutoff energies of AGN populations accreting at different . In §5 we investigate the relation between the optical depth of the Comptonizing plasma and the properties of the accreting SMBH. In §6 we show how the fact that AGN avoid the region in the temperature–compactness parameter space where runaway pair production takes place would produce the observed correlation between the photon index and the Eddington ratio. Finally, in §7 we present our conclusions and summarise our findings.
2 BASS: Sample and Data
The Burst Alert Telescope (BAT, Barthelmy et al. 2005) on board the Neil Gehrels Swift Observatory (Gehrels et al. 2004) has been scanning the whole sky in the 14-195 keV band since its launch in 2005, detecting 838 AGN in the first 70-months of operations (Baumgartner et al. 2013; Ricci et al. 2017a). The multi-wavelength survey BASS has collected data in the radio, infrared, optical and X-rays for the large majority of these objects. In the following, we report on the X-ray (§2.1) and optical (§2.2) data used for this work.
2.1 X-ray data
The cutoff energies and the AGN luminosities used here are taken from the BASS X-ray catalogue (Ricci et al. 2017a), which reports the broad-band X-ray spectral properties for the 836 AGN detected by Swift/BAT in its first 70 months of operations ( of the total sample) for which soft X-ray (0.3–10 keV) spectra were available. This was done by combining the 70-month averaged Swift/BAT spectra with shorter pointed observations carried out by Swift/XRT, XMM-Newton/EPIC, Chandra/ACIS, Suzaku/XIS and ASCA GIS/SIS. The spectral analysis was carried out over the entire 0.3–150 keV range, using a total of 26 different spectral models, which include various emission components. The broad-band X-ray coverage allowed to recover several important properties of these AGN, such as their intrinsic X-ray luminosity, column densities, photon indices and cutoff energies. For further details on the spectral analysis we refer the reader to Ricci et al. (2017a). We focus here only on the 317 unobscured [i.e., ] AGN for which could be constrained222For the remaining unobscured AGN the cutoff energy could not be constrained by the fit. (228 lower limits and 89 values), to avoid possible degeneracies due to the additional spectral curvature introduced by heavy obscuration above 10 keV.


2.2 Optical data, black hole masses and Eddington ratio
The analysis of the optical spectra of 642 Swift/BAT accreting SMBHs is reported in Koss et al. (2017), and allowed us to obtain black hole masses for 429 non-blazar AGN. Of these, 232 are unobscured, while 197 are obscured. The black hole masses were obtained through several fundamentally different approaches: i) “direct” methods (i.e., maser emission, spatially resolved gas- or stellar-kinematics, reverberation mapping); ii) single-epoch spectra of broad H and H emission lines (e.g., Trakhtenbrot & Netzer 2012; Greene & Ho 2005, respectively); iii) stellar velocity dispersions () and the relation (Kormendy & Ho 2013). Of the 232 unobscured AGN with black hole mass estimates, our broad-band X-ray spectral analysis could constrain cutoff energies for a total of 211 sources, of which 144 are lower limits and 67 are values. For these objects was obtained using broad H (144), reverberation mapping (31), broad H (18), velocity dispersion (16), stellar (1) and gas (1) kinematics. These 211 AGN are a representative subset of sources of the BAT sample of unobscured AGN, having a very similar luminosity distribution. In the following we will use this as our final sample.
The Eddington luminosity was calculated using the following relation:
| (1) |
where is the gravitational constant, is the mass of the proton, is the speed of light, and is the Thomson cross-section. The bolometric luminosity () of the AGN in our sample was calculated from the intrinsic 2–10 keV luminosity, using a 2–10 keV bolometric correction of (Vasudevan & Fabian 2009; ). In 3 we discuss the effects of considering a dependence of on and/or (e.g., Vasudevan & Fabian 2009). The typical uncertainty on is conservatively estimated to be dex (see Koss et al. 2017).
3 The relation between the cutoff energy and the physical properties of the accreting SMBH
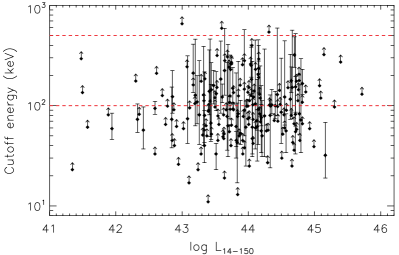
Using the BASS database we explored the relation between the cutoff energy and the properties of the accreting SMBH, such as its luminosity, black hole mass and Eddington ratio. In the left panel of Fig. 2 we show the cutoff energy versus the 14-150 keV intrinsic (absorption and K-corrected) luminosity (). Since the sample contains a large number of lower limits, we used the Kaplan-Meier estimator within the asurv package (Feigelson & Nelson 1985; Isobe et al. 1986), using a python implementation (see §5 of Shimizu et al. 2016 for details) to calculate the median values of in several luminosity bins. As shown in the right panel of Fig. 2, the sample does not show significant changes of the cutoff energy with the AGN luminosity. We performed a linear fit on the binned data, which include the censored values, using a relation of the form . The p-value of the correlation is , suggesting that no significant trend exists between the cutoff energy and the intrinsic 14–150 keV AGN luminosity.
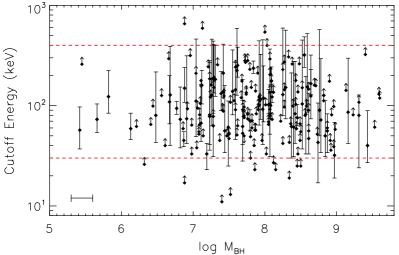
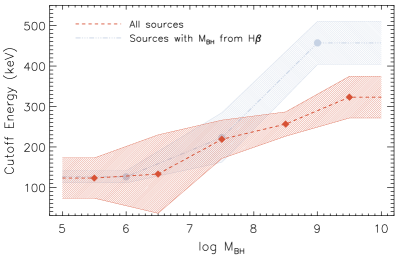
In the left panel of Fig. 3 we plot the cutoff energy versus for the 211 unobscured AGN for which this parameter is available. The rebinned plot (right panel of Fig. 3), shows a positive trend. The median appears to increase with , from keV for to keV for . Fitting the data with , we found a significant correlation, with a p-value of and a slope of . A similar trend is observed when considering only the objects for which the black hole mass was estimated using broad H (blue line in Fig. 3).
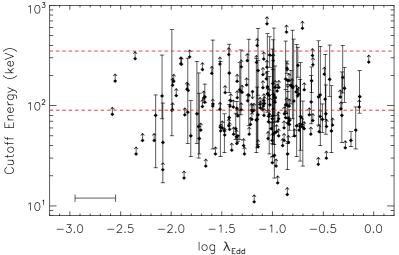
The left panel of Fig. 4 shows the scatter plot of versus Eddington ratio. The rebinned plot (right panel of Fig. 4) shows a negative trend, with a clear difference in the typical for objects accreting at high and low Eddington ratio: the median cutoff energy of the AGN accreting at is keV, while the sources at have a median of keV, which implies a difference between the two subsets of sources. Such a difference is confirmed also considering only the closest AGN (): for we find keV, while for the median cutoff energy is keV (i.e., the difference between the subsamples is ). Ignoring the lower limit on results in a rather flat trend, and no significant difference in is found between objects accreting at low and high . Fitting the rebinned data with , we obtained a p-value of , and a slope of .
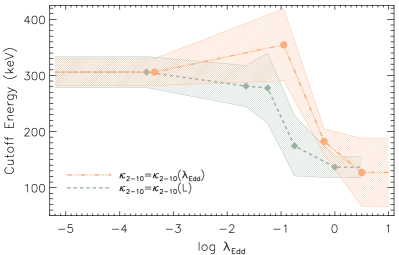
In Fig. 5 we illustrate the effect of adopting -dependent (Vasudevan & Fabian 2007, orange dot-dot-dashed line) and luminosity-dependent (Lusso et al. 2012, green dashed line) 2–10 keV bolometric corrections to the relation between and . In both cases we find the same trend observed adopting a constant : objects accreting at higher Eddington ratios tend to have lower cutoff energies. In particular we find that, using the corrections of Vasudevan & Fabian (2007), the median cutoff energy drops from keV for to keV for , implying a difference significant at the level. Considering the corrections of Lusso et al. (2012) the difference is of ( keV for and keV for ).
.
To further test the relation between , and , we used a different approach to calculate the median values of the cutoff energy for different values of black hole mass and Eddington ratio. This was done performing 1,000 Monte Carlo simulations for each object of our sample, substituting the cutoff energies we could constrain with values that were randomly selected from a Gaussian distribution centered on , and with a standard deviation given by the uncertainty. Lower limits () were substituted with values randomly selected from a uniform distribution in the interval [, ], where keV is the maximum cutoff energy. For each Monte Carlo run we calculated the median in two different bins of and , and finally we calculated the means of all simulations. For we obtain keV, while for we found keV. This implies a difference between the two subsamples. For we find keV, while for the median cutoff energy is keV. This implies a difference significant at the level. It should be remarked that the median values obtained using this approach are typically larger than those we found using the survival analysis. This is due to the fact that we are assuming a flat distribution for the lower limits, which likely does not represent the real physical distribution of plasma temperatures, and largely increases the number of objects with keV.
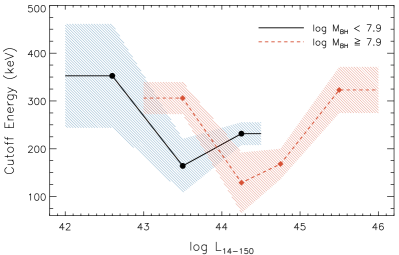
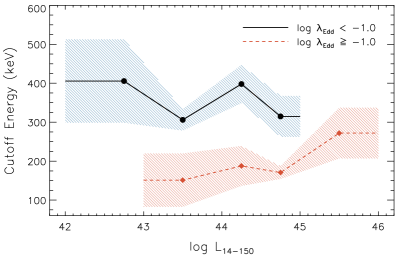
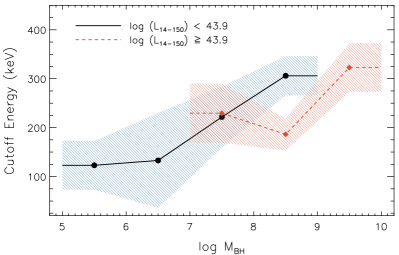
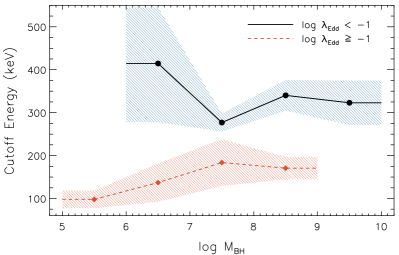
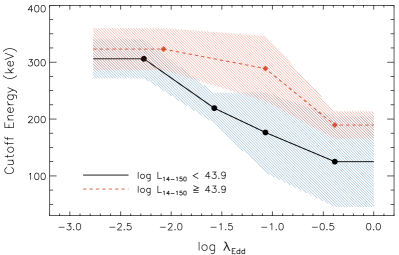
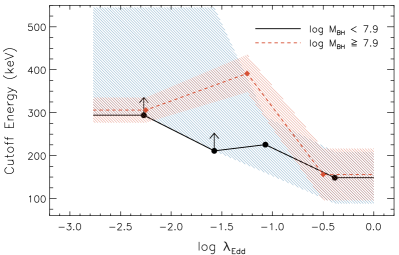
To investigate whether the Eddington ratio or the black hole mass is the main physical parameter responsible for differences in the cutoff energy, in Figs. 6–8 we plot the median values of as a function of luminosity, black hole mass and Eddington ratio. In each of the six panels we illustrate the dependence on one of these parameters for two subsets of sources covering different intervals of the other parameters. No clear dependence of on the X-ray luminosity is found dividing the sample into bins of and (left and right panels of Fig. 6, respectively), although a difference can be observed between the low and high Eddington ratio subsamples. Interestingly, while a possible trend between and is observed dividing the sample in two luminosity intervals (left panel of Fig. 7), such a relation disappears when splitting the sources into bins of Eddington ratio (right panel of Fig. 7). A similar trend is observed considering only objects for which was obtained from H. This, together with the fact that the subsample with has a lower median than that with across the interval of black hole masses spanned by the data suggests that the correlation between and is the main relation. This is confirmed by the fact that, regardless of the luminosity (left panel of Fig. 8) and black hole mass (right panel of Fig. 8), sources with high tend to have lower cutoff energies than those with low mass-normalised accretion rates.
4 AGN in the temperature–compactness parameter space
Two important parameters of AGN coronae are their compactness (Cavaliere & Morrison 1980; Guilbert et al. 1983) and normalised temperature. The compactness parameter () is defined as
| (2) |
where is the X-ray luminosity of the source, is the radius of the X-ray source, is the X-ray bolometric correction, is the mass of the electron, is the mass of the proton, and is the Thomson cross-section. The compactness was calculated using the 0.1–200 keV luminosity, which was obtained from the intrinsic 14–150 keV luminosity, assuming (Mushotzky 1982; Winter et al. 2009; Ricci et al. 2017a), while the 0.1–200 keV bolometric correction was set to , which corresponds to our assumption of (Vasudevan & Fabian 2009) and the same . The normalised temperature parameter () is:
| (3) |
In the above equation we considered that , which is an approximation valid for optically-thin plasma333As discussed in Petrucci et al. (2001), for then . for a corona with slab geometry (Petrucci et al. 2000, 2001), obtained using the Comptonization model of Haardt et al. (1994). Considering this relation, the median temperature of the X-ray emitting plasma for the objects of our sample is keV.
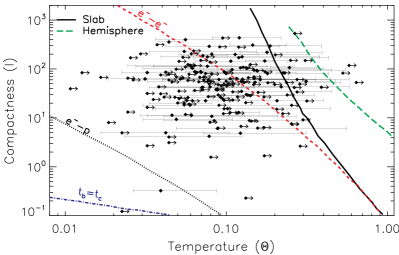
In the left panel of Fig. 9 we show the temperature–compactness diagram for the Swift/BAT AGN in our sample for which black hole masses are available, assuming . Several regions can be defined in this diagram, depending on the process dominating the electron cooling (see Fabian et al. 2015 and references therein for a detailed discussion). The region where bremsstrahlung dominates the cooling of electrons is defined by (blue dot-dashed curve), where is the fine-structure constant. Electron-proton and electron-electron collisions occur faster than the electron cooling for compactness and temperatures lower than the values delimited by the black dotted curve and the red dashed curve, respectively (Ghisellini et al. 1993; Fabian 1994).
Pair production, due to photon-photon collisions, can be a fundamental process in coronae (Svensson 1982a, b; Guilbert et al. 1983). This process could lead to runaway pair production, acting as a thermostat for the corona (Bisnovatyi-Kogan et al. 1971; Svensson 1984; Zdziarski 1985; Fabian et al. 2015, 2017). The region where there is runaway pair production is delimited by the pair line, which is illustrated as a green dashed curve (following Svensson 1984) and as a black continuous curve (following Stern et al. 1995) in Fig. 9 for an isolated cloud and for a slab corona, respectively. If an X-ray source moves into this region of the parameter space (by an increase in its temperature or compactness), then it starts to rapidly form pairs, which increases the number of particles sharing the available power, causing the energy per particle (i.e., the temperature) to drop. Sources are therefore expected to typically lie at the edge of the pair region.
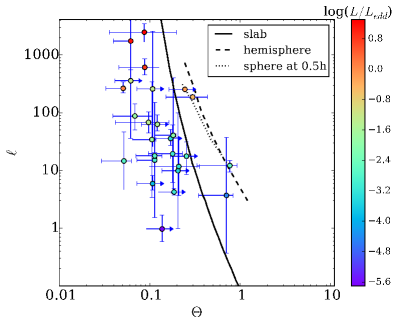
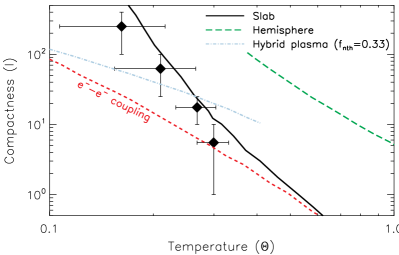
The right panel of Fig. 9 shows the median values of in different bins of . The medians were calculated using the Kaplan-Meier estimator, including the lower limits, as discussed in §3. We also show the pair line for a hybrid plasma with 33% of the electrons being non-thermal (Fabian et al. 2017). The plot illustrates that, in general, AGN are concentrated close to the pair line corresponding to a slab, avoiding the runaway pair production region, in agreement with theoretical predictions. Since plasmas are expected to concentrate right on the edge of the relevant pair-production regions in the compactness-temperature parameter space (see above), this suggests that the shape of the X-ray corona might be better approximated as a slab rather than sphere. This would also easily explain the observed dependence of the cutoff energy on the Eddington ratio. For a fixed value of (in ), is in fact directly proportional to the Eddington ratio (, see Eq. 2), and since decreases with , one would expect that AGN accreting at high would also tend to have X-ray emitting plasma with lower temperatures. This is also consistent with what is found for the AGN from Fabian et al. (2015) (Fig. 10): objects at low temperature and high compactness tend to have higher (e.g., Ark 564, see Kara et al. 2017) than those at high temperature and low compactness.
5 The plasma optical depth and its relation with the accretion properties of AGN
In this section we explore the relation between the optical depth of the Comptonizing plasma and the properties of the accreting SMBH. While is not a parameter directly obtained by our broad-band X-ray spectral analysis, it can be constrained indirectly using the dependence of on and . The photon index decreases for increasing values of the Compton parameter (; e.g., Rybicki & Lightman 1979), which is defined as:
| (4) |


To calculate the relation between the 2–10 keV photon index , and we simulated 10,000 spectra using the compps model (Poutanen & Svensson 1996) in XSPEC (Arnaud 1996), which produces X-ray spectra from Comptonization in a plasma with variable geometry, temperature and optical depth. We assumed a slab geometry, and created a uniform grid in the ranges and . We set the inclination angle to , and only considered the primary X-ray emission, setting the reflection parameter to . The seed photons were produced using a multi-color disk with an inner disk temperature of eV. The photon index was inferred, for each value of and , by fitting the simulated spectra with a power-law with a simple powerlaw model (pow) in the 2–10 keV range, leaving both the normalization and photon index free to vary. We then fit the data with:
| (5) |
From the fit we find , , and ; the median of the absolute difference between the photon index and the value found with Eq. 5 is , showing that the fit can reproduce well the data.
We can then invert Eq. 5 to obtain the optical depth as a function of and :
| (6) |
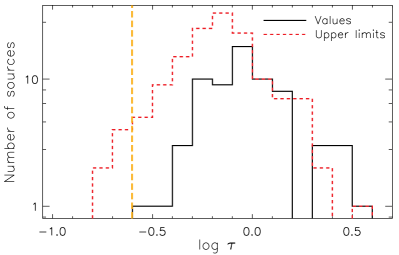
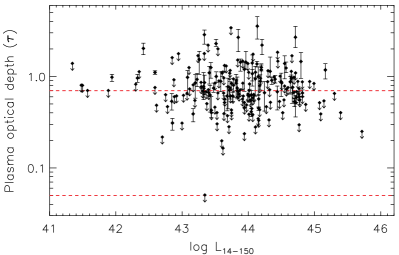
From our spectral analysis we have both and (see §4), so that we can calculate for the 211 AGN in our sample. The sources for which only a lower limit on is available have upper limits on . To be consistent with the simulations we used the photon index obtained by fitting the keV spectrum (see Ricci et al. 2017a for details). The distribution of the plasma optical depth for our sample is shown in Fig. 11. Using asurv, following the same approach outlined in § 3 we find that, for the whole sample, the median optical depth is .
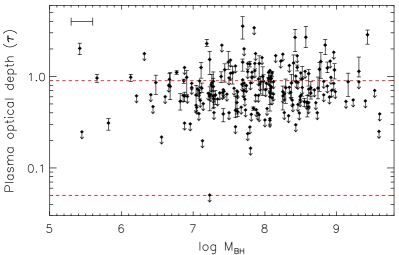
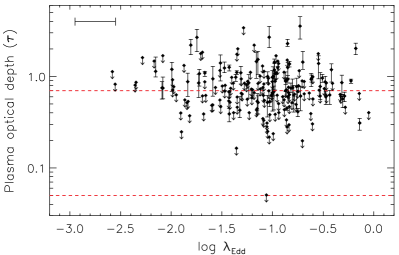
We investigated the relation between , the X-ray luminosity (Fig. 12), the black hole mass (Fig. 13) and the Eddington ratio (Fig. 14), and found no statistically significant correlations between these quantities. However, we find a difference in the optical depth of objects accreting at low () and at high () Eddington ratios, with the median values being and , respectively. If the optical depth of the corona increases with the density of the accretion disk (), then the increase of with would be consistent with the classical accretion disk model (Shakura & Sunyaev 1973), according to which . In a recent work, Tortosa et al. (2018b) found an anti-correlation between the temperature and the optical depth of the X-ray emitting plasma. Considering this, and the decrease of the temperature of the Comptonizing plasma with the Eddington ratio, one would naturally expect that at higher AGN tend to preferentially have coronae with larger optical depths.
6 The temperature-compactness plane and the correlation
6.1 The relation
A relation between the photon index and the Eddington ratio has been reported by several authors over the past two decades (e.g., Brandt et al. 1997; Shemmer et al. 2006, 2008; Risaliti et al. 2009; Fanali et al. 2013; Brightman et al. 2013, 2016; Kawamuro et al. 2016), which have shown that, for increasing , the X-ray continuum tend to be steeper. Most of these works have found that the correlation
| (7) |
has a slope (e.g., Shemmer et al. 2008; Brightman et al. 2013), while a steeper slope () was reported by Risaliti et al. (2009), who studied SDSS quasars with archival XMM-Newton observations. More recently, Trakhtenbrot et al. (2017), using BASS, found instead a significantly weaker and flatter () correlation when using obtained by considering complex spectral models (see Ricci et al. 2017a for details). Interestingly, when using obtained by fitting the spectra of unobscured AGN with a simple power law model in the 2–10 keV range, Trakhtenbrot et al. (2017) found a slope similar () to that reported by previous studies. The existence of a relation between and has been confirmed by repeated observations of individual sources, which have shown that the photon index increases with the flux (e.g., Perola et al. 1986; Matsuoka et al. 1990; Lamer et al. 2003; Sobolewska & Papadakis 2009). Interestingly, Sobolewska & Papadakis (2009) found that differs from object to object, varying from to , and that the slope for the average spectral slope versus the average Eddington ratio is . This slope is consistent with that found for BASS by Trakhtenbrot et al. (2017), and with the value reported by Ricci et al. (2013; ) for a sample of 36 nearby AGN, considering the average and . The difference between the slopes found by the works reported above is likely related to the approach used for the spectral fitting (i.e., a simple power-law model or more complex models), to the energy band, and to the sample used.
6.2 Explaining the relation with the pair line
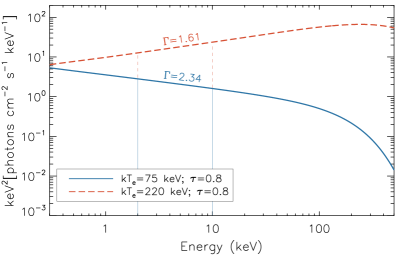
The physical mechanism responsible for this correlation is still debated. It has been proposed that this might be related to a more efficient cooling of the X-ray emitting plasma at higher , due to the larger amount of optical and UV seed photons produced by the accretion disk (e.g., Vasudevan & Fabian 2007; Davis & Laor 2011). However, as argued by Trakhtenbrot et al. (2017), the number of optical and UV photons also increases when the black hole mass decreases (e.g., Done et al. 2012; Slone & Netzer 2012), so that one would also expect a relation between and , which is not observed. In the previous sections we have shown that the temperature of the Comptonizing plasma tends to decrease for increasing (§3), and that this effect could be related to the fact that coronae tend to concentrate around the runaway pair creation line (§4). This could provide an alternative mechanism for the relation, since the photon index depends on the temperature of the plasma (see Fig. 15 and Eq.6).
To test whether the limits imposed by pair production on the plasma temperature for a given compactness parameter could explain the observed relation between and , we first interpolated the limit of the runaway pair production region in the diagram (considering a slab corona, see Stern et al. 1995) using a polynomial of the second order:
| (8) |
From the fit we obtained a=, b= and c=. We then assumed that typically coronae are distributed along this line, as shown in the right panel of Fig. 9. We simulated 10,000 spectra using compps, similarly to what was done in §5. We set the plasma temperature to depend on the Eddington ratio by combining Eqs. 2 and 3 with Eq. 8, i.e. transforming the relation into a function:
| (9) |
where and , assuming and . We explored a range in Eddington ratio between and 1, which translates into a plasma temperature interval of keV. We explored a range of Comptonizing plasma optical depths (), from 0.1 to 1.5, and two different geometries of the corona (sphere and slab). In Figure 15 we show, as an example, two spectra obtained with compps, assuming the parameters reported above, an optical depth of and plasma temperatures of keV (red dashed line) and keV (blue continuous line), which encompass the range of temperature explored in our simulations. The figure clearly shows that cooler plasma tend to create significantly steeper X-ray spectra in the 2–10 keV range.
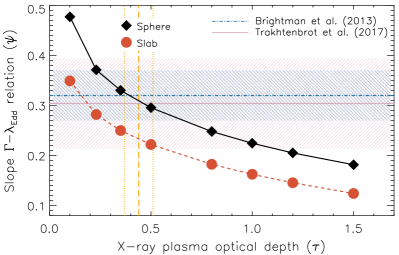
The simulated spectra were then fit with a powerlaw model in the 2–10 keV range. We studied the relation between and , fitting the data with an expression that follows Eq. 7. As shown in Fig. 16, the fact that coronae follow the pair line could easily reproduce the observed slope of the correlation. In the figure we use the value of from Trakhtenbrot et al. (2017) inferred using the photon index obtained by applying a simple power-law model to the 2–10 keV spectrum, consistently with what was done for our simulations. The optical depth extrapolated from our sample in §5 would correspond to slopes in the range , in agreement with the observations (orange vertical lines in Fig. 16). The steeper slopes of the correlation obtained for optically thinner plasma are likely due to the stronger influence of changes in temperatures on the X-ray spectrum. The large scatter observed in the correlation (e.g., Ho & Kim 2016; Trakhtenbrot et al. 2017) could be ascribed to several causes, such as the intrinsic scatter in the diagram, different optical depths of the Comptonizing region, and/or different sizes and geometries of the corona. Moreover, pair production in non-thermal plasma could create a large range of plasma temperatures (Fabian et al. 2017), which would also contribute to the scatter.
7 Summary and conclusion
We have studied here the relation between the coronal and accretion properties of 211 local unobscured AGN from the BAT AGN Spectroscopic Survey. The main findings of our work are the following.
-
•
The median temperature of the X-ray emitting plasma for the objects in our sample is keV.
-
•
The main parameter driving the cutoff energy is the Eddington ratio (see 3, Fig. 4 and Fig. 8). This is shown by the negative correlation between and (Fig. 4), and by the fact that any trend with luminosity or black hole mass disappears when dividing the samples into bins of , while the difference between low and high Eddington ratio sources is always observed, regardless of the interval of luminosity (right panel of Fig. 6) or black hole mass (right panel of Fig. 7).
-
•
At low Eddington ratios () the median cutoff energy is keV, while at high Eddington ratios () is keV, which implies a difference between the two subsamples.
-
•
We studied the distribution of the AGN in our sample in the temperature-compactness () parameter space (4), and found that AGN typically tend to avoid the pair runaway region, and to lie between the coupling line and the pair line for a slab corona (Eq. 8), implying that the geometry of the corona may be better described as a slab (instead of a sphere).
-
•
The relation between and can be explained by the fact that AGN tend to avoid the pair runaway region in the diagram, considering that, for a fixed size of the X-ray emitting region, the compactness is proportional to the Eddington ratio (, see Eq. 2).
-
•
Using spectral simulations, considering a slab corona, we show that the optical depth of the Comptonizing plasma can be calculated from and using Eq. 6 (see §5). The median value of the optical depth for our sample is , and objects accreting at have a lower median optical depth () than those with ().
-
•
Simulating AGN populations with an X-ray spectral Comptonization model, we showed that Comptonizing plasma with temperatures and compactness lying along the pair line can straightforwardly reproduce the observed slope of the relation (see §6).
BASS aims to reliably estimate, in the near future, black hole masses for about 1,000 local AGN. Therefore future studies of a larger number of hard X-ray selected AGN carried out with Swift/BAT and NuSTAR (in the framework of the BAT legacy survey), will be able to better characterise the relation between the cutoff energy and the Eddington ratio, and to understand the importance of non-thermal components in the X-ray emitting plasma.
Acknowledgements
We thank the reviewer for the useful comments, which helped us improve the quality of the manuscript. This work made use of data from the NASA/IPAC Infrared Science Archive and NASA/IPAC Extragalactic Database (NED), which are operated by the Jet Propulsion Laboratory, California Institute of Technology, under contract with the National Aeronautics and Space Administration. We acknowledge financial support from the National Key R&D Program of China grant No. 2016YFA0400702 (LH), the National Science Foundation of China grants No. 11473002 and 1721303 (LH), FONDECYT 1141218 (CR, FEB), FONDECYT 1160999 (ET), CONICYT PIA ACT172033 (ET), Basal-CATA PFB–06/2007 (CR, FEB, ET), the China-CONICYT fund (CR), the CONICYT+PAI Convocatoria Nacional subvencion a instalacion en la academia convocatoria año 2017 PAI77170080 (CR), the Swiss National Science Foundation (Grant PP00P2_138979 and PP00P2_166159, KS), the Swiss National Science Foundation (SNSF) through the Ambizione fellowship grant PZ00P2_154799/1 (MK), the NASA ADAP award NNH16CT03C (MK), the ERC Advanced Grant Feedback 340442 (ACF), and the Ministry of Economy, Development, and Tourism’s Millennium Science Initiative through grant IC120009, awarded to The Millennium Institute of Astrophysics, MAS (FEB). This work was partly supported by the Grant-in-Aid for Scientific Research 17K05384 (YU) from the Ministry of Education, Culture, Sports, Science and Technology of Japan (MEXT).
References
- Arnaud (1996) Arnaud K. A., 1996, in Astronomical Data Analysis Software and Systems V, edited by G. H. Jacoby & J. Barnes, vol. 101 of Astronomical Society of the Pacific Conference Series, 17
- Ballantyne (2014) Ballantyne D. R., 2014, MNRAS, 437, 2845
- Ballantyne et al. (2014) Ballantyne D. R., Bollenbacher J. M., Brenneman L. W., et al., 2014, ApJ, 794, 62
- Baloković et al. (2015) Baloković M., Matt G., Harrison F. A., et al., 2015, ApJ, 800, 62
- Barthelmy et al. (2005) Barthelmy S. D., Barbier L. M., Cummings J. R., et al., 2005, Space Sci. Rev., 120, 143
- Baumgartner et al. (2013) Baumgartner W. H., Tueller J., Markwardt C. B., et al., 2013, ApJS, 207, 19
- Beckmann et al. (2009) Beckmann V., Soldi S., Ricci C., et al., 2009, A&A, 505, 417
- Berney et al. (2015) Berney S., Koss M., Trakhtenbrot B., et al., 2015, MNRAS, 454, 3622
- Bisnovatyi-Kogan et al. (1971) Bisnovatyi-Kogan G. S., Zel’dovich Y. B., Syunyaev R. A., 1971, Soviet Ast., 15, 17
- Brandt et al. (1997) Brandt W. N., Mathur S., Elvis M., 1997, MNRAS, 285, L25
- Brenneman et al. (2014) Brenneman L. W., Madejski G., Fuerst F., et al., 2014, ApJ, 788, 61
- Brightman et al. (2016) Brightman M., Masini A., Ballantyne D. R., et al., 2016, ApJ, 826, 93
- Brightman et al. (2013) Brightman M., Silverman J. D., Mainieri V., et al., 2013, MNRAS, 433, 2485
- Cavaliere & Morrison (1980) Cavaliere A., Morrison P., 1980, ApJ, 238, L63
- Chartas et al. (2009) Chartas G., Kochanek C. S., Dai X., Poindexter S., Garmire G., 2009, ApJ, 693, 174
- Dadina (2007) Dadina M., 2007, A&A, 461, 1209
- Davis & Laor (2011) Davis S. W., Laor A., 2011, ApJ, 728, 98
- De Marco et al. (2013) De Marco B., Ponti G., Cappi M., et al., 2013, MNRAS, 431, 2441
- de Rosa et al. (2012) de Rosa A., Panessa F., Bassani L., et al., 2012, MNRAS, 420, 2087
- Done et al. (2012) Done C., Davis S. W., Jin C., Blaes O., Ward M., 2012, MNRAS, 420, 1848
- Fabian (1994) Fabian A. C., 1994, ApJS, 92, 555
- Fabian (2012) Fabian A. C., 2012, ARA&A, 50, 455
- Fabian et al. (2017) Fabian A. C., Lohfink A., Belmont R., Malzac J., Coppi P., 2017, MNRAS, 467, 2566
- Fabian et al. (2015) Fabian A. C., Lohfink A., Kara E., Parker M. L., Vasudevan R., Reynolds C. S., 2015, MNRAS, 451, 4375
- Fabian et al. (2009) Fabian A. C., Zoghbi A., Ross R. R., et al., 2009, Nature, 459, 540
- Fanali et al. (2013) Fanali R., Caccianiga A., Severgnini P., et al., 2013, MNRAS, 433, 648
- Feigelson & Nelson (1985) Feigelson E. D., Nelson P. I., 1985, ApJ, 293, 192
- Ferrarese & Merritt (2000) Ferrarese L., Merritt D., 2000, ApJ, 539, L9
- Gebhardt et al. (2000) Gebhardt K., Bender R., Bower G., et al., 2000, ApJ, 539, L13
- Gehrels et al. (2004) Gehrels N., Chincarini G., Giommi P., et al., 2004, ApJ, 611, 1005
- Ghisellini et al. (1993) Ghisellini G., Haardt F., Fabian A. C., 1993, MNRAS, 263, L9
- Gilli et al. (2007) Gilli R., Comastri A., Hasinger G., 2007, A&A, 463, 79
- Greene & Ho (2005) Greene J. E., Ho L. C., 2005, ApJ, 630, 122
- Guilbert et al. (1983) Guilbert P. W., Fabian A. C., Rees M. J., 1983, MNRAS, 205, 593
- Haardt & Maraschi (1991) Haardt F., Maraschi L., 1991, ApJ, 380, L51
- Haardt & Maraschi (1993) Haardt F., Maraschi L., 1993, ApJ, 413, 507
- Haardt et al. (1994) Haardt F., Maraschi L., Ghisellini G., 1994, ApJ, 432, L95
- Harrison et al. (2013) Harrison F. A., Craig W. W., Christensen F. E., et al., 2013, ApJ, 770, 103
- Ho & Kim (2016) Ho L. C., Kim M., 2016, ApJ, 821, 48
- Isobe et al. (1986) Isobe T., Feigelson E. D., Nelson P. I., 1986, ApJ, 306, 490
- Johnson et al. (1997) Johnson W. N., McNaron-Brown K., Kurfess J. D., Zdziarski A. A., Magdziarz P., Gehrels N., 1997, ApJ, 482, 173
- Kara et al. (2013) Kara E., Fabian A. C., Cackett E. M., Uttley P., Wilkins D. R., Zoghbi A., 2013, MNRAS, 434, 1129
- Kara et al. (2017) Kara E., García J. A., Lohfink A., et al., 2017, MNRAS, 468, 3489
- Kawamuro et al. (2016) Kawamuro T., Ueda Y., Tazaki F., Ricci C., Terashima Y., 2016, ApJS, 225, 14
- King & Pounds (2015) King A., Pounds K., 2015, ARA&A, 53, 115
- Kormendy & Ho (2013) Kormendy J., Ho L. C., 2013, ARA&A, 51, 511
- Koss et al. (2017) Koss M., Trakhtenbrot B., Ricci C., et al., 2017, ApJ, 850, 74
- Lamer et al. (2003) Lamer G., McHardy I. M., Uttley P., Jahoda K., 2003, MNRAS, 338, 323
- Lamperti et al. (2017) Lamperti I., Koss M., Trakhtenbrot B., et al., 2017, MNRAS
- Lanzuisi et al. (2016) Lanzuisi G., Perna M., Comastri A., et al., 2016, A&A, 590, A77
- Liu et al. (2015) Liu B. F., Taam R. E., Qiao E., Yuan W., 2015, ApJ, 806, 223
- Liu et al. (2017) Liu B. F., Taam R. E., Qiao E., Yuan W., 2017, ApJ, 847, 96
- Lohfink et al. (2017) Lohfink A. M., Fabian A. C., Ballantyne D. R., et al., 2017, ApJ, 841, 80
- Lohfink et al. (2015) Lohfink A. M., Ogle P., Tombesi F., et al., 2015, ApJ, 814, 24
- Lubiński et al. (2016) Lubiński P., Beckmann V., Gibaud L., et al., 2016, MNRAS, 458, 2454
- Lubiński et al. (2010) Lubiński P., Zdziarski A. A., Walter R., et al., 2010, MNRAS, 408, 1851
- Lusso et al. (2012) Lusso E., Comastri A., Simmons B. D., et al., 2012, MNRAS, 425, 623
- Malizia et al. (2014) Malizia A., Molina M., Bassani L., et al., 2014, ApJ, 782, L25
- Marinucci et al. (2014) Marinucci A., Matt G., Miniutti G., et al., 2014, ApJ, 787, 83
- Matsuoka et al. (1990) Matsuoka M., Piro L., Yamauchi M., Murakami T., 1990, ApJ, 361, 440
- Matt et al. (2015) Matt G., Baloković M., Marinucci A., et al., 2015, MNRAS, 447, 3029
- Matt et al. (2014) Matt G., Marinucci A., Guainazzi M., et al., 2014, MNRAS, 439, 3016
- McHardy et al. (2005) McHardy I. M., Gunn K. F., Uttley P., Goad M. R., 2005, MNRAS, 359, 1469
- Merloni (2003) Merloni A., 2003, MNRAS, 341, 1051
- Merloni & Fabian (2001) Merloni A., Fabian A. C., 2001, MNRAS, 321, 549
- Molina et al. (2009) Molina M., Bassani L., Malizia A., et al., 2009, MNRAS, 399, 1293
- Mushotzky (1982) Mushotzky R. F., 1982, ApJ, 256, 92
- Mushotzky et al. (1993) Mushotzky R. F., Done C., Pounds K. A., 1993, ARA&A, 31, 717
- Nicastro et al. (2000) Nicastro F., Piro L., De Rosa A., et al., 2000, ApJ, 536, 718
- Oh et al. (2017) Oh K., Schawinski K., Koss M., et al., 2017, MNRAS, 464, 1466
- Panessa et al. (2011) Panessa F., de Rosa A., Bassani L., et al., 2011, MNRAS, 417, 2426
- Parker et al. (2014) Parker M. L., Wilkins D. R., Fabian A. C., et al., 2014, MNRAS, 443, 1723
- Perola et al. (1986) Perola G. C., Piro L., Altamore A., et al., 1986, ApJ, 306, 508
- Petrucci et al. (2000) Petrucci P. O., Haardt F., Maraschi L., et al., 2000, ApJ, 540, 131
- Petrucci et al. (2001) Petrucci P. O., Haardt F., Maraschi L., et al., 2001, ApJ, 556, 716
- Poutanen & Svensson (1996) Poutanen J., Svensson R., 1996, ApJ, 470, 249
- Reis & Miller (2013) Reis R. C., Miller J. M., 2013, ApJ, 769, L7
- Ricci et al. (2013) Ricci C., Paltani S., Ueda Y., Awaki H., 2013, MNRAS, 435, 1840
- Ricci et al. (2017a) Ricci C., Trakhtenbrot B., Koss M. J., et al., 2017a, ApJS, 233, 17
- Ricci et al. (2017b) Ricci C., Trakhtenbrot B., Koss M. J., et al., 2017b, Nature, 549, 488
- Ricci et al. (2015) Ricci C., Ueda Y., Koss M. J., Trakhtenbrot B., Bauer F. E., Gandhi P., 2015, ApJ, 815, L13
- Ricci et al. (2011) Ricci C., Walter R., Courvoisier T. J.-L., Paltani S., 2011, A&A, 532, A102
- Risaliti et al. (2005) Risaliti G., Elvis M., Fabbiano G., Baldi A., Zezas A., 2005, ApJ, 623, L93
- Risaliti et al. (2011) Risaliti G., Nardini E., Salvati M., et al., 2011, MNRAS, 410, 1027
- Risaliti et al. (2009) Risaliti G., Young M., Elvis M., 2009, ApJ, 700, L6
- Rybicki & Lightman (1979) Rybicki G. B., Lightman A. P., 1979, Radiative processes in astrophysics
- Schawinski et al. (2006) Schawinski K., Khochfar S., Kaviraj S., et al., 2006, Nature, 442, 888
- Shakura & Sunyaev (1973) Shakura N. I., Sunyaev R. A., 1973, A&A, 24, 337
- Shemmer et al. (2006) Shemmer O., Brandt W. N., Netzer H., Maiolino R., Kaspi S., 2006, ApJ, 646, L29
- Shemmer et al. (2008) Shemmer O., Brandt W. N., Netzer H., Maiolino R., Kaspi S., 2008, ApJ, 682, 81
- Shimizu et al. (2018) Shimizu T. T., Davies R. I., Koss M., et al., 2018, ApJ, 856, 154
- Shimizu et al. (2016) Shimizu T. T., Meléndez M., Mushotzky R. F., Koss M. J., Barger A. J., Cowie L. L., 2016, MNRAS, 456, 3335
- Slone & Netzer (2012) Slone O., Netzer H., 2012, MNRAS, 426, 656
- Sobolewska & Papadakis (2009) Sobolewska M. A., Papadakis I. E., 2009, MNRAS, 399, 1597
- Stern et al. (1995) Stern B. E., Poutanen J., Svensson R., Sikora M., Begelman M. C., 1995, ApJ, 449, L13
- Svensson (1982a) Svensson R., 1982a, ApJ, 258, 335
- Svensson (1982b) Svensson R., 1982b, ApJ, 258, 321
- Svensson (1984) Svensson R., 1984, MNRAS, 209, 175
- Tazaki et al. (2011) Tazaki F., Ueda Y., Terashima Y., Mushotzky R. F., 2011, ApJ, 738, 70
- Tortosa et al. (2018a) Tortosa A., Bianchi S., Marinucci A., et al., 2018a, MNRAS, 473, 3104
- Tortosa et al. (2018b) Tortosa A., Bianchi S., Marinucci A., Matt G., Petrucci P. O., 2018b, ArXiv e-prints
- Tortosa et al. (2017) Tortosa A., Marinucci A., Matt G., et al., 2017, MNRAS, 466, 4193
- Trakhtenbrot & Netzer (2012) Trakhtenbrot B., Netzer H., 2012, MNRAS, 427, 3081
- Trakhtenbrot et al. (2017) Trakhtenbrot B., Ricci C., Koss M. J., et al., 2017, MNRAS, 470, 800
- Treister & Urry (2005) Treister E., Urry C. M., 2005, ApJ, 630, 115
- Treister et al. (2009) Treister E., Urry C. M., Virani S., 2009, ApJ, 696, 110
- Ueda et al. (2014) Ueda Y., Akiyama M., Hasinger G., Miyaji T., Watson M. G., 2014, ApJ, 786, 104
- Ursini et al. (2015) Ursini F., Marinucci A., Matt G., et al., 2015, MNRAS, 452, 3266
- Vasudevan et al. (2013) Vasudevan R. V., Brandt W. N., Mushotzky R. F., et al., 2013, ApJ, 763, 111
- Vasudevan & Fabian (2007) Vasudevan R. V., Fabian A. C., 2007, MNRAS, 381, 1235
- Vasudevan & Fabian (2009) Vasudevan R. V., Fabian A. C., 2009, MNRAS, 392, 1124
- Winter et al. (2009) Winter L. M., Mushotzky R. F., Reynolds C. S., Tueller J., 2009, ApJ, 690, 1322
- Xie et al. (2017) Xie F.-G., Yuan F., Ho L. C., 2017, ApJ, 844, 42
- Xu et al. (2017) Xu Y., Baloković M., Walton D. J., Harrison F. A., García J. A., Koss M. J., 2017, ApJ, 837, 21
- Zdziarski (1985) Zdziarski A. A., 1985, ApJ, 289, 514
- Zdziarski et al. (1996) Zdziarski A. A., Johnson W. N., Magdziarz P., 1996, MNRAS, 283, 193
- Zoghbi et al. (2012) Zoghbi A., Fabian A. C., Reynolds C. S., Cackett E. M., 2012, MNRAS, 422, 129