Hard X-ray selected giant radio galaxies – I. The X-ray properties and radio connection
Abstract
We present the first broad-band X-ray study of the nuclei of 14 hard X-ray selected giant radio galaxies, based both on the literature and on the analysis of archival X-ray data from NuSTAR, XMM–Newton, Swift and INTEGRAL. The X-ray properties of the sources are consistent with an accretion-related X-ray emission, likely originating from an X-ray corona coupled to a radiatively efficient accretion flow. We find a correlation between the X-ray luminosity and the radio core luminosity, consistent with that expected for AGNs powered by efficient accretion. In most sources, the luminosity of the radio lobes and the estimated jet power are relatively low compared with the nuclear X-ray emission. This indicates that either the nucleus is more powerful than in the past, consistent with a restarting of the central engine, or that the giant lobes are dimmer due to expansion losses.
keywords:
galaxies: active – galaxies: nuclei – galaxies: Seyfert – X-rays: galaxies1 Introduction
Active galactic nuclei (AGNs) are powerful sources emitting across all the electromagnetic spectrum. Their central engine is thought to be a supermassive black hole surrounded by an accretion disc, mostly emitting in the optical/UV band. The X-ray emission is thought to originate, at least in radio-quiet AGNs, via Comptonization of disc photons in a hot corona (e.g. Haardt & Maraschi 1991; Haardt et al. 1994, 1997). The primary X-ray emission can be absorbed by the circumnuclear material, and also Compton reflected by the disc (e.g. George & Fabian 1991; Matt et al. 1991) or the torus at pc scales (e.g. Ghisellini et al. 1994; Matt et al. 2003). In radio galaxies, powerful jets are also observed, producing radio through gamma radiation via synchrotron and synchrotron self-Compton mechanisms. From the seminal work of Fanaroff & Riley (1974), radio galaxies are divided into two subclasses according to their morphology and radio power: the low-power Fanaroff-Riley (FR) I and the high-power FR II. FR Is are more compact and their radio luminosity peaks near the nucleus, while FR IIs exhibit well-separated radio lobes with bright outer edges. When jets are observed, they are more collimated in FR IIs. Also the origin of the X-ray emission is likely different between the two classes, being mostly related to the jet in FR Is (e.g. Balmaverde et al. 2006; Hardcastle et al. 2009; Mingo et al. 2014) and to the accretion disc/corona system in FR IIs (e.g. Grandi et al. 2006).
Giant radio galaxies (GRGs) are the largest (linear size Mpc) single objects in the Universe, and represent an extreme class among radio-loud AGNs. Their extraordinary size, extending well beyond the host galaxy, makes them ideal targets to study the large-scale structure of the Universe and probe the warm-hot intergalactic medium Malarecki et al. (2013, 2015). Moreover, according to the evolution models of radio galaxies (e.g. Kaiser & Alexander 1999; Hardcastle & Krause 2013), GRGs should be very old and/or residing in a very low-density environment compared with regular radio galaxies (e.g. Subrahmanyan et al. 1996; Mack et al. 1998; Machalski et al. 2004; Malarecki et al. 2015). The origin and growth of GRGs is still an open issue, and could be related to the restarting of their central engines during multiple activity phases (e.g. Subrahmanyan et al. 1996). Also the environment can be an important factor, since the radio lobes tend to grow to giant sizes towards low-density regions Malarecki et al. (2015); in particular, the radio axes of GRGs are preferentially closer to the minor axes of the host galaxies Saripalli & Subrahmanyan (2009).
So far, around 300 GRGs have been reported in the literature, mostly from radio surveys (Weżgowiec et al. 2016, and references therein). Their discovery is challenging because, despite their huge total energy content, their large volume implies a very low energy density and a very low surface brightness, thus requiring sensitive radio telescopes. Another problem is the large angular size, which makes it difficult to distinguish the real radio structure from physically unrelated sources. Indeed, in the complete sample of 3CR extragalactic radio sources Laing et al. (1983), only around 6 per cent of them are found to be giant, and this fraction is only 1 per cent at redshift Ishwara-Chandra & Saikia (1999). Among the radio galaxies of the more sensitive Australia Telescope Low Brightness Survey Extended Sources Sample, around 12 per cent are candidate giants, with about 3 per cent being giants at Saripalli et al. (2012).
Recently, Bassani et al. (2016) extracted a sample of 64 AGNs with extended radio morphology from the hard X-ray catalogues of INTEGRAL/IBIS Malizia et al. (2012) and Swift/BAT Baumgartner et al. (2013). Surprisingly, the fraction of GRGs was found to be 22 per cent, i.e. significantly larger than what is generally found in radio surveys. Also, 60 per cent of objects were found to have linear sizes above 0.4 Mpc. It is still unclear why the hard X-ray selection favours the detection of giant radio sources. This could be partly due to observational biases that prevent the detection of GRGs in radio surveys. However, hard X-ray selected AGNs are also biased towards luminous and highly accreting sources; this could in turn suggest that hard X-ray selected radio galaxies are those with a central engine powerful enough to produce giant radio structures (for a detailed discussion, see Bassani et al. 2016).
In this paper, we discuss for the first time the broad-band X-ray properties of a sample of hard X-ray selected GRGs, and more specifically of the 14 GRGs selected in Bassani et al. (2016), and investigate their connection with the radio emission. To this aim, we gathered information either from the literature or by direct analysis of archival X-ray data, focusing in particular on NuSTAR. A study of the radio morphology and evolution of these sources will be presented in a forthcoming work (Bruni et al., in preparation). The structure of the paper is as follows. In Section 2 we present the sample of hard X-ray selected GRGs. In Section 3 we present the X-ray observations analysed in this work. We discuss the results in Section 4, and summarize the conclusions in Section 5.
2 The sample
We collected X-ray data for all the 14 radio galaxies reported as giants in Bassani et al. (2016), namely showing a linear extent above 0.7 Mpc (for km s-1 Mpc-1, , ). All these sources display a FR II radio morphology. The sample includes local AGNs () of different optical classes, type 1 and 2 objects being equally represented (see Tables 1 and 2). We also collected the available information on the radio fluxes from the literature, mostly relying on high-resolution (5–45 arcsec) 1.4 GHz data that allowed disentangling the different contributions from the core and the lobes. Concerning the X-ray data, we focused on broad-band spectra including INTEGRAL/IBIS and/or Swift/BAT at high energies (14–195 keV), and XMM–Newton, Chandra or Suzaku at lower energies (0.3–10 keV). For 3 sources out of 14, only Swift/XRT data are available, and have been analysed in Panessa et al. (2016). As of April 2018, 7 sources have been observed by NuSTAR in targeted observations, whose data either are published or will be discussed in the following. The basic data of the 5 sources analysed in the present work, together with their radio observations, are reported in Table 1. The data of the 9 sources with X-ray information taken from the literature are reported in Table 2. The black hole masses were collected by Panessa et al. (2016), to whom we refer the reader for the details; the mass of PKS 2331-240 was estimated from the stellar velocity dispersion by Hernández-García et al. (2017).
| Name | Optical | Galactic | X-ray | Radio | Ref. | ||
|---|---|---|---|---|---|---|---|
| class | ( cm-2) | data | data | ||||
| 0318+684 | 0.090100 | Sy1.9 | 30.8 | - | XMM+NuSTAR+BAT+IBIS | VLA | Lara et al. (2001) |
| PKS 0707-35 | 0.110800 | Sy2 | 17.0 | - | NuSTAR+BAT | ATCA | Saripalli et al. (2013) |
| Mrk 1498 | 0.054700 | Sy1.9 | 1.8 | 8.59 | XMM+NuSTAR+BAT | VLA | Schoenmakers et al. (2000a) |
| PKS 2331-240 | 0.047700 | Sy1.8 | 1.6 | 8.75 | XMM+NuSTAR+BAT | VLA | Hernández-García et al. (2017) |
| PKS 2356-61 | 0.096306 | Sy2 | 1.5 | 8.96 | NuSTAR+BAT | ATCA | Subrahmanyan et al. (1996) |
| Name | Optical | X-ray | Ref. | Radio | Ref. | ||
|---|---|---|---|---|---|---|---|
| class | data | data | |||||
| B3 0309+411b | 0.134000 | Sy1 | - | XMM+BAT+IBIS | Molina et al. (2008) | VLA | Schoenmakers et al. (2000a) |
| 4C 73.08 | 0.058100 | Sy2 | - | XMM+NuSTAR | Ursini et al. (2018a) | VLA | Lara et al. (2001) |
| HE 1434-1600 | 0.144537 | BLQSO | 8.64 | Swift/XRT+BAT | Panessa et al. (2016) | VLA | Letawe et al. (2004) |
| IGR J14488-4008 | 0.123 | Sy1.5 | 8.58 | XMM+BAT+IBIS | Molina et al. (2015) | GMRT | Molina et al. (2015) |
| 4C 63.22 | 0.20400 | Sy1 | - | Swift/XRT+BAT | Panessa et al. (2016) | VLA | Lara et al. (2001) |
| 4C 34.47 | 0.20600 | Sy1 | 8.01 | XMM+BAT | Ricci et al. (2017) | WSRT | Jagers et al. (1982) |
| IGR J17488-2338 | 0.240 | Sy1.2 | 9.11 | XMM+IBIS | Molina et al. (2014) | VLA | Molina et al. (2014) |
| PKS 2014-55 | 0.060629 | Sy2 | - | Swift/XRT+BAT | Panessa et al. (2016) | ATCA | Saripalli et al. (2007) |
| 4C 74.26 | 0.10400 | Sy1 | 9.37 | XMM+BAT+IBIS | Molina et al. (2008) | VLA | Lara et al. (2001) |
| NuSTAR+XRT | Lohfink et al. (2017) |
3 NuSTAR observations, data reduction and analysis
NuSTAR Harrison et al. (2013) observed 0318+684, PKS 0707-35, Mrk 1498, PKS 2331-240 and PKS 2356-61 as part of the NuSTAR extragalactic survey.
3.1 The sources
| Source | Obs. Id. | Start time (UTC) | Net exp. |
|---|---|---|---|
| yyyy-mm-dd | (ks) | ||
| 0318+684 | 60061342002 | 2016-05-04 | 24 |
| PKS 0707-35 | 60160285002 | 2016-11-24 | 19 |
| Mrk 1498 | 60160640002 | 2015-05-11 | 24 |
| PKS 2331-240 | 60160832002 | 2015-07-30 | 21 |
| PKS 2356-61 | 60061330002 | 2014-08-10 | 23 |
0318+684 is among the largest radio sources of our sample, having a linear size of 1.5 Mpc Bassani et al. (2016). It hosts an AGN optically classified as a Seyfert 1.9 Véron-Cetty & Véron (2006). This source was also observed by XMM–Newton in 2006 and studied by Winter et al. (2008), who reported an X-ray absorbing column density of around cm-2 and an X-ray photon index .
PKS 0707-35 has been classified as a type 2 source by Tazaki et al. (2013) from the X-ray obscuration ( cm-2) observed with Suzaku. Tazaki et al. (2013) also reported and found the presence of a relatively weak reflection component compared with typical Seyfert galaxies. The radio morphology is complex, as it shows two distinct lobe pairs, offset from each other at an angle of 30 deg, indicating a restarting activity scenario Saripalli et al. (2013).
Mrk 1498 is a peculiar source, optically classified as a Seyfert 1.9 Véron-Cetty & Véron (2006), showing large-scale ionization cones in the optical band that are not aligned with the radio lobes, and that might be interpreted as due to a fading or obscured AGN Keel et al. (2015, 2017). From Suzaku data, Eguchi et al. (2009) found an X-ray absorbing column density of a few cm-2 and , and suggested the obscuration is produced by a patchy torus. A multiwavelength study on this source will be presented in a forthcoming work (Hernandez-García et al., in prep.). Here we focus on the NuSTAR data, complemented by a 2007 XMM–Newton observation.
PKS 2331-240 has a peculiar optical spectrum with variable broad emission lines. This source has been optically classified as a Seyfert 2 Parisi et al. (2012) and later re-classified as a Seyfert 1.9 Hernández-García et al. (2017), changing to type 1.8 in one year Hernández-García et al. (2018). The radio morphology shows two giant lobes plus a blazar-like core in the center, suggesting the jet has changed its orientation and is now pointing in our line of sight Hernández-García et al. (2017). Concerning the X-ray spectrum, Panessa et al. (2016) reported and no intrinsic absorption from Swift/XRT+BAT data (see also Hernández-García et al. 2018). This object was also observed once by NuSTAR and twice by XMM–Newton in 2015, although never simultaneously. Hernández-García et al. (2017) reported and no intrinsic absorption from the XMM–Newton data.
Finally, PKS 2356-61 is a Seyfert 2 Véron-Cetty & Véron (2006) and a very powerful radio galaxy, with large and bright hotspots (e.g. Subrahmanyan et al. 1996; Mingo et al. 2014; Mingo et al. 2017). From Chandra data, Mingo et al. (2014) concluded that the X-ray spectrum is dominated by an accretion-related continuum, absorbed by a column density of around cm-2. From the same data, Mingo et al. (2017) detected synchrotron X-ray emission from one of the hotspots.
3.2 The X-ray data
We report in Table 3 the logs of the archival NuSTAR data sets of the sources analysed here. Since NuSTAR is sensitive in the 3–79 keV band, it allows us to constrain the different X-ray spectral components, namely the primary power law-like continuum, the Compton-reflection component producing a bump at 20-30 keV and the Fe K line at 6.4 keV. We included for all sources the Swift/BAT spectra Barthelmy et al. (2005) to extend the coverage up to 195 keV, and also INTEGRAL/IBIS data Ubertini et al. (2003) for 0318+684. We also included the soft X-ray spectra by XMM–Newton Jansen et al. (2001) for 0318+684, Mrk 1498 and PKS 2331-240, to better constrain the absorbing column density and the Fe K line.
The NuSTAR data were reduced using the standard pipeline (nupipeline) in the NuSTAR Data Analysis Software (nustardas, v1.8.0), using calibration files from NuSTAR caldb v20180312. We extracted the spectra using the standard tool nuproducts for each of the two hard X-ray detectors, which reside in the corresponding focal plane modules A and B (FPMA and FPMB). We extracted the source data from circular regions with a radius of 75 arcsec, and the background from a blank area close to the source. The spectra were binned to have a signal-to-noise ratio larger than 3 in each spectral channel, and not to oversample the instrumental resolution by a factor greater than 2.5. The spectra from the two detectors were analysed jointly, but not combined.
The XMM–Newton data were processed using the XMM–Newton Science Analysis System (sas v16.1). For simplicity, we used EPIC-pn data only, because of the much larger effective area compared with the MOS detectors and to avoid uncertainties due to cross-calibration issues. The source extraction radii and screening for high-background intervals were determined through an iterative process that maximizes the signal-to-noise ratio Piconcelli et al. (2004). We extracted the background from circular regions with a radius of 50 arcsec, while the source extraction radii were in the range 20–40 arcsec. We binned the spectra to have at least 30 counts per spectral bin, and not oversampling the instrumental resolution by a factor greater than 3.
The INTEGRAL spectrum of 0318+684 consists of ISGRI data from several pointings between revolution 12 and 530 (from the fourth IBIS catalogue; Bird et al. 2010). The data extraction was carried out following the procedure described in Molina et al. (2013).
Finally, we included the average 105-month Swift/BAT spectra from the most recent hard X-ray survey Oh et al. (2018)111https://swift.gsfc.nasa.gov/results/bs105mon/.
3.3 Spectral analysis
The spectral analysis was carried out with the xspec 12.10.0 package Arnaud (1996), using the minimisation technique. All errors are quoted at the 90 per cent confidence level. We fitted the 3–79 keV NuSTAR spectra and the 14–195 keV Swift/BAT spectra simultaneously, leaving the cross-calibration constant free to vary, after checking for consistency between the two instruments. We did the same for the 20–100 keV INTEGRAL/IBIS spectrum and included a cross-calibration constant . We also included a cross-calibration factor between NuSTAR/FPMA and FPMB, which is always consistent with unity and smaller than 1.02. The XMM–Newton/pn data allowed us to extend the analysis down to 0.3 keV for 0318+684, Mrk 1498 and PKS 2331-240. In these cases, we included a cross-calibration constant free to vary to account for flux variability between the different observations.
In our fits, we always included Galactic absorption, fixing the hydrogen column densities to the values obtained from the H i map of Kalberla et al. (2005), as given by the tool nh in the HEASoft package. The values of Galactic are reported in Table 1. For all models, we adopted the chemical abundances of Anders & Grevesse (1989) and the photoelectric absorption cross-sections of Verner et al. (1996).
We first fitted the data with a model consisting of an absorbed power law plus a reflection component and a narrow Gaussian emission line. We used the pexrav model Magdziarz & Zdziarski (1995) in xspec, which includes the continuum reflected off a neutral medium of infinite column density in a slab geometry. We always fixed the inclination angle at 60 deg, and we assumed solar abundances. We left free to vary the photon index , the reflection fraction and the high-energy cut-off in pexrav. Since the energy of the Gaussian line was always poorly constrained, we fixed it at 6.4 keV (rest-frame), i.e. that expected for neutral Fe K emission. In xspec notation, this baseline model reads: const*phabs*zphabs*(pexrav + zgauss), where const is the cross-calibration constant, phabs is the fixed Galactic absorption, zphabs is the (redshifted) intrinsic absorption. This model is designated as Model A in the following.
When including pn data down to 0.3 keV, we noted a “soft excess” on top of the absorbed power law, which is commonly observed in the X-ray spectra of type 2 AGNs (e.g. Turner et al. 1997; Guainazzi et al. 2005). In radio-quiet Seyfert 2s, this excess is generally explained as optically-thin scattered continuum (e.g. Turner et al. 1997; Ueda et al. 2007) and/or photoionized emission from circumnuclear gas (e.g. Guainazzi & Bianchi 2007). In obscured radio galaxies, on the other hand, the excess can be attributed to unabsorbed X-ray emission from the jet (e.g. Hardcastle et al. 2009; Mingo et al. 2014). In any case, the excess is generally well described by a power law. We thus included to the baseline model (Model A) a secondary, unabsorbed power law. In xspec notation, this model (Model B) reads: const*phabs*[zphabs*(pexrav + zgauss)+const2*powerlaw]. If the soft excess is interpreted as a scattered component, then const2 would represent the scattered fraction , which is generally of a few per cent or less (e.g. Turner et al. 1997). The parameters of the second power law are tied to those of pexrav. Finally, to test the presence of photoionized emission, we added a thermal component to Model B. We used the mekal model in xspec. Then, in xspec notation, this model (Model C) reads: const*phabs*[zphabs*(pexrav + zgauss + mekal)+const2*powerlaw].
The results obtained for each source are discussed below and summarized in Table 4, where we report the main best-fitting parameters. The X-ray spectral parameters for the other sources in our sample have been collected from the literature and are reported in Table 5.
3.3.1 0318+684
NuSTAR observed this source in 2016 with a net exposure of 24 ks, while XMM–Newton observed the source in 2006 (Obs. Id. 0312190501) with a net exposure of 6.5 ks. As a consistency check, we fitted the NuSTAR and XMM–Newton/pn spectra in the common bandpass 3–10 keV with a simple power law. The photon index was found to be in NuSTAR and in pn, i.e. the spectral shape is consistent with being the same. On the other hand, the normalization measured by pn is a factor of 2 higher than in NuSTAR, indicating a flux variation between the two observations. However, the spectral shape being consistent, we fitted simultaneously the NuSTAR and pn spectra, also including Swift/BAT and INTEGRAL/IBIS to get the broadest energy band (0.3–195 keV).
Model A provides a decent fit to the data (), but leaves significant residuals in the soft band. The fit is improved using Model B (, ), and we obtain decent constraints on the intrinsic photon index and on the column density, as reported in Table 4. These results are consistent, within the errors, with those reported by Winter et al. (2008) from the analysis of the pn data alone. We only have an upper limit to the reflection fraction , while the Gaussian line at 6.4 keV has an equivalent width of eV. The high-energy cut-off is found to be keV.
3.3.2 PKS 0707-35
Only NuSTAR and BAT data were available for this source, we thus fitted the spectra with the baseline Model A. We find a good fit with . The cross-calibration constant is large (), but leaving the photon index free to change between NuSTAR and BAT does not improve the fit. We only derive rough upper limits to the presence of a reflection component () and of the Fe K line ( eV). We note that the 2–10 keV flux measured by NuSTAR is a factor of 4 less than that by Suzaku ( ergs s-1 cm-2) as given in Tazaki et al. (2013).
3.3.3 Mrk 1498
This source was observed by NuSTAR in 2015 with a net exposure of 24 ks, and by XMM–Newton in 2007 (Obs. Id. 0500850501) with a net exposure of 7.5 ks. Since the spectrum shows strong signatures of X-ray absorption, to check for consistency between NuSTAR and pn we proceeded as follows. We first fitted the 3–10 keV NuSTAR spectra with a simple power law modified by zphabs. We found a photon index and a column density of ( cm-2. Then, we fitted the pn spectrum in the same energy band and with the same model, fixing the parameters and only allowing for a free cross-calibration constant. We found a good fit and , indicating a good agreement between the two spectra. We fitted jointly the NuSTAR, pn and BAT spectra in the 0.3–195 keV band. Model A gives a very poor fit (). The fit is greatly improved using Model B (, ), but with significant residuals in the soft band. Finally, Model C yields a good fit with no prominent residuals (, ). We obtain a photon index of , a column density of ( cm-2, an upper limit to the reflection fraction of 0.35, and a cut-off energy of keV. The Fe K line has an equivalent width of eV. The temperature of the mekal component is found to be keV, while its normalization is (. Finally, the scattered fraction is (.
3.3.4 PKS 2331-240
NuSTAR observed this source in Jul. 2015 with a net exposure of 24 ks; XMM–Newton observed the source twice, in May and Nov. 2015 (Obs. Id. 0760990101 and 0760990201) with a net exposure of 18 and 20 ks, respectively. We first fitted the NuSTAR and pn spectra in the 3–10 keV band with a simple power law, finding a discrepancy between the different spectra. Indeed, we found a photon index of in NuSTAR, in the first pn spectrum and in the second pn spectrum. Moreover, the 3–10 keV flux in pn was found to be 20 and 30 per cent less than in NuSTAR. However, to constrain and the Fe K line, we chose to include the pn spectra in our fits, leaving the photon index free to vary among the different observations. Since the BAT photon index was poorly constrained, we tied it to that of NuSTAR. We obtain a decent fit using Model A (), with residuals that can be attributed to noise. Albeit this source is optically a Sy1.9, it is almost unabsorbed (see also Hernández-García et al. 2017) and we only find a column density of ( cm-2 in excess of the Galactic one. We find an upper limit to the reflection fraction of 0.3 and a Fe K line with an equivalent width of eV. The NuSTAR photon index for the broad-band (0.3–195 keV) fit is , while for pn we have and (consistent with Hernández-García et al. 2017) and a cross-calibration constant of and , respectively.
3.3.5 PKS 2356-61
We fitted the NuSTAR and BAT spectra with Model A, which yields a decent fit (). We obtain a photon index of and a column density of ( cm-2, in agreement with the results of Mingo et al. (2014) from Chandra data alone. We only derive upper limits to the presence of a reflection component () and of a Fe K line ( eV).
| Name | Model | |||||||||
|---|---|---|---|---|---|---|---|---|---|---|
| ( cm-2) | (keV) | (eV) | ||||||||
| 0318+684 | B | 245/237 | ||||||||
| PKS 0707-35 | A | - | - | 100/95 | ||||||
| Mrk 1498 | C | - | 396/390 | |||||||
| PKS 2331-240 | A | - | 611/540 | |||||||
| PKS 2356-61 | A | - | - | 131/159 |
| Name | Ref. | |||||
|---|---|---|---|---|---|---|
| ( cm-2) | (keV) | (eV) | ||||
| B3 0309+411b | - | - | 1 | |||
| 4C 73.08 | - | 2 | ||||
| HE 1434-1600 | - | - | - | - | 3 | |
| IGR J14488-4008 | 1(f) | 4 | ||||
| 4C 63.22 | - | - | - | - | 3 | |
| 4C 34.47 | - | - | 5 | |||
| IGR J17488-2338 | - | 6 | ||||
| PKS 2014-55 | - | - | - | 3 | ||
| 4C 74.26 | 1.8–1.9 | 90–200 | 7,8,9 |
4 Discussion
4.1 X-ray properties
The X-ray spectral properties of the hard X-ray selected GRGs of our sample are overall consistent with that of normal-size FR II radio galaxies, and more precisely of ‘high-excitation’ radio galaxies (HERGs) powered by efficient accretion (e.g. Hardcastle et al. 2006, 2009; Mingo et al. 2014). The X-ray spectra are generally well described by a power law with a photon index in the range 1.6–1.9, i.e. typical of average AGNs (e.g. Malizia et al. 2014). In general, past observations have shown that spectral features such as the Compton hump and the Fe K line tend to be weaker in radio galaxies, compared with radio-quiet Seyferts (e.g. Wozniak et al. 1998; Eracleous et al. 2000; Grandi et al. 2001; Molina et al. 2008; Walton et al. 2013). From high-sensitivity measurements obtained in recent years with NuSTAR, a weak or absent reflection bump has been found in 3C 382 Ballantyne et al. (2014); Ursini et al. (2018b), 3C 273 Madsen et al. (2015), 3C 390.3 Lohfink et al. (2015) and Cen A Fürst et al. (2016); on the other hand, signatures of reflection (neutral or ionized) have been observed in 3C 120 Lohfink et al. (2013), Cyg A Reynolds et al. (2015) and 4C 74.26 Lohfink et al. (2017), which is part of our sample. Although our results suggest a trend of weak reflection features, future studies on larger samples will be needed to properly estimate the contribution of the reflection component in radio galaxies. Interestingly, King et al. (2017) reported an inverse correlation between the radio Eddington luminosity and the X-ray reflection fraction in a sample of AGNs, both radio-quiet and radio-loud. King et al. (2017) interpreted this result in terms of an outflowing, mildly relativistic corona, whose emission is beamed away from the accretion disc and the surrounding material (e.g. Beloborodov 1999; Malzac et al. 2001). This would be consistent with the X-ray corona being the base of the radio jet, as suggested for X-ray binaries Markoff et al. (2005) and radio galaxies like 3C 120 Lohfink et al. (2013).
An exponential high-energy cut-off is measured in 4 sources out of 14, two of which have been analysed here (0318+684 and Mrk 1498). In three cases, we only derived lower limits to the cut-off based on NuSTAR data. The presence of a high-energy cut-off is consistent with the X-ray emission originating via thermal Comptonization rather than synchrotron and/or inverse Compton in a jet. We also note that none of our sources is a strong gamma-ray emitter, as they are not detected by Fermi Acero et al. (2015); to our knowledge, the only exception is B3 0309+411b, for which Hooper et al. (2016) reported a 0.1–100 GeV flux ergs s-1 cm-2 from 85-month Fermi data. The lack of a strong gamma-ray emission indicates that a high-energy cut-off is likely present below the MeV band.
All in all, the X-ray emission is consistent with being accretion-related and possibly due to a hot Comptonizing corona, that could be outflowing. The jet component could give a significant contribution, at least in the soft X-ray band Hardcastle et al. (2006, 2009), but is unlikely to dominate the overall emission in most sources (see also Mingo et al. 2017). In the case of PKS 2331-240, the X-ray emission is consistent with originating from external inverse Compton scattering in the jet Hernández-García et al. (2017), but this is the only source of our sample classified as a blazar.
Finally, the X-ray absorption properties are in agreement with the zeroth-order predictions of unified models of AGNs (e.g. Antonucci 1993; Urry & Padovani 1995), as type 1 and 2 objects tend to be unobscured and obscured, respectively (for a detailed discussion on the full sample of hard X-ray selected radio galaxies, see Panessa et al. 2016).
In Table 6 we report the X-ray (2–10 keV) flux and luminosity of all the 14 GRGs of our sample, and the radio (1.4-GHz) flux density and luminosity of their core and lobes. The radio flux densities were mostly taken from the literature (see Tables 1 and 2). For IGR J14488-4008, we extrapolated to 1.4 GHz the GMRT measurements at 325 and 610 MHz by Molina et al. (2015). For PKS 2014-55 the fluxes of the core and of the extended structures were estimated from the ATCA map Saripalli et al. (2007). For PKS 2356-61, we extrapolated to 1.4 GHz the 2.3-GHz and 5-GHz measurements by Morganti et al. (1993, 1997). In the case of PKS 0707-35, we reported the fluxes of the inner lobes (a) and outer lobes (b) separately Saripalli et al. (2013). A more detailed analysis of the radio properties of the sample will be developed in Bruni et al. (in prep.).
4.2 Radio–X-ray relation
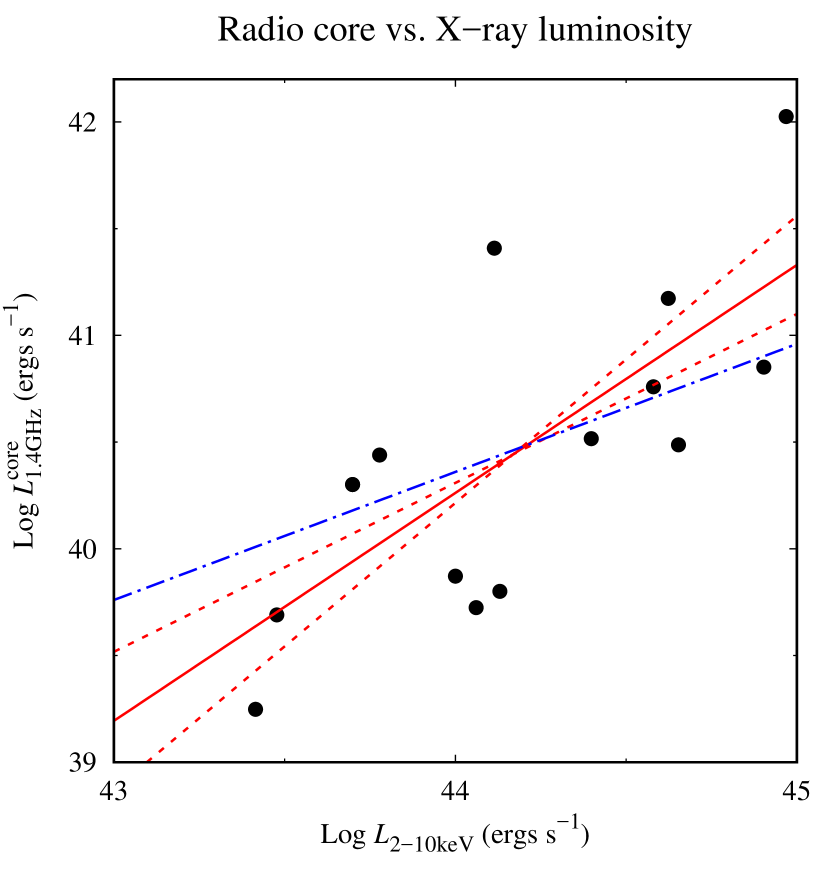
A relationship is known to exist between the radio core luminosity, the X-ray luminosity and the black hole mass in AGNs and X-ray binaries (the so-called fundamental plane of black hole activity: Merloni et al. 2003; Falcke et al. 2004; Gültekin et al. 2009). The original relation of Merloni et al. (2003) is:
| (1) |
with , and . In fig. 1 we plot the radio luminosity against the X-ray luminosity for our sources. We performed a linear regression fit in the logarithmic space:
| (2) |
finding and . The linear correlation is significant, as we calculate a Kendall’s coefficient with a -value of . However, to properly evaluate the significance of this correlation, we need to take into account the uncertainty on the X-ray and radio luminosities. In principle, both measurement errors and flux variability can contribute to this uncertainty. However, the measurement errors are generally small, i.e. no more than a few per cent; flux variability, on the other hand, can easily amount up to a factor of a few. In particular, the X-ray variability in our sources can be up to 0.3 dex as indicated by the cross-calibration constants of our fits (see Table 4). Taking 0.3 dex as a fiducial uncertainty on and , we performed a bootstrap on the data, finding a 99 per cent confidence interval for the Kendall’s coefficient of . Finally, we tested for a possible distance effect on the correlation, namely the bias introduced by the common dependence of and on the distance (e.g. Merloni et al. 2006). We thus performed a partial Kendall’s correlation test among and , using the luminosity distance as the third variable. We obtained with a -value of , i.e. still a significant correlation. Also in this case, we performed a bootstrap on the data, assuming an uncertainty on the distance of 0.4 dex due to the uncertainty on the Hubble flow Körding et al. (2006). We obtained a 99 per cent confidence interval for the Kendall’s coefficient of .
In fig. 1 we overplot the relation of Merloni et al. (2003) converting the 5-GHz luminosity into the 1.4-GHz luminosity assuming a radio spectral index , where Condon et al. (2002), and a black hole mass of solar masses. We note that the estimates of the black hole mass are available only in 8 sources out of 14 (i.e. the brightest, see Panessa et al. 2016). This uncertainty, coupled with the intrinsic scatter about the fundamental plane, could explain the discrepancy among the data and the relation of Merloni et al. (2003), also given the limited size of our sample. We also note that different estimates of the fundamental plane have been reported, using larger samples (e.g. Körding et al. 2006; Li et al. 2008; Bonchi et al. 2013). However, our results are consistent with previous findings by Panessa et al. (2015), who analysed the 1.4-GHz radio properties of a complete sample of hard X-ray selected AGNs, reporting a steep radio–X-ray correlation (). It is thus possible that the hard X-ray GRGs belong to a different branch in the radio–X-ray correlation. The physical meaning of the fundamental plane is the existence of a relationship between accretion power and jet emission (e.g. Hardcastle et al. 2009), both in AGNs and in Galactic X-ray binaries (e.g. Gallo et al. 2003). Although the underlying mechanism of this coupling is still a matter of speculation, it might suggest that the X-ray emitting corona is the base of the jet (e.g. Markoff et al. 2005). However, alternative models exist, like the so-called jet emitting discs in X-ray binaries Ferreira et al. (2006); Petrucci et al. (2010). Furthermore, X-ray binaries seem to exhibit two different branches in the radio–X-ray correlation: the ‘standard’ branch with , and a second branch with Coriat et al. (2011); Gallo et al. (2012). The first branch is consistent with the source being powered by a radiatively inefficient accretion flow, in which most of the released energy is advected Narayan & Yi (1994) and/or channelled into outflows Blandford & Begelman (1999) or jets Markoff et al. (2005). The second branch is instead consistent with radiatively efficient flows, like the standard Shakura & Sunyaev (1973) accretion disc or the jet-emitting disc Ferreira et al. (2006). Extrapolating these results to AGNs, the hard X-ray selected GRGs would be located in the ‘efficient’ branch of the radio–X-ray diagram, since . This in turn suggests that their nuclear activity is driven by a radiatively efficient mode of accretion, with the caveat that several uncertainties remain on the nature of the ‘efficient’ branch, complicating the theoretical interpretation (Gallo et al. 2012, but see also Motta et al. 2018).
4.3 Bolometric luminosity
In radio galaxies, the radio luminosity of the lobes is found to be related with the disc luminosity (e.g. Willott et al. 1999; Körding et al. 2008; van Velzen & Falcke 2013; van Velzen et al. 2015). In particular, van Velzen et al. (2015) reported a linear correlation, in the logarithmic space, between the 1.4-GHz lobes luminosity and the bolometric luminosity estimated from the optical one; the normalization is
| (3) |
We used this relation to estimate the bolometric luminosity from . This estimate is labelled in the following. The major source of uncertainty on is the scatter of the van Velzen et al. (2015) relation, amounting to 0.47 dex (rms).
The bolometric luminosity can be independently estimated from the X-ray 2–10 keV luminosity using bolometric corrections (e.g. Marconi et al. 2004; Hopkins et al. 2007; Runnoe et al. 2012). Assuming the Marconi et al. (2004) correction, we computed the bolometric luminosity . This quantity is directly related to the present nuclear activity, while can be viewed as a tracer of the past activity. Because the scatter of the Marconi et al. (2004) relation is dex, the main source of uncertainty on is the X-ray flux variability, which increases the spread in any bolometric correction Vasudevan & Fabian (2007). We also note that assuming a different bolometric correction would yield estimates of within a factor of a few. For example, the linear correction of Runnoe et al. (2012) for radio-loud AGNs yields estimates within a factor of , while the luminosity-dependent correction of Hopkins et al. (2007) yields systematically larger estimates of up to a factor of 2. We also checked that the estimates of are in rough agreement, again within a factor of a few, with the constant correction of Mushotzy et al. (2008) for the 14–195 keV luminosity, and with the Eddington ratio-dependent correction of Vasudevan & Fabian (2009). However, we stress that our main purpose is only to compare the AGN luminosity as traced by the X-ray emission with the luminosity as inferred by the radio lobes.
In Fig. 2 we plot the two independent estimates of the bolometric luminosity. Most of the objects exhibit a discrepancy between and , being around one order of magnitude smaller than . Despite all the aforementioned uncertainties, the discrepancy between and is significant, at least in 9 sources out of 14. Interestingly, this discrepancy is consistent with a similar trend seen in blazars with double radio lobes Pjanka et al. (2017). Indeed, Pjanka et al. (2017) found that the blazar jet powers measured from radio lobes are a factor of lower than those from blazar-model spectral fitting Ghisellini et al. (2014) or from the angular shift of the radio core Zdziarski et al. (2015). Pjanka et al. (2017) proposed two different explanations for this discrepancy. First, it could be a signature of intermittent accretion. In this case, luminous and efficient quasars () could be caught in a high state lasting only a small fraction of the entire lifetime, which is mostly spent in quiescent states (see also van Velzen & Falcke 2013). Alternatively, the jet power from the blazar model could be overestimated due to the presence of e± pairs (see also Sikora 2016). In our case, we observe a discrepancy between the nuclear luminosity, traced by the X-rays, and the radio lobes luminosity, estimated from the disc-lobes relationship reported by van Velzen et al. (2015) for radio selected FR IIs. This could mean that the van Velzen et al. (2015) relationship may not hold for the GRGs in our sample. This in turn suggests that either their nuclear luminosity is higher than the average luminosity during their lifetime, or that their lobes luminosity is lower than expected (possibly due to radiative losses). The former hypothesis could point to an intermittent activity scenario, as we discuss in the next sections. However, we cannot exclude that the correlation of van Velzen et al. (2015) is affected by sample selection effects, since different studies have found wider ranges of radio luminosities, or jet powers, for a given accretion-related luminosity, e.g. in the optical Mingo et al. (2014) or mid-infrared Gürkan et al. (2014). Therefore, the estimate should not to be overinterpreted (see also Hardcastle 2018; Croston et al. 2018). Still, it is remarkable that a similar result is obtained, with independent methods, both in blazars and in GRGs, i.e. two classes vastly different in physical size and in jet orientation. In the next section we will also show that the estimated jet power is much lower than in radio luminous radio galaxies.
Finally, for the sources having estimates of the black hole mass, we can also estimate the Eddington ratio as the ratio between the bolometric luminosity and the Eddington luminosity. In 7 sources out of 8, we estimate Eddington ratios between 0.02 and 0.37, i.e. consistent with the typical values found in efficient HERGs Best & Heckman (2012); Mingo et al. (2014). For 4C 34.47 we obtain an Eddington ratio of , which could indicate that the bolometric luminosity is over-predicted, and/or that the black hole mass is underestimated ( according to Liu et al. 2006, single-epoch estimate based on the H line).
| Name | (2–10 keV) | (2–10 keV) | ||||
| ( ergs s-1 cm-2) | ( ergs s-1) | (mJy) | (mJy) | ( ergs s-1) | ( ergs s-1) | |
| B3 0309+411b | 2.4 | 13 | 379 | 141 | 25.6 | 9.5 |
| 0318+684 | 3.7 | 13.5 | 22 | 801 | 0.6 | 23 |
| PKS 0707-35(a) | 1.2 | 5 | 44.6 | 445.6 | 2 | 20.5 |
| PKS 0707-35(b) | 1455.4 | 67 | ||||
| 4C 73.08 | 1.6 | 2.6 | 15.6 | 2521.4 | 0.18 | 28.6 |
| HE 1434-1600 | 7.2 | 38 | 72 | 7068 | 5.7 | 564 |
| IGR J14488-4008 | 5.3 | 25 | 58.2 | 276.6 | 3.3 | 15.6 |
| 4C 63.22 | 3.6 | 45 | 18.3 | 657.7 | 3.1 | 110 |
| Mrk 1498 | 8.1 | 10 | 74 | 557 | 0.74 | 5.6 |
| 4C 34.47 | 8.5 | 93 | 610 | 980 | 106 | 171 |
| IGR J17488-2338 | 2.0 | 42 | 60.5 | 337.1 | 14.9 | 83.3 |
| PKS 2014-55 | 3.9 | 3.0 | 40 | 2560 | 0.49 | 31.3 |
| 4C 74.26 | 3.0 | 80 | 184 | 1621 | 7.1 | 62.6 |
| PKS 2331-240 | 12.0 | 6 | 362 | 798 | 2.8 | 6.1 |
| PKS 2356-61 | 2.7 | 11.5 | 16 | 24700 | 0.53 | 820 |

4.4 Jet power
The time-averaged kinetic power of AGN jets can be estimated from the extended radio luminosity 222To this goal, we converted the 1.4-GHz luminosity into the 151-MHz luminosity assuming a spectral index of 0.7. Willott et al. (1999); Cavagnolo et al. (2010). We estimated the jet power using the relationship obtained by Willott et al. (1999), based on the minimum energy required in the lobes to produce the observed synchrotron luminosity and the evolution of the radio source. In particular, we used eq. 12 of Willott et al. (1999):
| (4) |
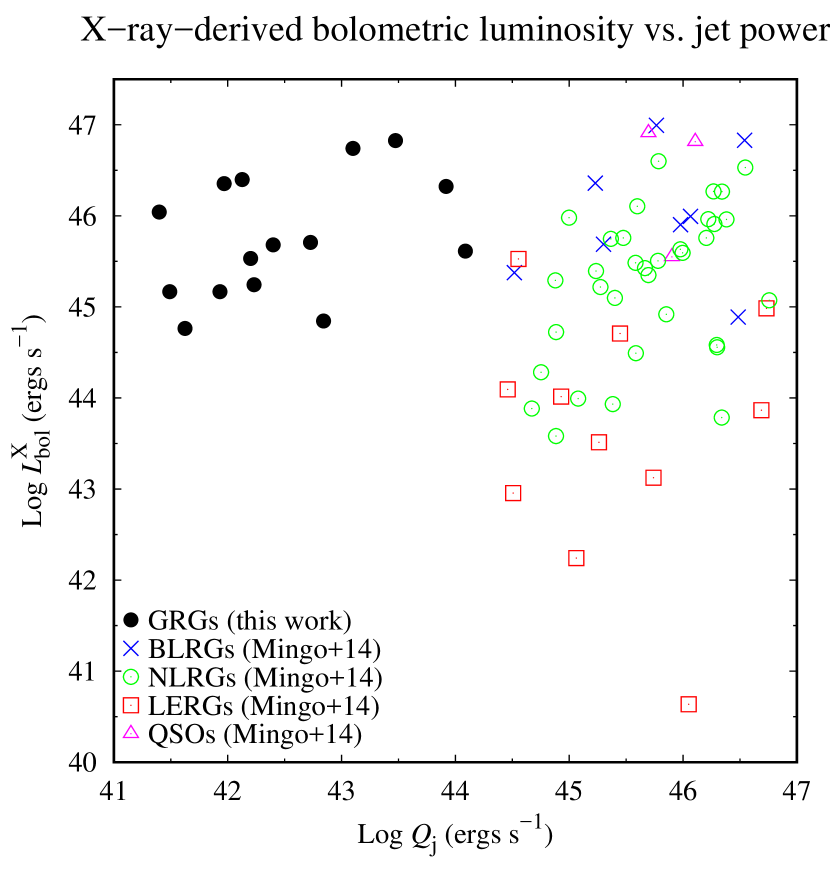
where is the luminosity at 151 MHz in units of W Hz-1 sr-1. The uncertainties in the model assumptions are enclosed in a factor , expected to be in the range 1–20, where depends on . In principle, this would imply a systematic uncertainty up to two orders of magnitude in jet power for a given radio luminosity (see also Godfrey & Shabala 2013). However, the scatter in the radio power/jet power relation is much lower, both from direct measurements Godfrey & Shabala (2013) and numerical simulations (at least for sources in a narrow redshift band, see Hardcastle 2018). In any case, the relation is useful to probe the efficiency of jet production in different classes of AGNs, as done by Mingo et al. (2014). In Fig. 3 we plot the X-ray-derived bolometric luminosity against the jet power. Our GRGs are added on to the plot of the sample of bright radio galaxies of Mingo et al. (2014), selected combining the 2 Jy catalogue Wall & Peacock (1985) with the 3CRR catalogue Laing et al. (1983). We note that Mingo et al. (2014), like us, assumed the Marconi et al. (2004) bolometric correction and the Willott et al. (1999) relation to derive and , respectively. For simplicity, we plot only the sources of the Mingo et al. (2014) sample with a well constrained (see their Fig. 12). Following Mingo et al. (2014), we highlight different optical classes: broad-line radio galaxies (BLRGs), narrow-line radio galaxies (NLRGs), low-excitation radio galaxies (LERGs) and quasars.
From Fig. 3, it can be seen that the X-ray-derived bolometric luminosity of the GRGs of our sample is consistent with that of HERGs (namely BLRGs, NLRGs and quasars) in the Mingo et al. (2014) sample. On the other hand, the estimated jet power of our GRGs is found to be down to ergs s-1, and much lower than that of the sources of Mingo et al. (2014). This is not totally unexpected, because the sources of Mingo et al. (2014) are by construction the most radio luminous in the Universe, implying the highest jet powers. However, the difference with our GRGs can be very large, up to 3 orders of magnitude in jet power. Moreover, Mingo et al. (2014) also compared their sample with an optically selected sample of radio-loud quasars Punsly & Zhang (2011), and even those sources have an estimated ergs s-1. Therefore, the interpretation of our results is not straightforward. First, the (unknown) environment and source age can strongly affect the estimate of the jet power (e.g. Shabala & Godfrey 2013; Hardcastle 2018). Giant sources might have undergone severe radiative losses compared with normal-size radio galaxies, which could explain the relatively small inferred jet power. In other words, any relation between accretion power and ejection at small scales (i.e. the radio core) could be completely lost as the source grows in size, due to radiative losses and complex interaction with the environment. Then, in a luminosity-luminosity diagram like that of Fig. 3, GRGs in the early stage of their life could well start in the upper right part (i.e. high nuclear luminosities/high jet powers) and move to the left side at later times. If in most sources the central engine gradually fades (and eventually switches off), most of radio-selected GRGs would be expected to populate the lower part of the plot (i.e. low nuclear luminosities). Hard X-ray selection instead picks the GRGs with a high nuclear luminosity. These could be sources that are able to keep a more or less constant nuclear power during their life (so they just shift horizontally along the diagram), or that experienced one or more episodes of restarting activity.
4.5 Restarting activity?
A number of radio galaxies are known to exhibit signatures of restarting activity, from their morphological and/or spectral radio properties (Saikia & Jamrozy 2009, and references therein). A striking evidence of restarting activity is seen in the so-called double-double radio galaxies, which exhibit two distinct pairs of radio lobes: a ‘new’ one, closer to the core, and an ‘old’ one, farther away (e.g. Schoenmakers et al. 2000b). Among our sample, PKS 0707-35 is a clear example of a restarted radio galaxy Saripalli et al. (2013). PKS 2014-55 is also a restarted giant radio galaxy with an X-shaped morphology that could be a signature of jet reorientation Saripalli et al. (2007). An extreme case of jet realignment is PKS 2331-240, that switched from a double-lobe GRG to a blazar Hernández-García et al. (2017). Other hints of restarting jet activity have been found in 4C 73.08, that displays an extended radio cocoon around the brighter lobes Weżgowiec et al. (2016). Concerning the spectral properties, some GRGs show a Gigahertz-Peaked Spectrum (GPS) core, which is generally associated with young and compact radio sources at the early stage of their evolution (e.g. O’Dea 1998). This suggests that the core emission is relatively recent, despite the old age of the lobes. Among our sample, this is seen at least in 0318+684 Schoenmakers et al. (1998) and 4C 74.26 Pearson et al. (1992). A detailed discussion will be presented in Bruni et al. (in prep.), showing that signatures of restarting activity are found in at least 11 sources out of 14, i.e. 80 per cent of the sample. The restarting activity scenario is an intriguing possibility to explain the properties of hard X-ray selected GRGs. On the one hand, the correlation between radio cores and X-ray emission indicates the existence of a physical relationship between the inner jet at pc scales and the X-ray-emitting region. On the other hand, the jet power and the luminosity of the radio lobes in most sources is less than expected from the nuclear luminosity. Therefore, the sources could be in a restarting phase, characterized by efficient accretion and a high nuclear activity.
Although hard X-ray selection favours the detection of giant objects, no correlation is found between the X-ray luminosity and the source size, consistent with the idea that more than one parameter is involved in the production of large-scale radio structures Bassani et al. (2016). One of such parameters could be the duty cycle. The intermittency of fuel supply can occur on different time-scales, and has been assumed to explain the optical properties of weak-line radio galaxies (Tadhunter 2016, and references therein). If the accretion mechanism in AGNs and black hole X-ray binaries is the same, as suggested by the fundamental plane, then we expect AGNs to undergo dramatic changes of the accretion state like those seen in X-ray binaries (e.g. Maccarone et al. 2003). Given their old age, GRGs offer chances to witness such variations and constrain scenarios of episodic activity. Alternatively, if the nuclear activity does not change dramatically over time, the observed dimming of the radio lobes could be due to expansion losses. In particular the inverse Compton scattering of the cosmic microwave background is expected to dominate in giant sources (e.g. Ishwara-Chandra & Saikia 1999; Laskar et al. 2010; Hardcastle 2018). This would lead us to the prediction that the intrinsic fraction of GRGs is much larger than that found in present radio surveys, being greater than the 20 per cent found from hard X-ray selection (including relict sources not seen in the X-rays and not currently fed by the jet; see Saripalli et al. 2005). However, in this case the nuclei are required to stay continuously active for around 100–250 Myr, as indicated by the typical dynamical ages estimated for GRGs Machalski (2011).
5 Summary
We have presented the first broad-band X-ray study of the nuclei of a sample of 14 hard X-ray selected GRGs, from the literature and the analysis of archival X-ray data. Our main conclusions can be summarized as follows:
-
-
The X-ray properties of hard X-ray selected GRGs are analogous to that of normal-size FR II radio galaxies. The X-ray photon index is generally consistent with that of radio-quiet AGNs, and a high-energy cut-off is measured in 4 sources. The bulk of the X-ray emission is generally consistent with originating from a Comptonizing corona, possibly outflowing, coupled to a radiatively efficient accretion flow ().
-
-
The X-ray luminosity correlates with the radio core luminosity, as expected from the fundamental plane of black hole activity for AGNs and X-ray binaries. However, the relationship is consistent with the ‘radiatively efficient’ branch of the radio–X-ray correlation rather than the ‘standard/inefficient’ branch, consistently with the optical HERG classification.
-
-
The radio luminosity of the lobes is relatively low compared with the nuclear luminosity, as also indicated by the estimate of the jet kinetic power. This can can be explained by restarting activity (i.e. the sources are currently highly accreting and in a high-luminosity state compared with the past activity that produced the old and extended radio lobes) and/or by a significant dimming of the radio lobes due to expansion losses.
Acknowledgements
We thank the referee for useful comments that improved the paper. We acknowledge the use of public data from the NuSTAR, XMM–Newton, Swift and INTEGRAL data archives. This research has made use of data, software and/or web tools obtained from NASA’s High Energy Astrophysics Science Archive Research Center (HEASARC), a service of Goddard Space Flight Center and the Smithsonian Astrophysical Observatory, and of the NuSTAR Data Analysis Software jointly developed by the ASI Space Science Data Center (SSDC, Italy) and the California Institute of Technology (USA). We acknowledge financial support from ASI under contracts ASI/INAF 2013-025-R0 and ASI/INAF I/037/12/0 (NARO18).
References
- Acero et al. (2015) Acero F., et al., 2015, The Astrophysical Journal Supplement Series, 218
- Anders & Grevesse (1989) Anders E., Grevesse N., 1989, Geochimica Cosmochimica Acta, 53, 197
- Antonucci (1993) Antonucci R., 1993, ARA&A, 31, 473
- Arnaud (1996) Arnaud K. A., 1996, in Jacoby G. H., Barnes J., eds, Astronomical Society of the Pacific Conference Series Vol. 101, Astronomical Data Analysis Software and Systems V. p. 17
- Ballantyne et al. (2014) Ballantyne D. R., et al., 2014, ApJ, 794, 62
- Balmaverde et al. (2006) Balmaverde B., Capetti A., Grandi P., 2006, A&A, 451, 35
- Barthelmy et al. (2005) Barthelmy S. D., et al., 2005, Space Sci. Rev., 120, 143
- Bassani et al. (2016) Bassani L., Venturi T., Molina M., Malizia A., Dallacasa D., Panessa F., Bazzano A., Ubertini P., 2016, MNRAS, 461, 3165
- Baumgartner et al. (2013) Baumgartner W. H., Tueller J., Markwardt C. B., Skinner G. K., Barthelmy S., Mushotzky R. F., Evans P. A., Gehrels N., 2013, ApJS, 207, 19
- Beloborodov (1999) Beloborodov A. M., 1999, ApJ, 510, L123
- Best & Heckman (2012) Best P. N., Heckman T. M., 2012, MNRAS, 421, 1569
- Bird et al. (2010) Bird A. J., et al., 2010, ApJS, 186, 1
- Blandford & Begelman (1999) Blandford R. D., Begelman M. C., 1999, MNRAS, 303, L1
- Bonchi et al. (2013) Bonchi A., La Franca F., Melini G., Bongiorno A., Fiore F., 2013, MNRAS, 429, 1970
- Cavagnolo et al. (2010) Cavagnolo K. W., McNamara B. R., Nulsen P. E. J., Carilli C. L., Jones C., Bîrzan L., 2010, ApJ, 720, 1066
- Condon et al. (2002) Condon J. J., Cotton W. D., Broderick J. J., 2002, AJ, 124, 675
- Coriat et al. (2011) Coriat M., et al., 2011, MNRAS, 414, 677
- Croston et al. (2018) Croston J. H., Ineson J., Hardcastle M. J., 2018, MNRAS, 476, 1614
- Di Gesu & Costantini (2016) Di Gesu L., Costantini E., 2016, A&A, 594, A88
- Eguchi et al. (2009) Eguchi S., Ueda Y., Terashima Y., Mushotzky R., Tueller J., 2009, ApJ, 696, 1657
- Eracleous et al. (2000) Eracleous M., Sambruna R., Mushotzky R. F., 2000, ApJ, 537, 654
- Falcke et al. (2004) Falcke H., Körding E., Markoff S., 2004, A&A, 414, 895
- Fanaroff & Riley (1974) Fanaroff B. L., Riley J. M., 1974, MNRAS, 167, 31P
- Ferreira et al. (2006) Ferreira J., Petrucci P.-O., Henri G., Saugé L., Pelletier G., 2006, A&A, 447, 813
- Fürst et al. (2016) Fürst F., et al., 2016, ApJ, 819, 150
- Gallo et al. (2003) Gallo E., Fender R. P., Pooley G. G., 2003, MNRAS, 344, 60
- Gallo et al. (2012) Gallo E., Miller B. P., Fender R., 2012, MNRAS, 423, 590
- George & Fabian (1991) George I. M., Fabian A. C., 1991, MNRAS, 249, 352
- Ghisellini et al. (1994) Ghisellini G., Haardt F., Matt G., 1994, MNRAS, 267, 743
- Ghisellini et al. (2014) Ghisellini G., Tavecchio F., Maraschi L., Celotti A., Sbarrato T., 2014, Nature, 515, 376
- Godfrey & Shabala (2013) Godfrey L. E. H., Shabala S. S., 2013, ApJ, 767, 12
- Grandi et al. (2001) Grandi P., Maraschi L., Urry C. M., Matt G., 2001, ApJ, 556, 35
- Grandi et al. (2006) Grandi P., Malaguti G., Fiocchi M., 2006, ApJ, 642, 113
- Guainazzi & Bianchi (2007) Guainazzi M., Bianchi S., 2007, MNRAS, 374, 1290
- Guainazzi et al. (2005) Guainazzi M., Matt G., Perola G. C., 2005, A&A, 444, 119
- Gültekin et al. (2009) Gültekin K., Cackett E. M., Miller J. M., Di Matteo T., Markoff S., Richstone D. O., 2009, ApJ, 706, 404
- Gürkan et al. (2014) Gürkan G., Hardcastle M. J., Jarvis M. J., 2014, MNRAS, 438, 1149
- Haardt & Maraschi (1991) Haardt F., Maraschi L., 1991, ApJ, 380, L51
- Haardt et al. (1994) Haardt F., Maraschi L., Ghisellini G., 1994, ApJ, 432, L95
- Haardt et al. (1997) Haardt F., Maraschi L., Ghisellini G., 1997, ApJ, 476, 620
- Hardcastle (2018) Hardcastle M. J., 2018, MNRAS, 475, 2768
- Hardcastle & Krause (2013) Hardcastle M. J., Krause M. G. H., 2013, MNRAS, 430, 174
- Hardcastle et al. (2006) Hardcastle M. J., Evans D. A., Croston J. H., 2006, MNRAS, 370, 1893
- Hardcastle et al. (2009) Hardcastle M. J., Evans D. A., Croston J. H., 2009, MNRAS, 396, 1929
- Harrison et al. (2013) Harrison F. A., et al., 2013, ApJ, 770, 103
- Hernández-García et al. (2017) Hernández-García L., et al., 2017, A&A, 603, A131
- Hernández-García et al. (2018) Hernández-García L., et al., 2018, MNRAS, 478, 4634
- Hooper et al. (2016) Hooper D., Linden T., Lopez A., 2016, J. Cosmology Astropart. Phys., 8, 019
- Hopkins et al. (2007) Hopkins P. F., Richards G. T., Hernquist L., 2007, ApJ, 654, 731
- Ishwara-Chandra & Saikia (1999) Ishwara-Chandra C. H., Saikia D. J., 1999, MNRAS, 309, 100
- Jagers et al. (1982) Jagers W. J., Miley G. K., van Breugel W. J. M., Schilizzi R. T., Conway R. G., 1982, A&A, 105, 278
- Jansen et al. (2001) Jansen F., et al., 2001, A&A, 365, L1
- Kaiser & Alexander (1999) Kaiser C. R., Alexander P., 1999, MNRAS, 302, 515
- Kalberla et al. (2005) Kalberla P. M. W., Burton W. B., Hartmann D., Arnal E. M., Bajaja E., Morras R., Pöppel W. G. L., 2005, A&A, 440, 775
- Keel et al. (2015) Keel W. C., et al., 2015, AJ, 149, 155
- Keel et al. (2017) Keel W. C., et al., 2017, ApJ, 835, 256
- King et al. (2017) King A. L., Lohfink A., Kara E., 2017, ApJ, 835, 226
- Körding et al. (2006) Körding E., Falcke H., Corbel S., 2006, A&A, 456, 439
- Körding et al. (2008) Körding E. G., Jester S., Fender R., 2008, MNRAS, 383, 277
- Laing et al. (1983) Laing R. A., Riley J. M., Longair M. S., 1983, MNRAS, 204, 151
- Lara et al. (2001) Lara L., Cotton W. D., Feretti L., Giovannini G., Marcaide J. M., Márquez I., Venturi T., 2001, A&A, 370, 409
- Laskar et al. (2010) Laskar T., Fabian A. C., Blundell K. M., Erlund M. C., 2010, MNRAS, 401, 1500
- Letawe et al. (2004) Letawe G., Courbin F., Magain P., Hilker M., Jablonka P., Jahnke K., Wisotzki L., 2004, A&A, 424, 455
- Li et al. (2008) Li Z.-Y., Wu X.-B., Wang R., 2008, ApJ, 688, 826
- Liu et al. (2006) Liu Y., Jiang D. R., Gu M. F., 2006, ApJ, 637, 669
- Lohfink et al. (2013) Lohfink A. M., et al., 2013, ApJ, 772, 83
- Lohfink et al. (2015) Lohfink A. M., et al., 2015, ApJ, 814, 24
- Lohfink et al. (2017) Lohfink A. M., et al., 2017, ApJ, 841, 80
- Maccarone et al. (2003) Maccarone T. J., Gallo E., Fender R., 2003, MNRAS, 345, L19
- Machalski (2011) Machalski J., 2011, MNRAS, 413, 2429
- Machalski et al. (2004) Machalski J., Chyzy K. T., Jamrozy M., 2004, Acta Astron., 54, 249
- Mack et al. (1998) Mack K.-H., Klein U., O’Dea C. P., Willis A. G., Saripalli L., 1998, A&A, 329, 431
- Madsen et al. (2015) Madsen K. K., et al., 2015, ApJ, 812, 14
- Magdziarz & Zdziarski (1995) Magdziarz P., Zdziarski A. A., 1995, MNRAS, 273, 837
- Malarecki et al. (2013) Malarecki J. M., Staveley-Smith L., Saripalli L., Subrahmanyan R., Jones D. H., Duffy A. R., Rioja M., 2013, MNRAS, 432, 200
- Malarecki et al. (2015) Malarecki J. M., Jones D. H., Saripalli L., Staveley-Smith L., Subrahmanyan R., 2015, MNRAS, 449, 955
- Malizia et al. (2012) Malizia A., Bassani L., Bazzano A., Bird A. J., Masetti N., Panessa F., Stephen J. B., Ubertini P., 2012, MNRAS, 426, 1750
- Malizia et al. (2014) Malizia A., Molina M., Bassani L., Stephen J. B., Bazzano A., Ubertini P., Bird A. J., 2014, ApJ, 782, L25
- Malzac et al. (2001) Malzac J., Beloborodov A. M., Poutanen J., 2001, MNRAS, 326, 417
- Marconi et al. (2004) Marconi A., Risaliti G., Gilli R., Hunt L. K., Maiolino R., Salvati M., 2004, MNRAS, 351, 169
- Markoff et al. (2005) Markoff S., Nowak M. A., Wilms J., 2005, ApJ, 635, 1203
- Matt et al. (1991) Matt G., Perola G. C., Piro L., 1991, A&A, 247, 25
- Matt et al. (2003) Matt G., Guainazzi M., Maiolino R., 2003, MNRAS, 342, 422
- Merloni et al. (2003) Merloni A., Heinz S., di Matteo T., 2003, MNRAS, 345, 1057
- Merloni et al. (2006) Merloni A., Körding E., Heinz S., Markoff S., Di Matteo T., Falcke H., 2006, New Astron., 11, 567
- Mingo et al. (2014) Mingo B., Hardcastle M. J., Croston J. H., Dicken D., Evans D. A., Morganti R., Tadhunter C., 2014, MNRAS, 440, 269
- Mingo et al. (2017) Mingo B., et al., 2017, MNRAS, 470, 2762
- Molina et al. (2008) Molina M., et al., 2008, MNRAS, 390, 1217
- Molina et al. (2013) Molina M., Bassani L., Malizia A., Stephen J. B., Bird A. J., Bazzano A., Ubertini P., 2013, MNRAS, 433, 1687
- Molina et al. (2014) Molina M., Bassani L., Malizia A., Bird A. J., Bazzano A., Ubertini P., Venturi T., 2014, A&A, 565, A2
- Molina et al. (2015) Molina M., Venturi T., Malizia A., Bassani L., Dallacasa D., Lal D. V., Bird A. J., Ubertini P., 2015, MNRAS, 451, 2370
- Morganti et al. (1993) Morganti R., Killeen N. E. B., Tadhunter C. N., 1993, MNRAS, 263, 1023
- Morganti et al. (1997) Morganti R., Oosterloo T. A., Reynolds J. E., Tadhunter C. N., Migenes V., 1997, MNRAS, 284, 541
- Motta et al. (2018) Motta S. E., Casella P., Fender R. P., 2018, MNRAS, 478, 5159
- Mushotzy et al. (2008) Mushotzy R. F., Winter L. M., McIntosh D. H., Tueller J., 2008, ApJ, 684, L65
- Narayan & Yi (1994) Narayan R., Yi I., 1994, ApJ, 428, L13
- O’Dea (1998) O’Dea C. P., 1998, PASP, 110, 493
- Oh et al. (2018) Oh K., et al., 2018, ApJS, 235, 4
- Panessa et al. (2015) Panessa F., et al., 2015, MNRAS, 447, 1289
- Panessa et al. (2016) Panessa F., et al., 2016, MNRAS, 461, 3153
- Parisi et al. (2012) Parisi P., et al., 2012, A&A, 545, A101
- Pearson et al. (1992) Pearson T. J., Blundell K. M., Riley J. M., Warner P. J., 1992, MNRAS, 259, 13P
- Petrucci et al. (2010) Petrucci P. O., Ferreira J., Henri G., Malzac J., Foellmi C., 2010, A&A, 522, A38
- Piconcelli et al. (2004) Piconcelli E., Jimenez-Bailón E., Guainazzi M., Schartel N., Rodríguez-Pascual P. M., Santos-Lleó M., 2004, MNRAS, 351, 161
- Pjanka et al. (2017) Pjanka P., Zdziarski A. A., Sikora M., 2017, MNRAS, 465, 3506
- Punsly & Zhang (2011) Punsly B., Zhang S., 2011, ApJ, 735, L3
- Reynolds et al. (2015) Reynolds C. S., et al., 2015, ApJ, 808, 154
- Ricci et al. (2017) Ricci C., et al., 2017, ApJS, 233, 17
- Runnoe et al. (2012) Runnoe J. C., Brotherton M. S., Shang Z., 2012, MNRAS, 422, 478
- Saikia & Jamrozy (2009) Saikia D. J., Jamrozy M., 2009, Bulletin of the Astronomical Society of India, 37
- Saripalli & Subrahmanyan (2009) Saripalli L., Subrahmanyan R., 2009, ApJ, 695, 156
- Saripalli et al. (2005) Saripalli L., Hunstead R. W., Subrahmanyan R., Boyce E., 2005, AJ, 130, 896
- Saripalli et al. (2007) Saripalli L., Subrahmanyan R., Laskar T., Koekemoer A., 2007, in Proc. Science (MRU), 052, From Planets to Dark Energy: the Modern Radio Universe. p. 130
- Saripalli et al. (2012) Saripalli L., Subrahmanyan R., Thorat K., Ekers R. D., Hunstead R. W., Johnston H. M., Sadler E. M., 2012, ApJS, 199, 27
- Saripalli et al. (2013) Saripalli L., Malarecki J. M., Subrahmanyan R., Jones D. H., Staveley-Smith L., 2013, MNRAS, 436, 690
- Schoenmakers et al. (1998) Schoenmakers A. P., Mack K.-H., Lara L., Röttgering H. J. A., de Bruyn A. G., van der Laan H., Giovannini G., 1998, A&A, 336, 455
- Schoenmakers et al. (2000a) Schoenmakers A. P., Mack K.-H., de Bruyn A. G., Röttgering H. J. A., Klein U., van der Laan H., 2000a, A&AS, 146, 293
- Schoenmakers et al. (2000b) Schoenmakers A. P., de Bruyn A. G., Röttgering H. J. A., van der Laan H., Kaiser C. R., 2000b, MNRAS, 315, 371
- Shabala & Godfrey (2013) Shabala S. S., Godfrey L. E. H., 2013, ApJ, 769, 129
- Shakura & Sunyaev (1973) Shakura N. I., Sunyaev R. A., 1973, A&A, 24, 337
- Sikora (2016) Sikora M., 2016, Galaxies, 4, 12
- Subrahmanyan et al. (1996) Subrahmanyan R., Saripalli L., Hunstead R. W., 1996, MNRAS, 279, 257
- Tadhunter (2016) Tadhunter C., 2016, A&ARv, 24, 10
- Tazaki et al. (2013) Tazaki F., Ueda Y., Terashima Y., Mushotzky R. F., Tombesi F., 2013, ApJ, 772, 38
- Turner et al. (1997) Turner T. J., George I. M., Nandra K., Mushotzky R. F., 1997, ApJS, 113, 23
- Ubertini et al. (2003) Ubertini P., et al., 2003, A&A, 411, L131
- Ueda et al. (2007) Ueda Y., et al., 2007, ApJ, 664, L79
- Urry & Padovani (1995) Urry C. M., Padovani P., 1995, PASP, 107, 803
- Ursini et al. (2018a) Ursini F., Bassani L., Panessa F., Bazzano A., Bird A. J., Malizia A., Ubertini P., 2018a, MNRAS, 474, 5684
- Ursini et al. (2018b) Ursini F., et al., 2018b, MNRAS, 478, 2663
- Vasudevan & Fabian (2007) Vasudevan R. V., Fabian A. C., 2007, MNRAS, 381, 1235
- Vasudevan & Fabian (2009) Vasudevan R. V., Fabian A. C., 2009, MNRAS, 392, 1124
- Verner et al. (1996) Verner D. A., Ferland G. J., Korista K. T., Yakovlev D. G., 1996, ApJ, 465, 487
- Véron-Cetty & Véron (2006) Véron-Cetty M.-P., Véron P., 2006, A&A, 455, 773
- Wall & Peacock (1985) Wall J. V., Peacock J. A., 1985, MNRAS, 216, 173
- Walton et al. (2013) Walton D. J., Nardini E., Fabian A. C., Gallo L. C., Reis R. C., 2013, MNRAS, 428, 2901
- Weżgowiec et al. (2016) Weżgowiec M., Jamrozy M., Mack K.-H., 2016, Acta Astron., 66, 85
- Willott et al. (1999) Willott C. J., Rawlings S., Blundell K. M., Lacy M., 1999, MNRAS, 309, 1017
- Winter et al. (2008) Winter L. M., Mushotzky R. F., Tueller J., Markwardt C., 2008, ApJ, 674, 686
- Wozniak et al. (1998) Wozniak P. R., Zdziarski A. A., Smith D., Madejski G. M., Johnson W. N., 1998, MNRAS, 299, 449
- Zdziarski et al. (2015) Zdziarski A. A., Sikora M., Pjanka P., Tchekhovskoy A., 2015, MNRAS, 451, 927
- van Velzen & Falcke (2013) van Velzen S., Falcke H., 2013, A&A, 557, L7
- van Velzen et al. (2015) van Velzen S., Falcke H., Körding E., 2015, MNRAS, 446, 2985