Single-cell bacterial electrophysiology reveals mechanisms of stress induced damage
Abstract
Electrochemical gradient of protons, or proton motive force (PMF), is at the basis of bacterial energetics. It powers vital cellular processes and defines the physiological state of the cell. Here we use an electric circuit analogy of an Escherichia coli cell to mathematically describe the relationship between bacterial PMF, electric properties of the cell membrane and catabolism. We combine the analogy with the use of bacterial flagellar motor as a single-cell ”voltmeter” to measure cellular PMF in varied and dynamic external environments, for example, under different stresses. We find that butanol acts as an ionophore, and functionally characterise membrane damage caused by the light of shorter wavelengths. Our approach coalesces non-invasive and fast single-cell voltmeter with a well-defined mathematical framework to enable quantitative bacterial electrophysiology.
keywords:
bacterial energetics, proton motive force, bacterial membrane damage, single-cell measurements, bacterial physiology, indole, butanol, photodamageIntroduction
To stay alive bacteria, like other cells, maintain adequate supplies of free energy, and under various external stresses attempt to stay viable by distributing it to processes essential for coping with the challenge, while simultaneously maintaining core cellular functions. The two main sources of free energy in living cells are adenosine triphosphate (ATP) molecule and proton motive force (PMF). The ATP molecule is the energy ”currency” of living organisms used for biosynthesis and transport. The PMF is a direct consequence of the activity of the electron transport chain or substrate level phosphorylation, and serves as the energy source driving numerous cellular processes: ATP production, motility and active membrane transport. The two are interlinked, ordinarily PMF is used to synthesise ATP, but ATP can drive the production of PMF as well (Keis et al.,, 2006).
As early as 1791 Luigi Galvani proposed that life processes generate electricity (Galvani,, 1791; Green,, 1953). However, it took more than a century for Hugo Fricke to measure the capacitance of biological membrane (Fricke,, 1923) and for Peter Mitchell to explain that PMF is an electrochemical gradient of protons across the membrane that powers the production of ATP (Mitchell,, 1961). PMF consists of the two components: pH difference between cytoplasm and the external environment (), and the electrical potential across the membrane (, we note that the build up of charge occurs at nm-thin layer close to the biological membrane (Nelson,, 2003)).
| (1) |
where is the Boltzmann constant, is the temperature and is the elementary charge.
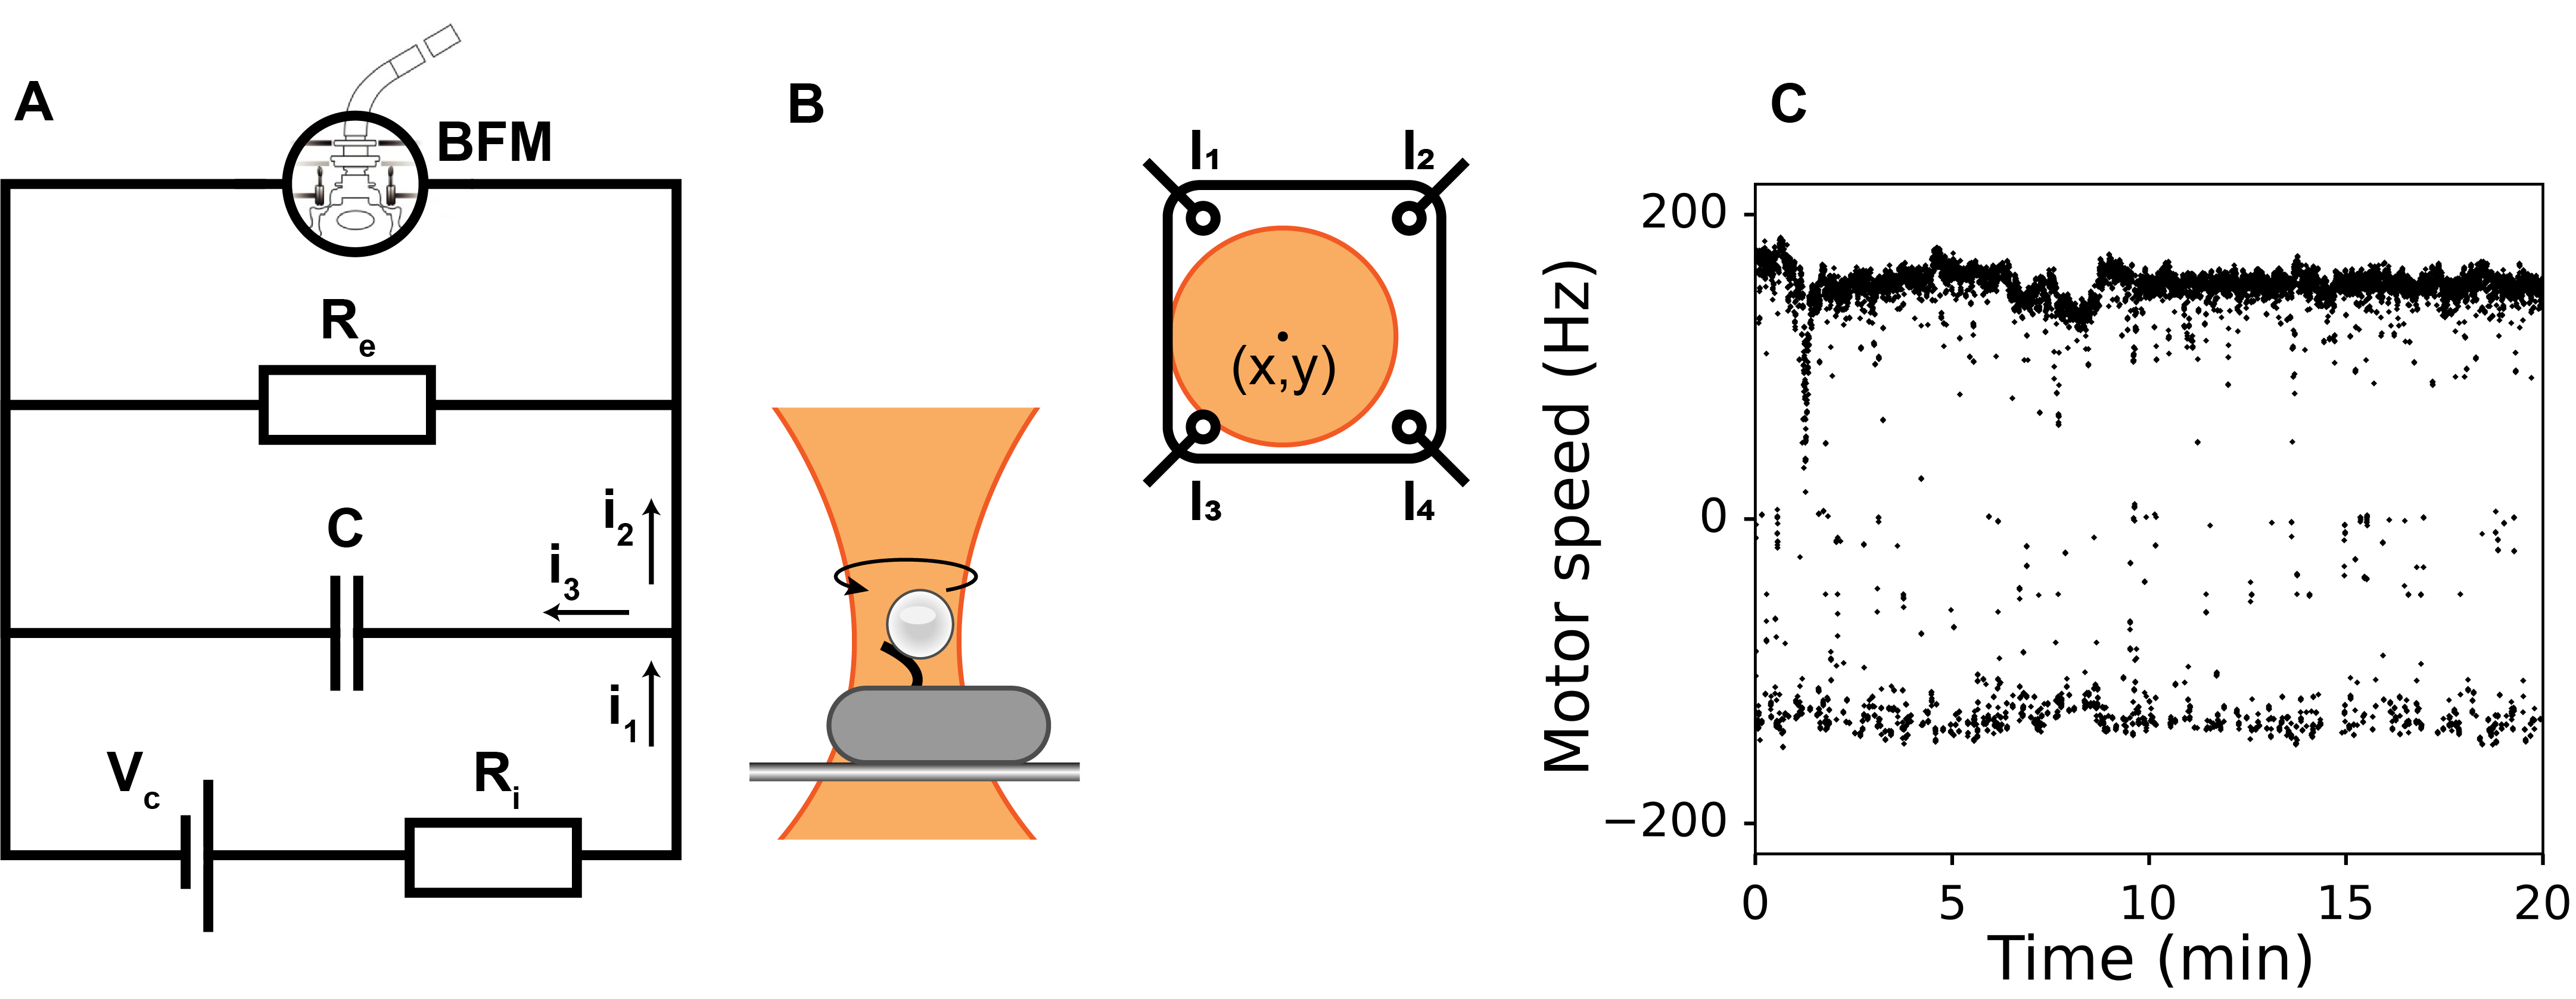
Since life generates electricity used to power its processes and cell membrane acts as a capacitor, it is reasonable to represent the rest of the cell components with an electrical circuit analogy (Van Rotterdam et al.,, 2002; Walter et al.,, 2007), Fig. 1A. Then, proton fluxes are currents, oxidative or substrate-level phosphorylation can be considered as an imperfect battery with non-zero internal resistance, and the membrane resistance and capacitance are connected in parallel. If external pH equals that of the bacterial cytoplasm, and for Escherichia coli the latter is known (Slonczewski et al.,, 1981; Zilberstein et al.,, 1984; Wilks and Slonczewski,, 2007), in the circuit equals the PMF.
The circuit analogy in Fig. 1A gives a mathematical framework that helps us understand cellular free energy maintenance in a range of different conditions. For example, we can predict changes in when circuit parameters change: a battery depends on the available carbon source and internal resistance Ri increases in presence of electron transport chain inhibitors (such as sodium azide (Noumi et al.,, 1987)). Furthermore, if we could measure with an equivalent of a ”voltmeter” we could predict the mechanism and dynamics of the damage as the cells are exposed to various external stresses, as well as obtain functional dependence between affected circuit parameters and the amplitude of the stress.
Here we report the use of bacterial flagellar motor as such a ”voltmeter” and reveal the mechanisms of damage caused by chosen stresses. We confirm the behaviour of a known ionophore (indole) (Chimerel et al.,, 2012), discover that butanol is an ionophore, and quantitatively describe the nature of damage caused by the light of shorter wavelengths. Our approach of combining high-precision PMF () measurements and the ”electrical circuit interpretation” of the cell serves as a powerful tool needed for quantitative bacterial electrophysiology.
Materials and Methods
E. coli strains
E. coli EK07 strain is constructed as described in Supplementary Materials. Highly motile E. coli strain MG1655 with an insertion sequence element in the flhD operon (Barker et al.,, 2004) is modified to have fliC gene replaced by fliCsticky (Kuwajima,, 1988), which produces flagellar filaments that stick to glass or polystyrene surfaces. Additionally, pHluorin (Miesenböck et al.,, 1998; Morimoto et al.,, 2011) gene under strong constitutive Vibrio harveyi cytochrome C oxidase promoter (Pilizota and Shaevitz,, 2012) is placed onto attTn7 site of the chromosome. All the chromosomal alterations are generated using plasmid mediated gene replacement technique (Link and Phillips,, 1997).
E. coli growth and media
EK07 cells are grown in Lysogeny broth (LB: 10 g tryptone, 5 g yeast extract, 10 g NaCl per 1 L) after diluting from the overnight culture as 1:2000, at 37°C with shaking (220 rpm) to OD=2.0 (Spectronic 200E Spectrophotometer, Thermo Scientific, UK). We found that the yield of the single motor experiment, which is defined as the number of spinning beads in the field of view and likely corresponding to the flagellar motor expression level, was maximised at this OD in agreement with (Amsler et al.,, 1993). Growth curves of the EK07 and the parent MG1655 strain are given in SI Fig. 1. After growth cells are washed (3 times by centrifugation at 8000 g for 2 min) into MM9 (aqueous solution of 50 mM Na2HPO4, 25 mM NaH2PO4, 8.5 mM NaCl and 18.7 mM NH4Cl with added 0.1 mM CaCl2, 1 mM KCl, 2 mM MgSO4 and 0.3% D-glucose) adjusted to pH=7.5 or PBS (aqueous solution of 154 mM NaCl, 5 mM Na2HPO4 and 1.5 mM KH2PO4) adjusted to pH=7.5. Indole treatment is performed in MM9 and butanol and photodamage experiments in MM9 and PBS.
Microscope slides preparation
To shorten flagella, cells are ”sheared” as described previously (Bai et al.,, 2010; Rosko et al.,, 2017) and washed as above. For butanol and indole treatment tunnel-slides are prepared as before (Rosko et al.,, 2017), see also SI Fig. 2A). For photodamage experiments flow-cells are manufactured by drilling (AcerDent, UK) two 1.8 mm holes on opposite ends of the microscope slide and attaching Tygon® Microbore tubing (Saint Gobain Performance Plastics, France). The flow-cell is then created by attaching gene frame (Fisher Scientific Ltd, USA) to the slide and covering it with a cover glass (SI Fig. 2B). Surface of the cover slide is coated with 0.1% poly-L-lysine (PLL) by flushing PLL through the flow-cell/tunnel-slide for 10 s followed by washing it out with the excessive volume of growth medium. Sheared and washed cells are then loaded into the flow-cell/tunnel-slide and incubated for 10 min to allow attachment. Excessive cells are washed out with the growth medium. Subsequently, 0.5 m in diameter polystyrene beads (Polysciences, Inc, USA) are added to the flow-cell/tunnel-slide and incubated for 10 min with consequent washing out of the non-attached beads.
Microscopy and data collection
Back-focal-plane interferometry (Denk and Webb,, 1990; Svoboda et al.,, 1993) is performed as previously described (Rosko et al.,, 2017). Briefly, heavily attenuated optical trap (855 nm laser) is used to detect the rotation of a polystyrene bead attached to a truncated flagellar filament (Fig. 1B). Time course of the bead rotation is recorded with the position-sensitive detector (PSD Model 2931, New Focus, USA) at 10 kHz, and a 2.5 kHz cutoff anti-aliasing filter applied before processing (Fig. 1B). Bead position (x,y) is calculated from photocurrents as and , where L is the PSD detector side length.
Fluorescent images of pH sensitive pHluorin are taken in the same custom-built microscope with iXon Ultra EMCCD camera (Andor, UK). OptoLED Dual (Cairn Research Ltd, UK) independently driving two LEDs is used for the illumination. Narrow spectrum UV LED is used for excitation at 395 nm and Neutral White LED with ET470/40x filter (Chroma Technology, USA) for 475 nm excitation. Emission is taken at 520 nm using ET525/40x filter (Chroma Technology, USA). Exposure time is fixed at 50 ms for butanol and indole treatment experiments and varies from 10 to 200 ms for photodamage experiments.
Applying stresses
Butanol (1-Butanol for molecular biology, 99%, Sigma-Aldrich, USA) and indole (Indole, analytical standard, Sigma-Aldrich, USA) treatment is performed as follows: after recording the motor speed for 2 min, 20 l of MM9 (or PBS) supplemented with a given concentration of butanol or indole is flushed into the tunnel-slide. Flush is done by placing a droplet of liquid on one, and collecting it with a piece of tissue paper on the other side of the tunnel (Buda et al.,, 2016). Duration of the flush is no longer than 10 s. 10 l droplets of shocking solution are then placed on both side of the tunnel to minimise evaporation. The shock motor speed is recorded for 10 min, followed by a flush back into MM9 (or PBS) medium. Postshock speed is recorded for 5 min. The motor speed recording is uninterrupted for the duration of the experiment (total of 17 min). For pH control experiments fluorescent images are taken every 90 seconds. Control flushes with media containing no indole/butanol are shown in SI Fig. 3.
Photodamage experiments are performed as follows: using the flow-cell MM9 or PBS is constantly supplied at 10 l/min rate with a syringe pump (Fusion 400, Chemyx Inc., USA). Cells are sequentially exposed to the light of =395 nm and 475 nm. Speed recording starts simultaneously with the light exposure. The camera exposure time () and sampling rate are controlled with a custom written LabView program. are set the same for both wavelengths, however hardware adds a different delay, thus effective light exposure times are 225 ms+ for 475 nm and 55 ms+ for 395 nm. We record and sampling rate throughout the experiment to calculate the effective light power () as the total energy delivered, divided by the total length of the individual motor speed recording. Total energy delivered is estimated by measuring the illumination power in the sample plane multiplied by the total time of light exposure and divided by the illumination area. We measured the illumination area by photobleaching part of the slide and measuring the diameter of the bleached region (d 220 m). Control speed traces with no light exposure are shown in SI Fig. 4.
Data analysis
A flat-top window discrete Fourier transform (window size=16384 data points with 0.01 s) is applied to and coordinates of bead position to obtain a time series motor speed record. This speed records we refer to as raw speed traces (Fig. 1C, 2A, 3A, 4A, SI Fig. 3, 4, 7, 8). Raw traces are further processed as follows: (a) absolute values are taken, (b) values below 10 Hz are removed and 50 Hz AC frequency values disregarded, (c) remaining data points are median filtered with 201 points moving window. To calculate mean speeds we apply a 10 s moving window on the speed traces processed as above. In addition to above, photodamage traces are normalised. First, 30 s of the trace is split into 60 windows containing 50 points each. The mean of maximum values found within each window is calculated and considered the initial speed value, by which the rest of the trace is normalised. Each normalised trace is fitted with a single parameter exponential: . For Fig. 2D and 3D hyperbolic function fitted is and quadratic hyperbolic , where K is a fitting parameter. All fittings are performed in Python (SciPy module, curve fit optimization) with maximum number of calls to the optimization function taken as 20 000.
Results
PMF measurements via flagellar motor speed can be used to analyse stress-induced damage.
The electric circuit analogy (Fig. 1A) gives a mathematical framework needed to understand cellular free energy maintenance in a range of different conditions. For example, under given external stress it allows us to discern the affected component of the cell and predict the mechanism of damage caused by the stress in the following manner. Membrane capacitance is set by the geometry of the lipid bilayer and unlikely to be altered on shorter time scales. is the theoretical maximum potential a cell can generate in a given environment and from a given internalised (carbon) source. Stress can affect only by damaging specific carbon transporters and, thus, is media-dependent. Furthermore, in starvation buffer where E. coli uses internal carbon sources (Nyström and Gustavsson,, 1998) will not be changed by the stress. defines the inefficiency of the catabolism, comprising the drop from as a specific carbon source gets metabolised via a large number of catabolic enzymes. These enzymes are at least partially carbon source specific, thus the stress that targets will be media-dependent. Finally, while the value is growth media-dependent, the membrane targeting stresses that influence will be media-independent.
Once we pin-down the affected component, we employ Kirchoff’s laws to express it as a function of stress-induced membrane potential change (), which we measure using bacterial flagellar motor (BFM) as a ”voltmeter”(Fig. 1A). BFM is a nano-machine that enables bacterial swimming (Sowa and Berry,, 2008) via PMF powered rotation (Manson et al.,, 1980; Matsuura et al.,, 1977; Meister et al.,, 1987; Fung and Berg,, 1995). The motor speed (), usually reaching couple of hundred Hz (Lowe et al.,, 1987), varies linearly with PMF (Fung and Berg,, 1995; Gabel and Berg,, 2003). While BFM can be actively slowed down, e.g. when cell enter stationary phase (Amsler et al.,, 1993), on shorter time scales the linearity between the motor speed and PMF allows us to use the motor speed as a PMF indicator, and when as a indicator as well. Here we consider only the situation where , which we set by adjusting the external pH to known internal pH of E. coli (Slonczewski et al.,, 1981), and in the rest of the text use PMF and interchangeably. In addition, EK07 strain we constructed (see Materials and Methods) carries a chromosomal copy of the gene encoding pHluorin protein, which we use to check that our expectation is correct, i.e. cytoplasmic pH during the experiments stays constant and at the level of external pH (SI Fig. 5). We thus have:
| (2a) |
| (2b) |
where we assumed that changes as a function of stress amplitude and time , is a constant and index 0 denotes the variable value prior to stress. We measure using back-focal-plane interferometry (Svoboda et al.,, 1993) and a polystyrene bead attached to a short filament stub (see Materials and Methods and Fig. 1B) (Bai et al.,, 2010). An example trace of BFM speed is given in Fig. 1C. Using equation (2b) and the circuit analogy we can express each circuit component as a function of stress. To do so, we simplify the electric circuit by estimating the constant of the cell membrane. Capacitance and resistance of the bacterial membrane have been reported as C1 F/ (Fricke et al.,, 1956; Hodgkin et al.,, 1952) and R10-1000 (Miyamoto and Thompson,, 1967; Chimerel et al.,, 2012), which gives in the range of to s. Thus, the current through the capacitor is zero prior to the stress application (when the system is in steady-state), as well as post stress application when (i.e. on the time scales of our experiment). Next we consider G of NADH oxidation only, and compute that respiratory chain can produce -360 mV (Walter et al.,, 2007). Yet, physiological value of the membrane potential of respiring bacteria is approximately equal to -160 mV (Tran and Unden,, 1998), indicating that roughly half of the membrane potential drops at the internal resistance, i.e. . Taking the two simplifications into account we arrive to (see Fig. 1A and Supplementary Material for detailed deduction of equations):
| (3a) |
| (3b) |
| (3c) |
PMF dynamics analysis confirms indole is an ionophore
We test the proposed circuit analogy and applicability of the BFM speed as the voltmeter by applying a known membrane stress. We choose a cell signaling molecule indole that at millimolar concentrations forms a dimer and acts as an ionophore (Chimerel et al.,, 2012). Ionophores are molecules that carry ions across the lipid bilayer, thus we expect the membrane resistance to decrease (ion conductance increases) when indole is present in the medium. Furthermore, we expect to recover previously demonstrated parabolic dependence of membrane conductance on indole concentration (Chimerel et al.,, 2012).
Fig. 2A shows examples of individual motor speed recordings prior, during and post treatment with a given concentration of indole. Motor speed drops immediately with the addition of indole, and stays at approximately the same level until indole is removed, at which point it recovers to the initial level. The speed change caused by indole is faster than 10 ms (our experimental resolution), confirming the estimate of membrane RC constant, and justifying the assumption that the current through the capacitance in Fig. 1A circuit is negligible.
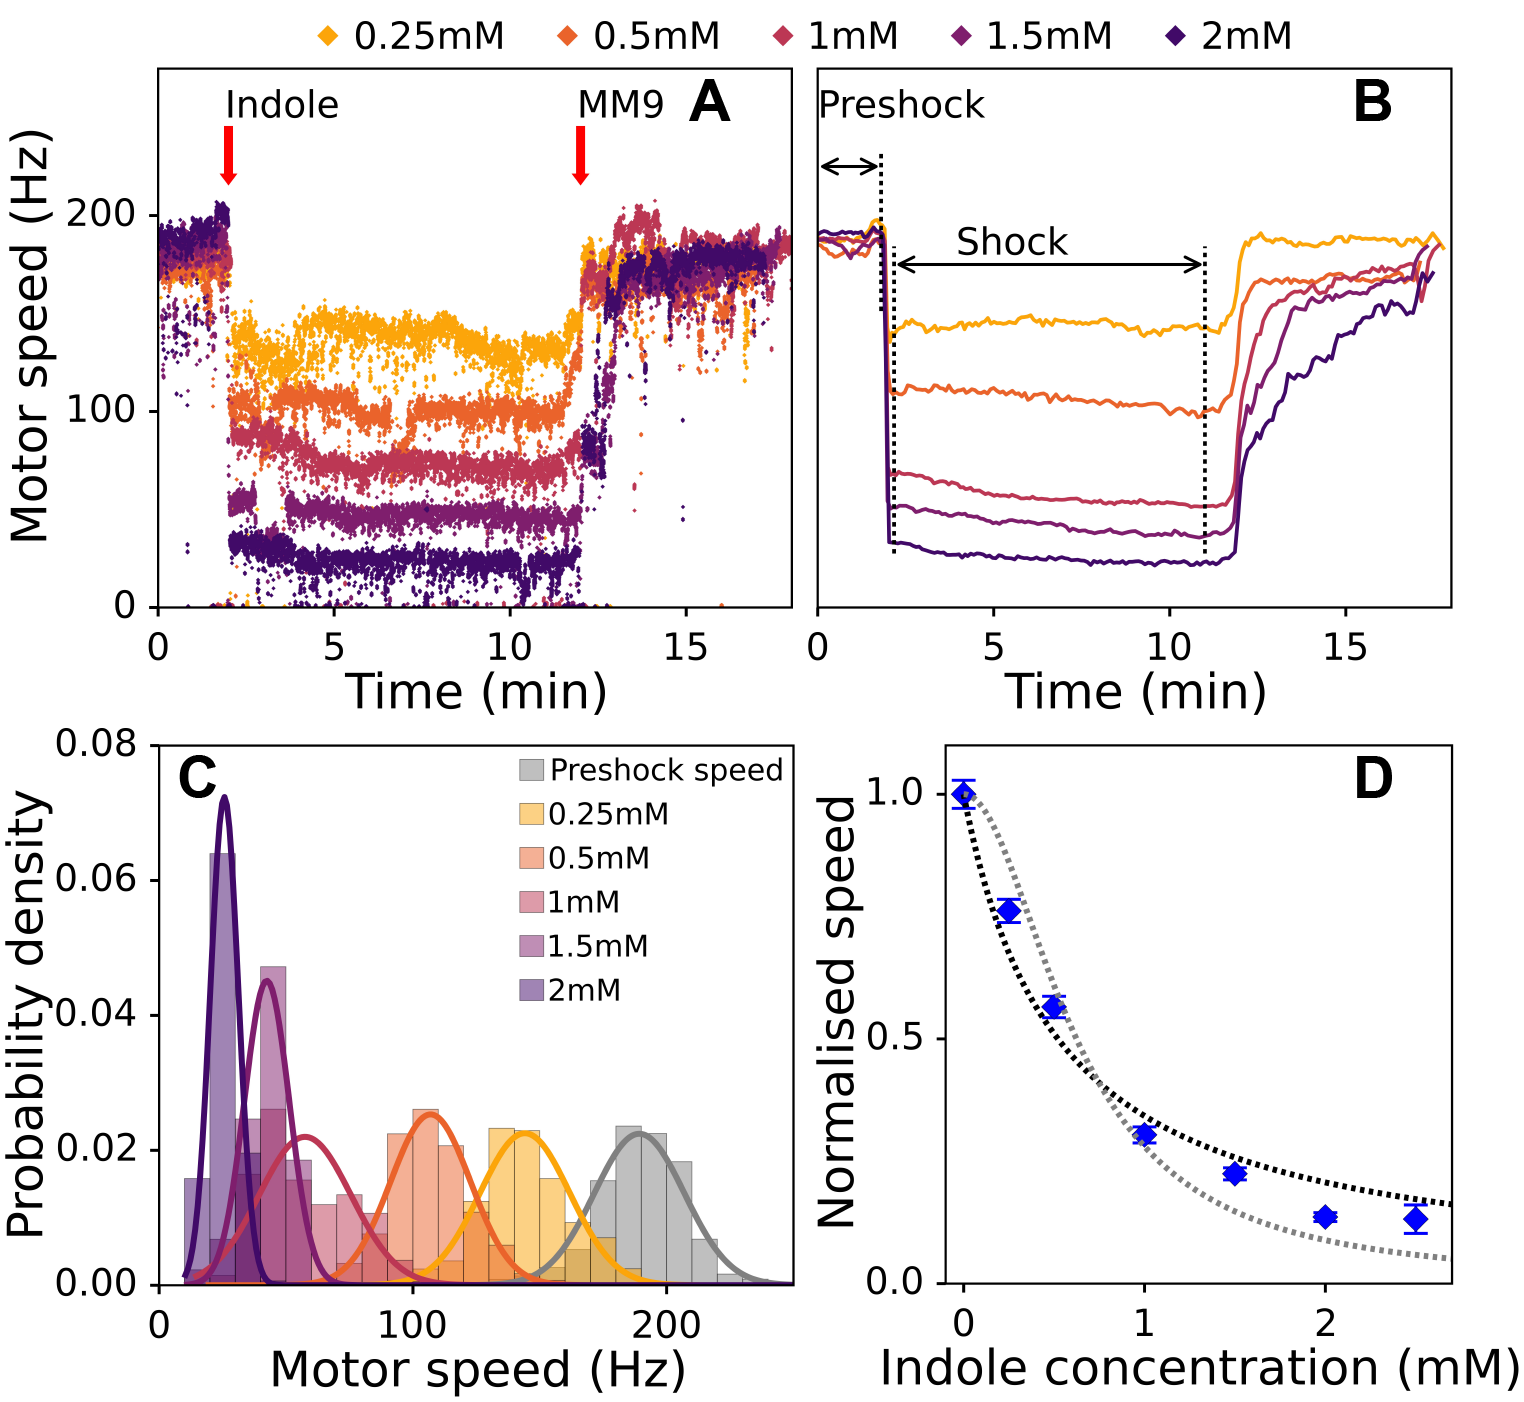
To confirm the dependence of the membrane resistance on indole we find the relative change in motor speed at a given stress concentration. Fig. 2B shows the mean speed traces for different indole concentrations (see Materials and Methods for mean speed calculation) and in Fig. 2C we plot the probability densities of preshock and shock speeds. From the Gaussian fits to preshock and shock speed distributions we obtain mean shock speeds for a given indole concentration, and plot them normalised to the preshock speed, Fig. 2D. We fit the normalised speeds with hyperbolic or quadratic hyperbolic function (see Materials and Methods, both of which yield good quality fits with higher than 0.90). The concentrations of indole at which the quadratic dependence becomes particularly obvious are higher than 2.5 mM (Chimerel et al.,, 2012), where we use 0-2.5 mM range. Therefore, our result confirms the accuracy of our proposed approach.
Butanol acts as an ionophore, changing membrane conductance linearly with concentration.
To determine the mechanism of action of an unknown stress we choose butanol. Previous work indicates that butanol interacts with cell membrane and weakens it, but the exact mechanism of cell damage is unknown (Fletcher et al.,, 2016). We perform the BFM speed measurements in E. coli cells treated with butanol. The experimental protocol of butanol delivery is the same as for indole. Fig. 3A and 3B show examples of raw traces and mean speed traces prior, during and post butanol shock in MM9. Immediately upon butanol stress motor speed drops, and upon butanol removal it recovers to the initial value, Fig. 3A. Motor speed distributions at a given butanol concentrations remain narrow, and we fit them with Gaussian curves (Fig. 3C). Fig. 3D shows normalised motor speeds, calculated as mean values of the distributions given in Fig. 3C, and plotted against butanol concentration for both MM9 media and PBS.
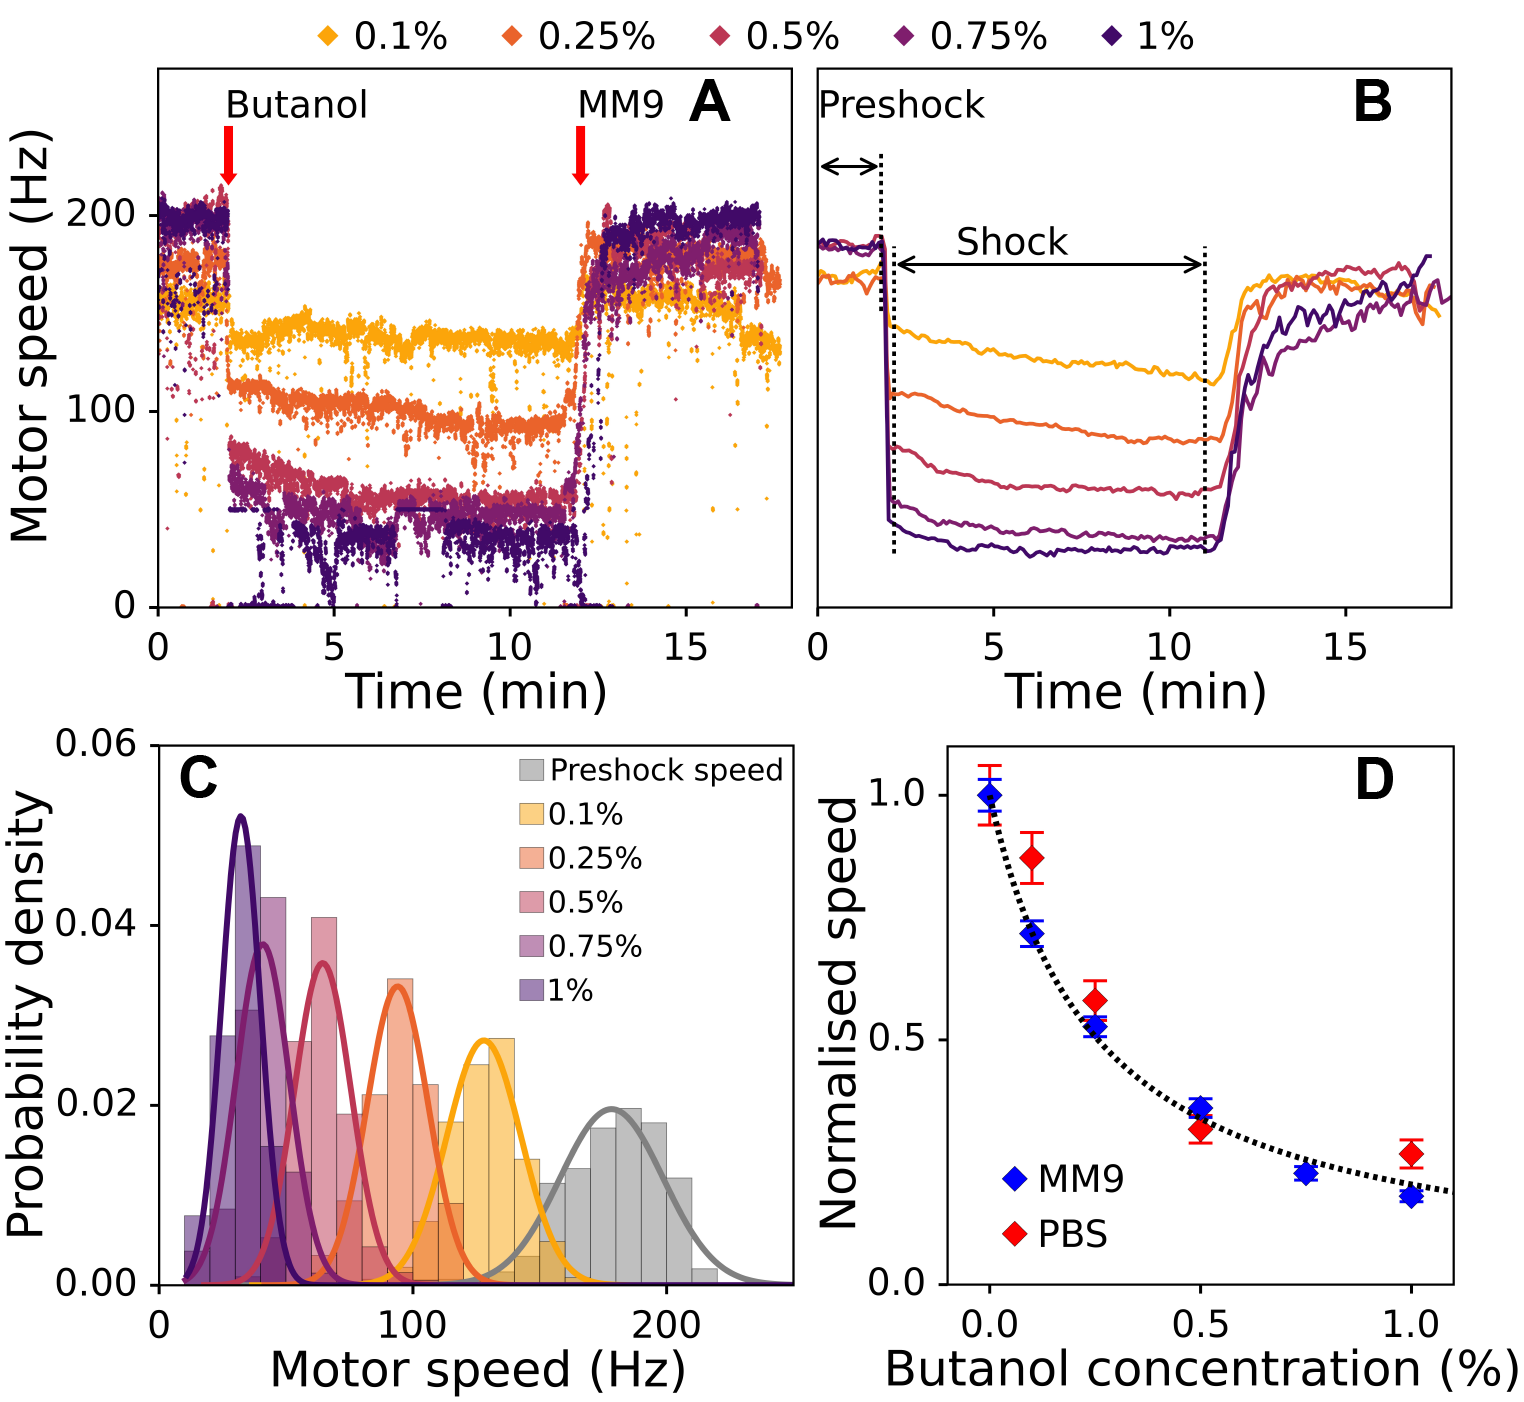
The relative speed drop observed in the presence of butanol is media independent, and alike that observed for indole. The finding suggesting that, on the time scale of our experiment, butanol cause non-permanent membrane damage and acts as an ionophore. The normalised motor speed dependence on butanol concentration is hyperbolic, and we obtain equation (3c) for membrane resistance:
| (4) |
where is a butanol concentration in percents (%) and 7.8 is a value of constant obtained from the hyperbolic fit (see Materials and Methods). We observe the speed restoration after butanol removal even after multiple treatments of the same cell. SI Fig. 7 shows several consecutive butanol stresses each lasting 60 s (A) or 30 s (B), where after each treatment motor speed is fully restored.
Photodamage increases membrane conductance that scales with the light power.
As an example of a complex stress we next choose to characterise light induced damage. While previous reports indicate that light causes wavelength dependent damage to bacterial cells (Ashkin et al.,, 1987; Neuman et al.,, 1999), they also suggest that the nature of damage is complex. Most likely the cause of the damage is formation of reactive oxygen species (ROS) (de Jager et al.,, 2017; Lockwood et al.,, 2005), which have been shown to perturb multiple components of the cell: DNA, RNA, proteins and lipids (Cabiscol et al.,, 2000; Zhao and Drlica,, 2014). To apply light of a certain wavelength and intensity to bacterial cells we use a flow-cell (see Materials and Methods). During the light exposure cells are continuously supplied with fresh media at 10 l/min flow rate. We apply the light of 395 nm and 475 nm wavelengths as the choice allows us to simultaneously measure internal pH of bacteria.
Fig. 4A shows example BFM speed traces during exposure to light of different effective powers () delivered to the cells. is calculated as the total energy delivered divided by the total time the light is on (see Materials and Methods). Fig. 4A shows that BFM speed gradually decreases in time during exposure to light and that the decrease rate scales with the , also visible in Fig. 4B showing mean BFM speed traces for the same four effective powers.
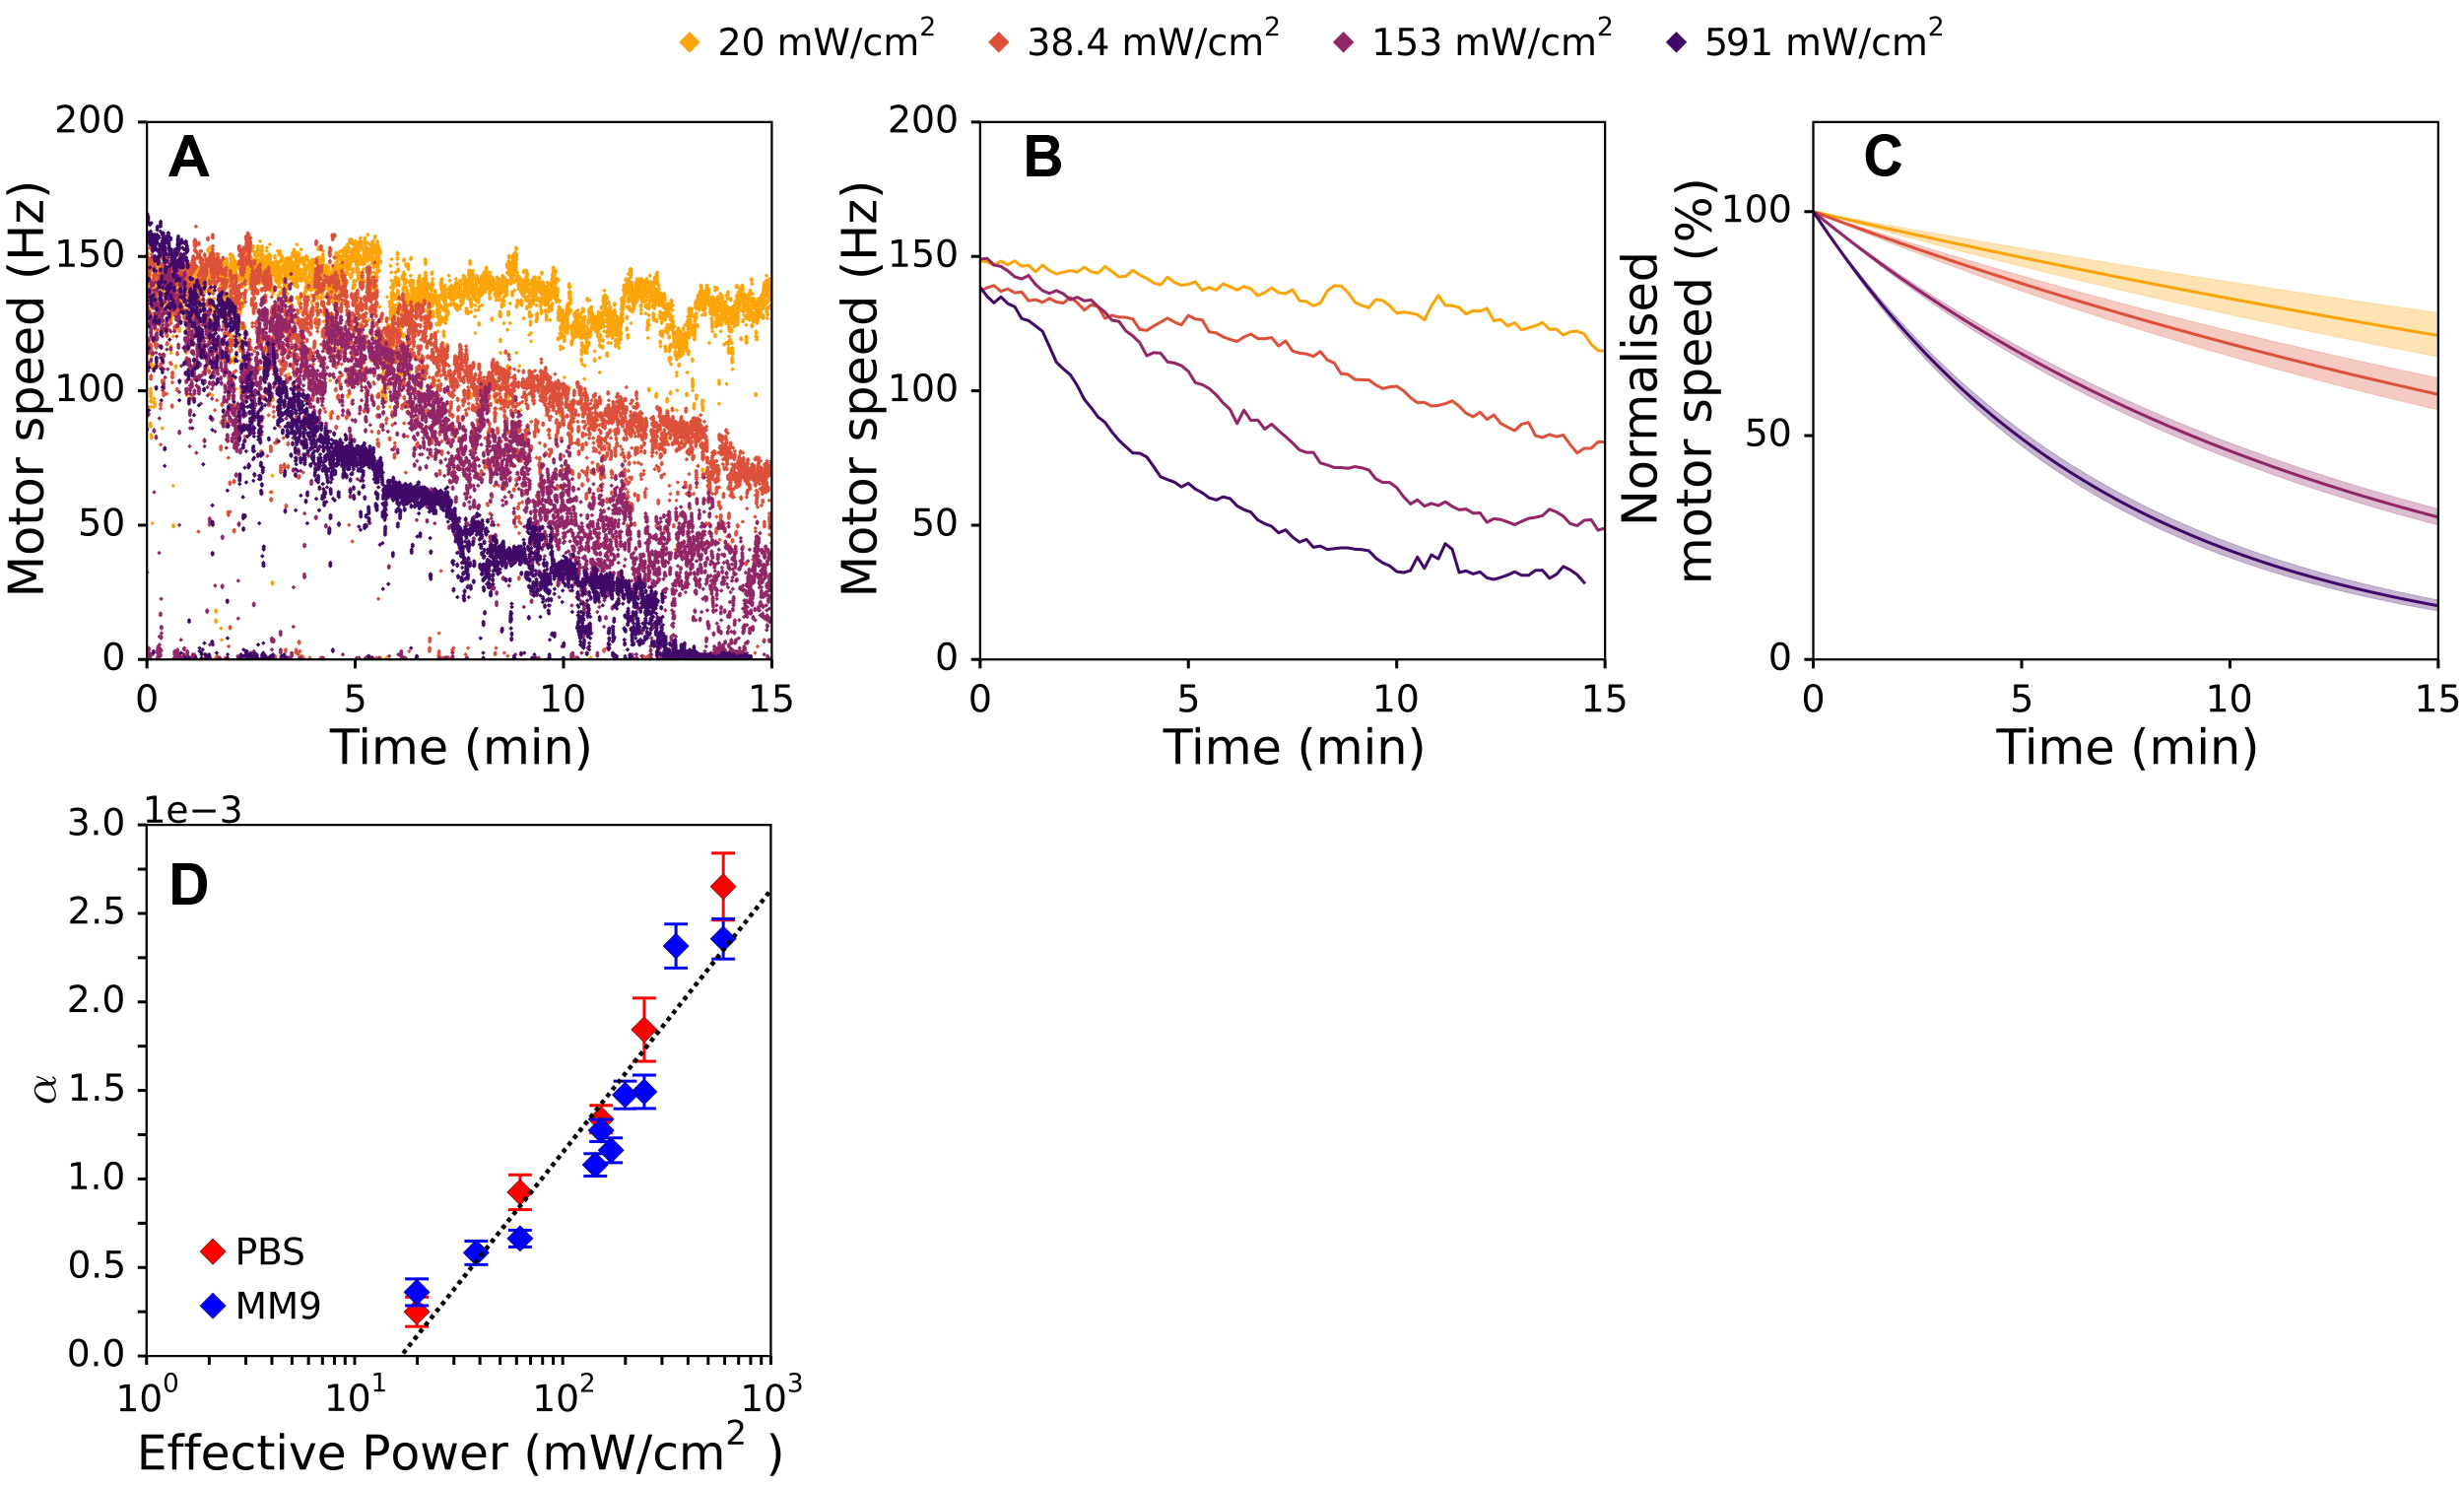
To identify the functional dependence of the speed decrease rate on we fit individual normalised traces with the simple exponential function: , with the single fitting parameter . Mean of the fits with standard errors at corresponding four different powers are shown in Fig. 4C, and Fig. 4D shows fit coefficient plotted against the light power for both MM9 medium and PBS. The effect of light on is present in PBS and of same functional dependence, thus on the time scales of our experiment light affects primarily the membrane resistance, . Together with the fact that the speed decrease rates stay the same at a given , the finding suggests that on the time scale of our experiment there is no active membrane repair. We further confirm this by measuring the motor speed after we expose the cells to light for shorter periods of time. SI Fig. 8 shows that when the illumination ceases after 5 or 15 min the (decreased) BFM speed remains the same with no visible recovery. We also check that light damage is not enhanced by the presence of the fluorescent protein (pHluorin) in the cytoplasm, SI Fig. 9.
Fig. 4D enables us to determine functional relationship between effective power and , which increases as a logarithm of the normalised , i.e. . Thus, for our initial exponential fit we obtain:
| (5) |
where and are wavelength specific parameters, = 0.00064 and = -0.00181 and equation (5) holds for .
The minimum power required for the damage to occur is defined as , and for 395 nm and 475 nm this is 17 mW/. Re-writing the equation (5) in terms of we get:
| (6) |
| (7) |
where is the fit coefficient in Fig. 4D.
Discussion
Arguably, one of the defining features of life is its ability to avoid thermodynamic equilibrium (death) by achieving a steady state supply of free energy. Chemiosmotic theory explained that the production of life’s energy currency, the ATP molecule, proceeds via the generation of trans-membrane electrochemical potential. The ability to measure and control voltage and current across the cellular membrane with the patch-clamp technique had far reaching consequences for our understanding of cells such as neurones, where the electrical inputs govern signal transmission (Hodgkin et al.,, 1952). In the cases of bacteria, and their small size, we are unable to gain the same level of control over these parameters (Ruthe and Adler,, 1985; Martinac et al.,, 1987), despite the fact that the ability to do so would open a range of currently inaccessible questions that are at the basis of bacterial free energy maintenance, and consequently, survival.
Here we demonstrate the use of BFM as a fast voltmeter, enabling quantitative, in vivo studies of electrochemical properties of the bacterial membrane. Alternative methods for measuring in E. coli rely on fluorescent readout (Ehrenberg et al.,, 1988; Prindle et al.,, 2015; Kralj et al.,, 2011). However, Nernstian dyes (Ehrenberg et al.,, 1988; Prindle et al.,, 2015) sometimes fail to penetrate E. coli’s membrane (Lo et al.,, 2007), can be a substrate for the outer membrane efflux system TolC (Mancini et al.,, 2018) and in external conditions where they do equilibrate across the membrane, they do so on the time scales of minutes (Lo et al.,, 2007; te Winkel et al.,, 2016). Voltage sensitive membrane proteins that can be used in E. coli require delivery of light of high power (Kralj et al.,, 2011). BFM, on the other hand, is native to E. coli and expressed in a range of conditions (Cremer et al.,, 2018). Speed measurements via back-focal-plane interferometry or fast cameras do not rely on fluorescent illumination and offer high time resolution (up to 0.5 ms (Pilizota et al.,, 2007)). We choose to work with cells grown into late exponential phase in LB to maximise our experimental yield. The approach is, however, more widely applicable as BFM is expressed in a range of other conditions (with the exception of late stationary phase cells (Amsler et al.,, 1993; Cremer et al.,, 2018)), where we expect the BFM bead-assay yield to somewhat vary with the condition. It is possible that cells grown to early or mid exponential phase, or cells grown to steady state in different growth media, will have different electrochemical properties, which can be measured with our approach in the future.
We choose to work in the conditions that satisfy pH0, and thus is the only contribution to the PMF. However, BFM speed measurements can be extended to conditions where pH contribution to the PMF is not negligible, in this case will be calculated from equation (1). Extending the use of BFM as the voltmeter for long term measurements (into hours and days) is possible. We note that on longer time scales motor can be actively slowed down via YcgR protein (Boehm et al.,, 2010; Paul et al.,, 2010), and such long term measurements would likely require YcgR deletion background.
We base the use of BFM as the cell’s voltmeter on the proportionality between motor speed and PMF, measured first more than 20 years ago (Fung and Berg,, 1995; Gabel and Berg,, 2003). Recent experiments show that BFM also exhibits mechanosensing (Lele et al.,, 2013; Tipping et al.,, 2013), where stator unit incorporation depends on the motor torque. These recent findings indicate an intriguing control mechanism, where mechanosensing and the ion flux combined result in the characteristic proportional relationship between the BFM speed and PMF. It will be interesting to fully ascertain the exact molecular mechanism behind the PMF-motor speed relationship, and we think the ability to fine-control the PMF loss can contribute to that understanding.
Using the electric circuit analogy for the membrane fluxes, and BFM as the cell’s ”voltmeter” we demonstrate the effect of three different stresses on the cell’s membrane conductance. For the known stress, indole, we confirm it acts as an ionophore. For the first unknown stress we applied, butanol, we show its presence decreases membrane resistance, inversely proportional to the butanol concentration. Thus, we conclude that, in the concentration range we tested and on the 15 min time scale, butanol behaves as an ionophore in a manner similar to indole or CCCP (Chimerel et al.,, 2012). With analysis alike we presented, butanol action can be characterised further, e. g. defining the minimum concentration and incubation time required for the effect to become irreversible. For our last stress, light of short wavelengths, we show that it affects membrane resistance and functionally describe the damage in relation to time and . Light-induced changes in membrane permeability have been reported in artificial planar lipid bilayer systems and liposomes in the presence of photosensitisers (McRae et al.,, 1985; Pashkovskaya et al.,, 2010; Kotova et al.,, 2011; Wong-Ekkabut et al.,, 2007). The most likely cause of such changes is ROS induced chain-reaction lipid peroxidation (Girotti,, 1985, 1990; Halliwell et al.,, 1993; Heck et al.,, 2003; Lavi et al.,, 2010). Presence of peroxidised lipids can change bilayer physical and electrical properties (Dobretsov et al.,, 1977; Richter,, 1987; Birben et al.,, 2012), e.g. it has been suggested that it induces formation of hydrophobic pre-pores and their later transformation into hydrophilic pores permeable to ions (Kotova et al.,, 2011; Wong-Ekkabut et al.,, 2007). Based on the previous work, and our real time, in vivo measurements we propose the following model for the complex nature of the light-induced membrane damage. Exposure to light causes the formation of ROS that induce lipid peroxidation, and thus alter the electric properties of the membrane. In particular, its permeability to ions due to the formation of hydrophilic pores. In contrast to the ionophores that carry ions across the membrane without causing membrane damage, the drop in we observe under light proceeds as a result of slower, multi-step formation of lipid pores that require active repair to be mitigated. Therefore, we do not see any fast recovery after illumination ceases (SI Fig. 8), and the chain-reaction nature of the process results in the exponential-like decay of membrane potential.
Living cells have built-in mechanisms of coping with oxidative stress, for example SoxRS/OxyR regulons containing multiple antioxidant-encoding genes, such as sodA (manganese superoxide dismutase) or katG (hydroperoxidase I) (Storz and Imlayt,, 1999; Birben et al.,, 2012). The existence of defence mechanisms explains the occurrence of the minimum power required to cause the damage. Less power, even if it causes ROS formation, will not damage the cells that cope using internal protection enzymes. The value of the minimal damage-causing power we measured can indicate the abundance of internal protective resources available to the cell, as well as define the power range for fluorescence imaging that should be used to ensures no (unaccounted for) damage is inflicted to the cells by the exposure to light.
Future applications of our approach include, but are not limited to, studying other damage mechanisms and characterising unknown bacterial membrane properties, e. g. overall resistance in different growth conditions. Lastly, based on our measurements we suggest the use of light for delivery of small molecules, such as antimicrobial peptides or fluorescent dyes, which otherwise fail to penetrate E. coli’s membrane (Lo et al.,, 2007).
Author Contributions
EK, CJL and TP designed research. EK performed research and analysed data. EK, CJL and TP interpreted results and wrote the paper.
Acknowledgements
We thank all the members of Pilizota and Lo laboratories, Zaki Leghtas, Jelena Baranovic, Bai Fan, Peter Swain, Ivan Maryshev, Ivan Erofeev, Calin Guet and Munehiro Assaly for useful discussions. EK was supported by the Global Research and Principal’s Career Development PhD Scholarships. TP and CJL were supported by the Human Frontier Science Program Grant (RGP0041/2015), and CJL by the Ministry of Science and Technology, Republic of China (MOST-106-2112-M-008-023).
References
- Amsler et al., (1993) Amsler, C. D., Cho, M., and Matsumura, P. (1993). Multiple factors underlying the maximum motility of Escherichia coli as cultures enter post-exponential growth. Journal of Bacteriology, 175(19):6238–6244.
- Ashkin et al., (1987) Ashkin, A., Dziedzic, J. M., and Yamane, T. (1987). Optical trapping and manipulation of single cells using infrared laser beams. Nature, 330(6150):769–771.
- Bai et al., (2010) Bai, F., Branch, R. W., Nicolau, D. V., Pilizota, T., Steel, B. C., Maini, P. K., and Berry, R. M. (2010). Conformational spread as a mechanism for cooperativity in the bacterial flagellar switch. Science, 327(5966):685–689.
- Barker et al., (2004) Barker, C. S., Prüß, B. M., and Matsumura, P. (2004). Increased motility of Escherichia coli by insertion sequence element integration into the regulatory region of the flhD operon. Journal of Bacteriology, 186(22):7529–7537.
- Berg and Turner, (1993) Berg, H. C. and Turner, L. (1993). Torque generated by the flagellar motor of Escherichia coli. Biophysical Journal, 65(5):2201–16.
- Birben et al., (2012) Birben, E., Murat, U., Md, S., Sackesen, C., Erzurum, S., and Kalayci, O. (2012). Oxidative Stress and Antioxidant Defense. World Allergy Organization Journal, 5(1):9–19.
- Boehm et al., (2010) Boehm, A., Kaiser, M., Li, H., Spangler, C., Kasper, C. A., Ackermann, M., Kaever, V., Sourjik, V., Roth, V., and Jenal, U. (2010). Second Messenger-Mediated Adjustment of Bacterial Swimming Velocity. Cell, 141(1):107–116.
- Buda et al., (2016) Buda, R., Liu, Y., Yang, J., Hegde, S., Stevenson, K., Bai, F., and Pilizota, T. (2016). Dynamics of Escherichia coli ’s passive response to a sudden decrease in external osmolarity. Proceedings of the National Academy of Sciences of the United States of America, 113(40):E5838–E5846.
- Cabiscol et al., (2000) Cabiscol, E., Tamarit, J., and Ros, J. (2000). Oxidative stress in bacteria and protein damage by reactive oxygen species. International Microbiology, 3(1):3–8.
- Chimerel et al., (2012) Chimerel, C., Field, C. M., Piñero-Fernandez, S., Keyser, U. F., and Summers, D. K. (2012). Indole prevents Escherichia coli cell division by modulating membrane potential. Biochimica et Biophysica Acta - Biomembranes, 1818(7):1590–1594.
- Cremer et al., (2018) Cremer, J., Honda, T., Tang, Y., Ng, J., Vergassola, M., and Hwa, T. (2018). On the growth and migration of chemotactic bacterial populations in nutrient-replete environments. In preparation.
- de Jager et al., (2017) de Jager, T. L., Cockrell, A. E., and Du Plessis, S. S. (2017). Ultraviolet Light Induced Generation of Reactive Oxygen Species. In Ahmad, S., editor, Ultraviolet Light in Human Health, Diseases and Environment. Advances in Experimental Medicine and Biology, pages 15–23. Springer, Cham.
- Denk and Webb, (1990) Denk, W. and Webb, W. W. (1990). Optical measurement of picometer displacements of transparent microscopic objects. Applied optics, 29(16):2382–2391.
- Dobretsov et al., (1977) Dobretsov, G. E., Borschevskaya, T. A., Petrov, V. A., and Vladimirov, Y. A. (1977). The increase of phospholipid bilayer rigidity after lipid peroxidation. FEBS Letters, 84(1):125–128.
- Ehrenberg et al., (1988) Ehrenberg, B., Montana, V., Wei, M. D., Wuskell, J. P., and Loew, L. M. (1988). Membrane potential can be determined in individual cells from the nernstian distribution of cationic dyes. Biophysical Journal, 53(5):785–794.
- Fletcher et al., (2016) Fletcher, E., Pilizota, T., Davies, P. R., McVey, A., and French, C. E. (2016). Characterization of the effects of n-butanol on the cell envelope of E. coli. Applied Microbiology and Biotechnology, 100(22):9653–9659.
- Fricke, (1923) Fricke, H. (1923). The electric capacity of cell suspension. Physical Review, 21:708–709.
- Fricke et al., (1956) Fricke, H., Schwan, H. P., Li, K., and Bryson, V. (1956). A dielectric study of the low-conductance surface membrane in E. coli. Nature, 177(4499):134–135.
- Fung and Berg, (1995) Fung, D. C. and Berg, H. C. (1995). Powering the flagellar motor of Escherichia coli with an external voltage source. Nature, 375(6534):809–812.
- Gabel and Berg, (2003) Gabel, C. V. and Berg, H. C. (2003). The speed of the flagellar rotary motor of Escherichia coli varies linearly with protonmotive force. Proceedings of the National Academy of Sciences of the United States of America, 100(15):8748–8751.
- Galvani, (1791) Galvani, L. (1791). De viribus electricitatis in motu musculari commentarius. De Bononiensi Scientiarum et Artium Instituto atque Academia Commentarii, tomus septimus., pages 363–418.
- Girotti, (1985) Girotti, A. W. (1985). Mechanisms of lipid peroxidation. Journal of Free Radicals in Biology and Medicine, 1(2):87–95.
- Girotti, (1990) Girotti, A. W. (1990). Photodynamic lipid peroxidation in biological systems. Photochemistry and photobiology, 51(4):497–509.
- Green, (1953) Green, R. M. (1953). A Translation of Luigi Galvani’s De viribus electricitatis in motu musculari commentarius. Commentary on the Effect of Electricity on Muscular Motion. Journal of the American Medical Association, 153(10):989.
- Halliwell et al., (1993) Halliwell, B., Chirico, S., Crawford, M. A., Bjerve, K. S., and Gey, K. F. (1993). Lipid peroxidation: Its mechanism, measurement, and significance. American Journal of Clinical Nutrition, 57(5 SUPPL.):715S–725S.
- Heck et al., (2003) Heck, D. E., Vetrano, A. M., Mariano, T. M., and Laskin, J. D. (2003). UVB light stimulates production of reactive oxygen species: Unexpected role for catalase. Journal of Biological Chemistry, 278(25):22432–22436.
- Hodgkin et al., (1952) Hodgkin, A. L., Huxley, A. F., and Katz, B. (1952). Measurement of current‐voltage relations in the membrane of the giant axon of Loligo. The Journal of Physiology, 116(4):424–448.
- Keis et al., (2006) Keis, S., Stocker, A., Dimroth, P., and Cook, G. M. (2006). Inhibition of ATP hydrolysis by thermoalkaliphilic F1F 0-ATP synthase is controlled by the C terminus of the subunit. Journal of Bacteriology, 188(11):3796–3804.
- Kotova et al., (2011) Kotova, E. A., Kuzevanov, A. V., Pashkovskaya, A. A., and Antonenko, Y. N. (2011). Selective permeabilization of lipid membranes by photodynamic action via formation of hydrophobic defects or pre-pores. Biochimica et Biophysica Acta - Biomembranes, 1808(9):2252–2257.
- Kralj et al., (2011) Kralj, J. M., Hochbaum, D. R., Douglass, A. D., and Cohen, A. E. (2011). Electrical spiking in Escherichia coli probed with a fluorescent voltage-indicating protein. Science, 333(6040):345–348.
- Kuwajima, (1988) Kuwajima, G. (1988). Construction of a minimum-size functional flagellin of Escherichia coli. Journal of Bacteriology, 170(7):3305–3309.
- Lavi et al., (2010) Lavi, R., Shainberg, A., Shneyvays, V., Hochauser, E., Isaac, A., Zinman, T., Friedmann, H., and Lubart, R. (2010). Detailed analysis of reactive oxygen species induced by visible light in various cell types. Lasers in Surgery and Medicine, 42(6):473–480.
- Lele et al., (2013) Lele, P. P., Hosu, B. G., and Berg, H. C. (2013). Dynamics of mechanosensing in the bacterial flagellar motor. Proceedings of the National Academy of Sciences of the United States of America, 110(29):11839–11844.
- Link and Phillips, (1997) Link, A. J. and Phillips, D. (1997). Methods for generating precise deletions and insertions in the genome of wild-type Escherichia coli : application to open reading frame characterization. Journal of Bacteriology, 179(20):6228–6237.
- Lo et al., (2007) Lo, C. J., Leake, M. C., Pilizota, T., and Berry, R. M. (2007). Nonequivalence of membrane voltage and ion-gradient as driving forces for the bacterial flagellar motor at low load. Biophysical Journal, 93(1):294–302.
- Lockwood et al., (2005) Lockwood, D. B., Wataha, J. C., Lewis, J. B., Tseng, W. Y., Messer, R. L. W., and Hsu, S. D. (2005). Blue light generates reactive oxygen species (ROS) differentially in tumor vs. normal epithelial cells. Dental Materials, 21(7):683–688.
- Lowe et al., (1987) Lowe, G., Meister, M., and Berg, H. C. (1987). Rapid rotation of flagellar bundles in swimming bacteria. Nature, 325:637–640.
- Mancini et al., (2018) Mancini, L., Pu, Y., Tian, T., Bai, F., and Pilizota, T. (2018). Membrane voltage dyes: probes or actuators? In preparation.
- Manson et al., (1980) Manson, M. D., Tedesco, P. M., and Berg, H. C. (1980). Energetics of flagellar rotation in bacteria. Journal of Molecular Biology, 138(3):541–561.
- Martinac et al., (1987) Martinac, B., Buechner, M., Delcour, A. H., Adler, J., and Kung, C. (1987). Pressure-sensitive ion channel in Escherichia coli. Proceedings of the National Academy of Sciences of the United States of America, 84(8):2297–2301.
- Martinez et al., (2012) Martinez, K. A., Kitko, R. D., Mershon, J. P., Adcox, H. E., Malek, K. A., Berkmen, M. B., and Slonczewski, J. L. (2012). Cytoplasmic pH response to acid stress in individual cells of Escherichia coli and Bacillus subtilis observed by fluorescence ratio imaging microscopy. Applied and Environmental Microbiology, 78(10):3706–3714.
- Matsuura et al., (1977) Matsuura, S., Shioi, J. i., and Imae, Y. (1977). Motility in Bacillus subtilis driven by an artificial protonmotive force. FEBS Letters, 82(2):187–190.
- McRae et al., (1985) McRae, D. G., Yamamoto, E., and Towers, G. H. (1985). The mode of action of polyacetylene and thiophene photosensitizers on liposome permeability to glucose. Biochimica et Biophysica Acta - Biomembranes, 821(3):488–496.
- Meister et al., (1987) Meister, M., Lowe, G., and Berg, H. C. (1987). The proton flux through the bacterial flagellar motor. Cell, 49(5):643–650.
- Merlin et al., (2002) Merlin, C., Mcateer, S., and Masters, M. (2002). Tools for Characterization of Escherichia coli Genes of Unknown Function. Journal of Bacteriology, 184(16):4573–4581.
- Miesenböck et al., (1998) Miesenböck, G., De Angelis, D. A., and Rothman, J. E. (1998). Visualizing secretion and synaptic transmission with pH-sensitive green fluorescent proteins. Nature, 394(6689):192–195.
- Mitchell, (1961) Mitchell, P. (1961). Coupling of phosphorylation to electron and hydrogen transfer by a chemi-osmotic type of mechanism. Nature, 191(4784):144–148.
- Miyamoto and Thompson, (1967) Miyamoto, V. and Thompson, T. (1967). Some electrical properties of lipid bilayer membranes. Journal of Colloid and Interface Science, 25(1):16–25.
- Morimoto et al., (2011) Morimoto, Y. V., Kojima, S., Namba, K., and Minamino, T. (2011). M153R mutation in a pH-sensitive green fluorescent protein stabilizes its fusion proteins. PLoS ONE, 6(5).
- Nelson, (2003) Nelson, P. C. (2003). Biological Physics: Energy, Information, Life. Freeman, W.H.
- Neuman et al., (1999) Neuman, K. C., Chadd, E. H., Liou, G. F., Bergman, K., and Block, S. M. (1999). Characterization of photodamage to Escherichia coli in optical traps. Biophysical Journal, 77(5):2856–2863.
- Noumi et al., (1987) Noumi, T., Maeda, M., and Futai, M. (1987). Mode of inhibition of sodium azide on H+-ATPase of Escherichia coli. FEBS Letters, 213(2):381–384.
- Nyström and Gustavsson, (1998) Nyström, T. and Gustavsson, N. (1998). Maintenance energy requirement: What is required for stasis survival of Escherichia coli? Biochimica et Biophysica Acta - Bioenergetics, 1365(1-2):225–231.
- Otsu, (1979) Otsu, N. (1979). A Threshold Selection Method from Gray-Level Histograms. IEEE Transactions on Systems, Man, and Cybernetics, 9(1):62–66.
- Pashkovskaya et al., (2010) Pashkovskaya, A., Kotova, E., Zorlu, Y., Dumoulin, F., Ahsen, V., Agapov, I., and Antonenko, Y. (2010). Light-triggered liposomal release: Membrane permeabilization by photodynamic action. Langmuir, 26(8):5725–5733.
- Paul et al., (2010) Paul, K., Nieto, V., Carlquist, W. C., Blair, D. F., and Harshey, R. M. (2010). The c-di-GMP Binding Protein YcgR Controls Flagellar Motor Direction and Speed to Affect Chemotaxis by a ”Backstop Brake” Mechanism. Molecular Cell, 38(1):128–139.
- Pilizota et al., (2007) Pilizota, T., Bilyard, T., Bai, F., Futai, M., Hosokawa, H., and Berry, R. M. (2007). A programmable optical angle clamp for rotary molecular motors. Biophysical Journal, 93(1):264–275.
- Pilizota and Shaevitz, (2012) Pilizota, T. and Shaevitz, J. W. (2012). Fast, multiphase volume adaptation to hyperosmotic shock by Escherichia coli. PLoS ONE, 7(4):e35205.
- Prindle et al., (2015) Prindle, A., Liu, J., Asally, M., Ly, S., Garcia-Ojalvo, J., and Süel, G. M. (2015). Ion channels enable electrical communication in bacterial communities. Nature, 527(7576):59–63.
- Richter, (1987) Richter, C. (1987). Biophysical consequences of lipid peroxidation in membranes. Chemistry and Physics of Lipids, 44(2-4):175–189.
- Rosko, (2017) Rosko, J. (2017). Osmotaxis in Escherichia coli. PhD thesis, The Edinburgh University.
- Rosko et al., (2017) Rosko, J., Martinez, V., Poon, W., and Pilizota, T. (2017). Osmotaxis in Escherichia coli through changes in motor speed. Proceedings of the National Academy of Sciences of the United States of America, 114(38):E7969–E7976.
- Ruthe and Adler, (1985) Ruthe, H. J. and Adler, J. (1985). Fusion of bacterial spheroplasts by electric fields. Biochimica et Biophysica Acta - Biomembranes, 819(1):105–113.
- Slonczewski et al., (1981) Slonczewski, J. L., Rosen, B. P., Alger, J. R., and Macnab, R. M. (1981). pH homeostasis in Escherichia coli: measurement by 31P nuclear magnetic resonance of methylphosphonate and phosphate. Proceedings of the National Academy of Sciences of the United States of America, 78(10):6271–6275.
- Sowa and Berry, (2008) Sowa, Y. and Berry, R. M. (2008). Bacterial flagellar motor. Quarterly Reviews of Biophysics, 41(2):103–132.
- Storz and Imlayt, (1999) Storz, G. and Imlayt, J. A. (1999). Oxidative stress. Current Opinion in Microbiology, 2(2):188–194.
- Svoboda et al., (1993) Svoboda, K., Schmidt, C. F., Schnapp, B. J., and Block, S. M. (1993). Direct observation of kinesin stepping by optical trapping interferometry. Nature, 365(6448):721–727.
- te Winkel et al., (2016) te Winkel, J. D., Gray, D. A., Seistrup, K. H., Hamoen, L. W., and Strahl, H. (2016). Analysis of Antimicrobial-Triggered Membrane Depolarization Using Voltage Sensitive Dyes. Frontiers in Cell and Developmental Biology, 4:29.
- Tipping et al., (2013) Tipping, M. J., Delalez, N. J., Lim, R., Berry, R. M., and Armitage, J. P. (2013). Load-dependent assembly of the bacterial flagellar motor. mBio, 4(4).
- Tran and Unden, (1998) Tran, Q. H. and Unden, G. (1998). Changes in the proton potential and the cellular energetics of Escherichia coli during growth by aerobic and anaerobic respiration or by fermentation. European Journal of Biochemistry, 251(1-2):538–543.
- Urh et al., (2009) Urh, M., Simpson, D., and Zhao, K. (2009). Affinity Chromatography. General Methods. In Methods in Enzymology, volume 463, chapter 26, pages 417–438. Academic Press.
- Van Rotterdam et al., (2002) Van Rotterdam, B. J., Crielaard, W., Van Stokkum, I. H., Hellingwerf, K. J., and Westerhoff, H. V. (2002). Simplicity in complexity: The photosynthetic reaction center performs as a simple 0.2 V battery. FEBS Letters, 510(1-2):105–107.
- Walter et al., (2007) Walter, J. M., Greenfield, D., Bustamante, C., and Liphardt, J. (2007). Light-powering Escherichia coli with proteorhodopsin. Proceedings of the National Academy of Sciences of the United States of America, 104(7):2408–12.
- Wang et al., (2018) Wang, Y. K., Krasnopeeva, E., Bai, F., Pilizota, T., and Lo, C.-J. (2018). Bacterial Immobilization Assays for Single Cell Experiment. In preparation.
- Wilks and Slonczewski, (2007) Wilks, J. C. and Slonczewski, J. L. (2007). pH of the cytoplasm and periplasm of Escherichia coli: Rapid measurement by green fluorescent protein fluorimetry. Journal of Bacteriology, 189(15):5601–5607.
- Wong-Ekkabut et al., (2007) Wong-Ekkabut, J., Xu, Z., Triampo, W., Tang, I. M., Tieleman, D. P., and Monticelli, L. (2007). Effect of lipid peroxidation on the properties of lipid bilayers: A molecular dynamics study. Biophysical Journal, 93(12):4225–4236.
- Zhao and Drlica, (2014) Zhao, X. and Drlica, K. (2014). Reactive oxygen species and the bacterial response to lethal stress. Current Opinion in Microbiology, 21:1–6.
- Zilberstein et al., (1984) Zilberstein, D., Agmon, V., Schuldiner, S., and Padan, E. (1984). Escherichia coli intracellular pH, membrane potential, and cell growth. Journal of Bacteriology, 158(1):246–252.
Supplementary materials
Deduction of electric circuit model
Let us consider the circuit from Fig. 1A without yet applying simplifications discussed in the main text. When the system is in equilibrium current trough the capacitor . Upon application of a given stress one of the three components of the circuit change (, or ), and all three currents become non zero. Then, based on Kirchoff’s laws we have:
| (S1a) |
| (S1b) |
| (S1c) |
We do not consider scenarios that change more than one circuit element at the same time. Let us first consider the case when overall membrane resistance, , changes, i.e. membrane has been damaged and , and are kept fixed. Based on Ohm’s law membrane voltage can be expressed as . Thus, to get the functional dependence of on the stress amplitude we need to find , equation (2b) and (3c) in the main text.
| (S2) |
where is the current through , i.e. before changed. We are now looking for expressions for (,t) and . We know that the current through the capacitor is and thus from (S1c) follows:
| (S3) |
| (S4) |
| (S5) |
because and do not change during the application of the stress. Using (2b) in the main text and (S5) we can now express (S2) as:
| (S6) |
where (,t) is a solution of (S4). Alternatively, if the stress-affected element is or equation (S3) and (S4) become:
| (S7) |
| (S8) |
We now apply simplifications mentioned in the main text: is always zero ( is in the range of to s), and . Taking the two simplifications into account we arrive to:
| (S9) |
and
| (S10) |
Then, if is affected by the stress, and
| (S11) |
If is affected by the stress, and
| (S12) |
Finally, if is affected by the stress,
| (S13) |
Supplementary Methods:E. coli strain construction
All the chromosomal manipulations were performed using plasmid mediated gene replacement method (PMGR) described previously (Link and Phillips,, 1997; Merlin et al.,, 2002). The method is based on RecA-mediated homologous recombination occurring between homologous regions on the chromosome and plasmid. Backbone plasmid pTOF24 (Merlin et al.,, 2002) was digested with SalI and PstI restriction enzymes. Inserts were amplified with primers listed in SI Table LABEL:Table_1 and assembled together in Gibson assembly reaction. MG1655 was transformed with a resulting pTOF-fliCsticky (SI Fig. 10A). The gene replacement was then performed following the PMGR protocol from (Merlin et al.,, 2002). Resulting strain EK01 was transformed with pTOF-pHluorin plasmid (SI Fig. 10B) and the protocol was repeated. Obtained EK07 strain differs from parental MG1655 strain in having ”sticky” flagella and pHluorin gene on the attTn7 site of the chromosome, which is confirmed by sequencing.
Supplementary Methods: pHluorin calibration
The in vivo calibration of the pH sensor (pHluorin) is performed as described in (Wang et al.,, 2018). Briefly, MM9 medium is adjusted to a set of pH values in the range between 5.5 and 9 and supplemented with 40 mM potassium benzoate and 40 mM methylamine hydrochloride (Martinez et al.,, 2012). The medium of a known pH is flushed into the tunnel-slide with cells attached to the surface as described before and incubated for 5 min. Total of 100 cells are imaged at 50 ms exposure time. The calibration curve obtained is given in SI Fig. 11A and fitted with a sigmoid function , where are fitting parameters. The in vitro calibration (SI Fig. 11B) is done using his-tagged pHluorin, purified with affinity chromatography (Urh et al.,, 2009) diluted into buffer of known pH (and supplemented with indole or butanol when testing pHluorin sensitivity to it). The pHluorin emission intensity is measured for 395 nm and 475 nm excitation in Spark 10M multimode plate reader (Tecan Trading AG, Switzerland). pH of the buffers in presence of indole/butanol is confirmed with pH meter (FE20 FiveEasyTM, Mettler-Toledo International Inc, Switzerland). To account for photobleaching, MM9 medium supplemented with 5% ethanol is supplied (at 10 l/min flow rate) to the cells attached to the surface in a flow-cell. After 5 to 10 min incubation imaging of ethanol treated cells is performed as during the photodamage experiment. The change in pHluorin intensities ratio is determined for ethanol treated cells and used to account for photobleaching by calculating the normalisation coefficients for each time point.
Supplementary Methods: pHluorin image analysis
To analyse images of pHluorin expressing cells we first identify cells uniformly attached to the surface (so called ”flat cells” (Pilizota and Shaevitz,, 2012; Buda et al.,, 2016)), and calculate the background intensity by dividing the whole image into four identical squares. Next we find the minimal intensity in each square and average 3x3 pixel box surrounding the minimal intensity pixel to get the background intensity value for that square. We subtract the background intensity of the corresponding square based on the location of the ”flat” cell. We create a cell mask for flat cells using Otsu thresholding method (Otsu,, 1979) followed by binary erosion and binary dilation to eliminate noise. We obtain the intensities for 475 nm and 395 nm channels by calculating the mean pixel intensity within the identified cell mask, and calculate the ratio of the two to obtain the cytoplasmic pH from the in vivo calibration curve (see above and SI Fig. 11A).
Supplementary Tables
| Plasmid | Fragment name | Template | Gibson assembly primers |
| fliA shoulder | MG1655 | 5’- CCGCTTATGTCTATTGCTGGTCTCGGTACCCGACCTGCACAATGCTTCGTGACGCACCA | |
| 5’- AGCAGGTTCTGTCTCTGCTGCAGGGTTAATCGTTGTAACCTGATTAACTGAGACTGA | |||
| pTOF-fliCsticky | fliCsticky | pFD313 (Berg and Turner,, 1993) | 5’- CGTCAGTCTCAGTTAATCAGGTTACAACGATTAACCCTGCAGCAGAGACAGAACCTGCT |
| 5’- CAACGACTTGCAATATAGGATAACGAATCATGGCACAAGTCATTAATACCAACAGCCTC | |||
| fliD shoulder | MG1655 | 5’- GAGGCTGTTGGTATTAATGACTTGTGCCATGATTCGTTATCCTATATTGCAAGTCGTTG | |
| 5’- GCTACAGGGCGCGTCCCATTCGCCACCGGTCGAAAGTTTAGCGGTAAACGACGATTG | |||
| Tn7 Left Shoulder | MG1655 | 5’- TATGTCTATTGCTGGTCTCGGTACCCGACCTGCAATGCCGGTTATTGTTGTTGCACCGA | |
| 5’- TCGAAAGACTGGGCCTTTCGTTTTATCTGCCCGCTTACGCAGGGCATCCATTTATTACT | |||
| pTOF-pHluorin | V. harveyi promoter | pWR20 (Pilizota and Shaevitz,, 2012) | 5’- AGTGAAAAGTTCTTCTCCTTTACTCATATGTATATCTCCTTAACTAGGTAATTATCAAGC |
| 5’- ATGTTTGATTAAAAACATAACAGGAAGAAAAATGCCCCGCATTTCGACACCTTCGTCCTC | |||
| pHluorin | pkk223-3/pHluorin (Morimoto et al.,, 2011) | 5’- GTAATAAATGGATGCCCTGCGTAAGCGGGCAGATAAAACGAAAGGCCCAGTCTTTCGAC | |
| 5’- TGATAATTACCTAGTTAAGGAGATATACATATGAGTAAAGGAGAAGAACTTTTCACTGGA | |||
| pTOF-pHluorin | Tn7 Right Shoulder | MG1655 | 5’- CACTTACCTGAGGACGAAGGTGTCGAAATGCGGGGCATTTTTCTTCCTGTTATGTTTTTA |
| 5’- CAGGGCGCGTCCCATTCGCCACCGGTCGACAAACACAGAGAAAGCACTCATCGATAAGG |
Supplementary Figures
![[Uncaptioned image]](/html/1809.05306/assets/OD.jpg) |
![[Uncaptioned image]](/html/1809.05306/assets/Slides.png) |
![[Uncaptioned image]](/html/1809.05306/assets/Flush_control_lr.png) |
![[Uncaptioned image]](/html/1809.05306/assets/Laser_control_lr.png) |
![[Uncaptioned image]](/html/1809.05306/assets/pH_combined.jpg) |
![[Uncaptioned image]](/html/1809.05306/assets/Std_all.png) |
![[Uncaptioned image]](/html/1809.05306/assets/multiflush_lr.png) |
![[Uncaptioned image]](/html/1809.05306/assets/recovery.png) |
![[Uncaptioned image]](/html/1809.05306/assets/No_fluor_lr.png) |
![[Uncaptioned image]](/html/1809.05306/assets/maps.jpg) |
![[Uncaptioned image]](/html/1809.05306/assets/in_vitro.png)