Dark matter deficient galaxies in the Illustris flat-CDM model structure formation simulation
Abstract
Surveying dark matter deficient galaxies (those with dark matter mass to stellar mass ratio ) in the Illustris simulation of structure formation in the flat-CDM cosmogony, we find galaxies that have properties similar to those ascribed by van Dokkum et al. (2018a) to the ultra-diffuse galaxy NGC1052-DF2. The Illustris simulation also contains more luminous dark matter deficient galaxies. Illustris galaxy subhalo 476171 is a particularly interesting outlier, a massive and very compact galaxy with and and a half-stellar-mass radius of kpc. If the Illustris simulation and the CDM model are accurate, there are a significant number of dark matter deficient galaxies, including massive luminous compact ones. It will be interesting to observationally discover these galaxies, and to also more clearly understand how they formed, as they are likely to provide new insight into and constraints on models of structure formation and the nature of dark matter.
1 Introduction
In the standard CDM model (Peebles, 1984) the cosmological constant powers the currently accelerating cosmological expansion and cold dark matter (CDM) is now the second biggest contributor to the cosmological energy budget. Earlier, when nonrelativistic CDM and baryonic matter dominated, the cosmological expansion decelerated. The standard spatially-flat CDM model is consistent with many observational constraints when the current , CDM, and baryonic density parameters are at or near , , and (Park & Ratra, 2018b).111For reviews of the standard model see Ratra & Vogeley (2008), Martin (2012), and Luković et al. (2018).
These observations include cosmic microwave background (CMB) anisotropies (Hinshaw et al., 2013; Planck Collaboration, 2016), baryon acoustic oscillation distances (Alam et al., 2017; Ryan et al., 2018), supernova Type Ia apparent magnitudes (Scolnic et al., 2017), and Hubble parameters (Farooq et al., 2017; Yu et al., 2018). There is significant observational evidence for CDM, as well as for (or a dark energy that behaves almost like ), and introducing these fairly astonishing hypothetical substances appears to be the most reasonable way to make sense of the observations. For instance, Hubble parameter observations span a wide redshift range, almost to , and show evidence for both a present epoch dark energy powered accelerating cosmological expansion as well as an earlier CDM and baryonic matter driven decelerated cosmological expansion (Farooq & Ratra, 2013; Farooq et al., 2013; Moresco et al., 2016; Farooq et al., 2017; Yu et al., 2018; Jesus et al., 2018; Haridasu et al., 2018). It is also widely accepted that CDM is necessary for the formation of observed structure in the cosmological matter and radiation fields.
In the standard CDM structure formation model (Peebles, 1982), quantum zero-point fluctuations of the inflaton scalar field during inflation (Hawking, 1982; Starobinsky, 1982; Guth & Pi, 1982; Fischler et al., 1985) seeded spatial inhomogeneities that then grew under gravitational instability to create the observed structures in the cosmological matter and radiation fields. Initially inhomogeneities developed and grew in the CDM; as the CMB cooled and decoupled from the baryons, baryonic matter was gravitationally attracted to and fell deeper into the CDM halo inhomogeneity gravitational potential wells. While the initial gathering of CDM under gravity is a relatively simple process, when the baryons start to play a significant role the structure formation problem becomes much less tractable because the physics is more familiar, more complex, and more difficult to model quantitatively.
In the standard CDM model it is not inconceivable that after a collection of baryonic matter formed stars and became a “galaxy”, this galaxy might be ejected from the CDM halo in which it was formed and could find itself in a region with a lower CDM density.222It is highly unlikely that baryonic structure, a “galaxy”, could form in very low CDM density regions. It is not known how probable such an outcome is. The van Dokkum et al. (2018a) observations and argument that the ultra-diffuse dwarf galaxy NGC1052-DF2 has a stellar mass of about and a total mass of less than in a radius of 7.6 kpc and so indicates a much smaller dark matter mass to stellar mass ratio, , than that of a typical galaxy with this stellar mass,333We note that there has been some discussion of these observations and the van Dokkum et al. (2018a) interpretation of them (van Dokkum et al., 2018b; Martin et al., 2018; Laporte et al., 2018; Famaey et al., 2018; Scarpa et al., 2018; Nusser, 2018; Trujillo et al., 2018; van Dokkum et al., 2018c; Wasserman et al., 2018; Blakeslee & Cantiello, 2018). motivated us to attempt to determine the probability of such an outcome.
We study the issue of dark matter deficient galaxies by looking at galaxy population statistics of the Illustris simulation (www.illustris-project.org, Vogelsberger et al., 2014a) of structure formation in the flat-CDM cosmogony. We find that dark matter deficient galaxies, with and (like NGC1052-DF2, van Dokkum et al., 2018a), are not uncommon. We also find a significant number of more luminous and more massive dark matter deficient galaxies.
2 Dark matter deficient galaxy statistics and examples
Illustris (www.illustris-project.org, Vogelsberger et al., 2013, 2014a, 2014b; Genel et al., 2014; Sijacki et al., 2015) is one of the largest hydrodynamical cosmological simulations. It can help us understand how structure in the universe evolves with time, and in particular how the dark matter and stellar mass distributions evolve. The simulation assumes a tilted spatially-flat CDM cosmogony with chosen parameter values in reasonable accord with current cosmological measurements (Park & Ratra, 2018b).444Current cosmological data are also not inconsistent with mildly closed spatial hypersurfaces (Ooba et al., 2018a; Park & Ratra, 2018a, b, d), with mild dark energy dynamics (Ooba et al., 2018c; Park & Ratra, 2018b, c, d), and with nonflat dynamical dark energy models (Ooba et al., 2017, 2018b; Park & Ratra, 2018b, c, d). While reionization is remarkably different in the closed model compared to the standard flat case (Mitra et al., 2018), it is likely that structure formation will be less affected by observationally-consistent values of nonzero spatial curvature or dark energy dynamics. The fiducial parameter values chosen for the simulation are coming from the final WMAP analysis (Hinshaw et al., 2013).555Here is the nonrelativistic matter density parameter, is the rms fractional energy density inhomogeneity averaged over 8 Mpc spheres, is the spectral index of the primordial energy density perturbation power spectrum (which is assumed to be a power law in wavenumber), and is the Hubble constant in units of 100 km s-1 Mpc-1. The Illustris-1 simulation contains 18203 dark matter particles, 18203 gas particles, and 18203 tracer particles in a comoving box of size (106.5 Mpc)3. The mass of each dark matter particle is and for baryonic particles the mass is . The simulation not only accounts for gravity and hydrodynamics but also includes effects of star formation and evolution, gas cooling, black holes and supermassive black hole feedback, as well as other relevant phenomena, and so should allow us to have a fuller understanding of the effects of various physical processes on the formation of large-scale structure. In this work we make use of the Illustris-1 simulation.
At redshift there are 7,713,601 friends-of-friends (FoF) groups (with more than 32 dark matter particles) and 4,366,546 individual SUBFIND (gravitationally bound) subhalos have formed (Vogelsberger et al., 2014a, b). The present time, at , corresponds to snapshot or snap 135.666136 data snapshots are stored for each Illustris run, the first one, snap 0, is at . We use the subhalo catalog to get the dark matter mass, , and the stellar mass, , of each SUBFIND subhalo and find that most of them have zero stellar mass.777These subhalo masses are Illustris SubhaloMassType masses. These are the total masses of all member particle/cells which are bound to the subhalo under consideration, separated by type. SubhaloMassType does not account for particle/cells bound to substructures of the subhalo under consideration. Later in this paper we will also use two other mass definitions. Ignoring these leaves 307,786 subhalos, about 7.0% of all subhalos. We then select subhalos with , finding 4216 subhalos which have more stellar mass than dark matter mass, about 1.3% of the subhalos that have nonzero stellar mass. Most of these have low stellar mass, less than . There are however three subhalos with stellar mass greater than with .
| SUBFIND | SFR | ||||||
| ID | () | () | () | () | () | (kpc) | (kpc) |
| 41124 | 4.45 | 0.260 | 4.18 | 0 | 0 | 2.03 | 5.24 |
| 231881 | 1.86 | 0.0726 | 1.79 | 0 | 0 | 1.57 | 2.49 |
| 476171 | 10.54 | 0.915 | 9.42 | 0 | 0 | 1.82 | 4.76 |
| 41089 | 2645.03 | 2587.20 | 52.94 | 4.67 | 0.0036 | 28.68 | 19.27 |
| 231879 | 1752.37 | 1692.51 | 57.81 | 1.85 | 0 | 17.47 | 21.83 |
| 928035 | 0.0659 | 0 | 0.0659 | 0 | 0 | 1.75 | 1.32 |
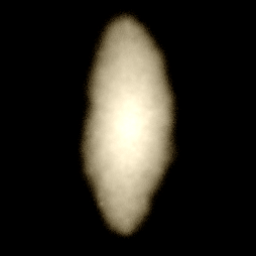
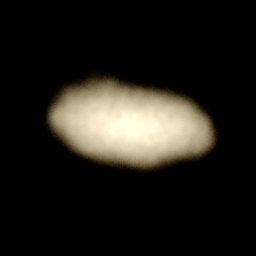
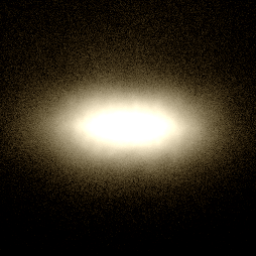
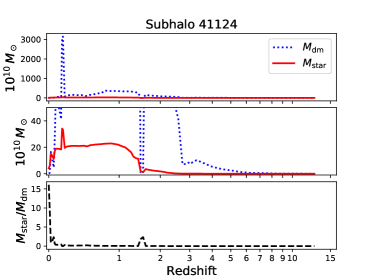
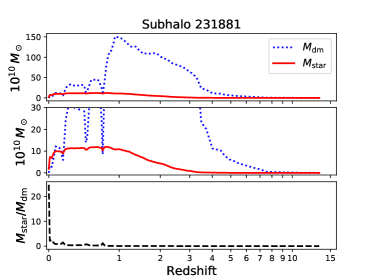
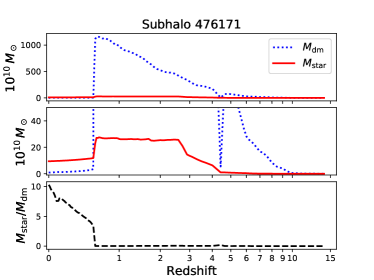
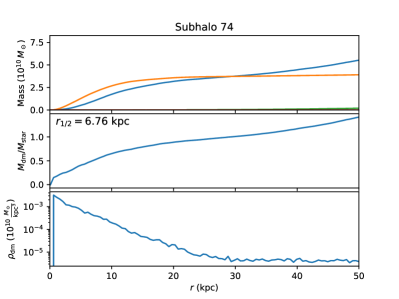
The SUBFIND IDs of these three massive dark matter deficient subhalos are 41124, 231881 and 476171 in snap 135 at and their properties are listed in Table 1. We see that these subhalos have no gas and their star formation has ceased. Consistent with these properties, the mock images of these three subhalos show that they are elliptical subhalos (see Fig. 1). We trace the evolutionary history of these subhalos by using their sublink merger trees. We plot their dark matter mass and stellar mass histories in Fig. 2.888The histories plotted in Fig. 2 are assembled from that of the identified subhalo as well as its progenitor subhalo(s). All three subhalos have a period during which they rapidly lose most of their dark matter mass but lose relatively little of their stellar mass which results in abrupt increases of their ratios. This might happen in a merger process of two large subhalos or through some other mechanism. After checking the evolutionary history of the three subhalos we find that both 41124 and 231881 are undergoing mergers. Subhalo 41124 is merging with subhalo 41089 and subhalo 231881 is merging with subhalo 231879 and the properties of these two new subhalos are also listed in Table 1. Subhalos 41089 and 231879 are much more massive than 41124 and 231881 and so dominate the merger processes and the two dark matter halos. If subhalos 41124 and 231881 can escape from their much more massive companions, they might form dark matter deficient galaxies. Subhalo 476171, whose stellar mass is 9.42, comparable to that of our Milky Way, is an isolated elliptical galaxy and we will more closely examine its evolutionary history to understand how it formed.
Not all of the selected 307,786 SUBFIND subhalos with nonzero stellar mass are galaxies. Some of them, especially the less massive subhalos, are more likely to be substructures of other galaxies. To find subhalos that are galaxies, we check the ‘Parent’ property of each subhalo (the index in the subhalo table of the unique SUBFIND host subhalo of this subhalo999This index is local to the FoF group. For example, index 2 indicates the third most massive subhalo of the parent halo of this subhalo, not the third most massive of the whole snapshot.) which can indicate if the subhalo of interest belongs to (is substructure in) a host subhalo. However, even if the value of the Parent index is 0 this could just mean that the host of the subhalo under consideration is just the most massive subhalo in the FoF group of the subhalo under consideration and not a separate galaxy. So we additionally compare the distance between the subhalo under consideration and its host subhalo with the half-stellar-mass radius , which contains half of the total stellar mass of the galaxy subhalo, of the host subhalo and regard the subhalo under consideration to be a galaxy only if it has . We also discard subhalos with fewer than 20 stellar particles since half-stellar-mass radius is not measured as robustly for such objects. Applying these criteria, we get a new galaxy subhalo sample containing 58,025 subhalos that are galaxies. We will analyze this compilation in what follows.
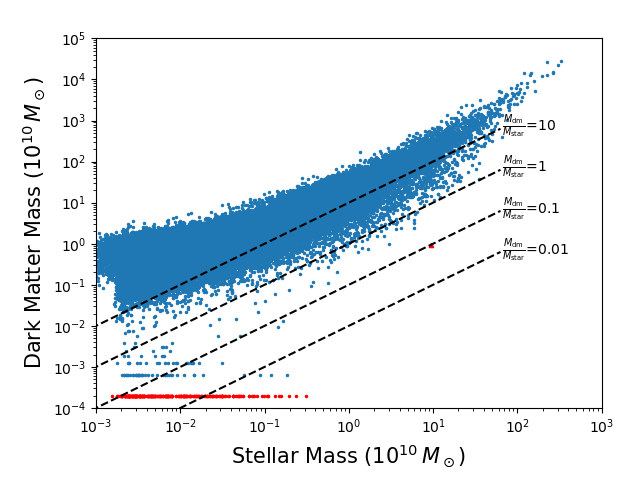
Figure 3 shows the distribution of these galaxy subhalos as a function of their stellar mass and dark matter mass. Here we consider only the 57,945 galaxy subhalos with stellar mass larger than . From the figure we find that there are some subhalos with less than 1 which means these subhalos have more stellar mass than dark matter mass. There are 420 subhalos, which leads to a probability of about 0.72% for these dark matter deficient subhalos. It is also clear that most of these have low stellar mass, less than .101010It is unclear what the galaxy subhalos with no dark matter (under SubhaloMassType), those indicated by the low red line of red points in Fig. 3, are. A few of the more massive ones have . We have looked at a few of the most massive of these but they only appear at (snap 135) and so we are unable to trace their evolutionary history. They also do not have image data. It would be useful to understand how these galaxy subhalos formed and what observational constraints can be placed on them. However, there is one subhalo with stellar mass greater than and with , shown as the red star in Fig. 3. This is subhalo 476171, discussed above, which we consider in more detail below. We also find that the other two dark matter deficient massive subhalos 41124 and 231881 discussed above do not appear in this figure since they are participating in mergers and so are regarded as substructures of their much more massive companion galaxies. We emphasize that galaxy subhalo 476171 is an outlier, and also that it has many less extreme — but still very interesting — cousins with and .
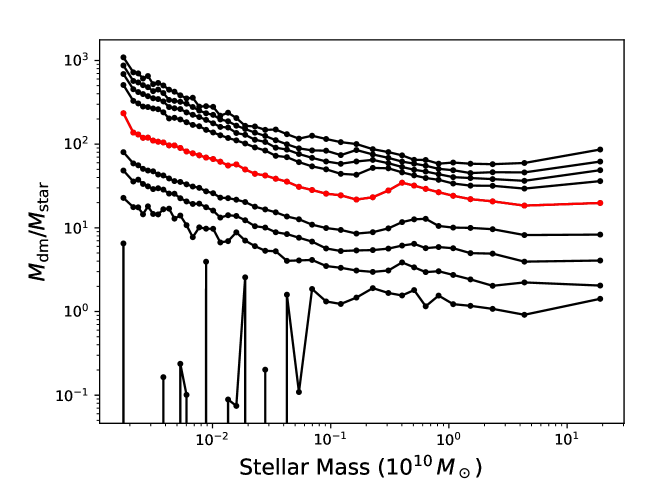
The relation between the and values of the galactic subhalos is shown in Fig. 4. From this figure we see that the median value of spans a wide range, from about 20 to almost 300, and that this ratio decreases with increasing subhalo stellar mass. For given galaxy subhalo stellar mass, this ratio also spans a wide range, more so at the low stellar mass end. We see that the lower 2.5 limit curve lies at 1—3 at the higher stellar mass end and, excluding some isolated bins, drops precipitously below about . This result means that in the CDM model there is some probability of forming galactic subhalos without or with only very little dark matter mass.
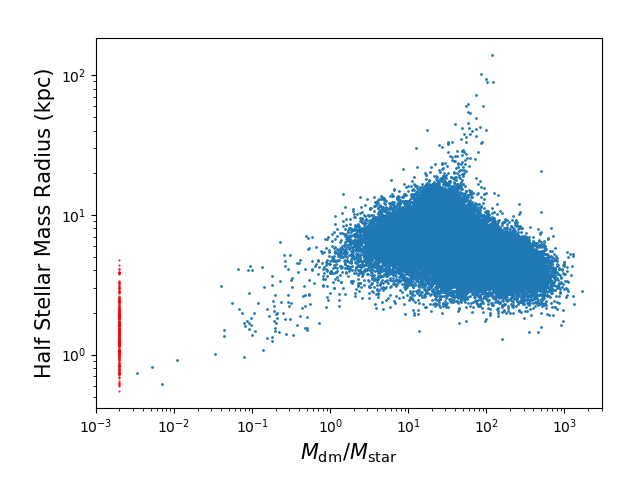
Since NGC1052-DF2 is said to be an ultra-diffuse galaxy, we also consider the half-stellar-mass radius, , and plot the distribution of the galaxy subhalos in the — plain, see Fig. 5. From this figure we see that, for say , the half-stellar-mass radius decreases with decreasing galaxy subhalo mass ratio , if we ignore the red dots. Further, for , there are some galaxy subhalos with relatively large half-stellar-mass radius, say 2 kpc, which might appropriately be called ultra-diffuse galaxies. Figure 5 also shows that the Illustris simulation results in a few galaxy subhalos with 50 kpc. We examined their properties and found that they are the most or the second most massive galaxy subhalos in massive FoF groups, perhaps cD galaxies in galaxy clusters.111111Additionally, the left most red line of red dots in Fig. 5 corresponds to galaxy subhalos with no dark matter (under SubhaloMassType). Some of these have fairly large half-stellar-mass radius , greater than a few kpc. It would be useful to understand how these galaxy subhalos formed and what observational constraints can be placed on them. It is of interest to better understand these objects and to also observationally search for them in the real universe.
As noted above, Illustris SubhaloMassType masses are the total masses of all member particle/cells which are bound to the subhalo under consideration, separated by type. It is possible that some of the SubhaloMassType dark matter deficient galaxy subhalos we have found have diffuse dark matter halos whose masses do not contribute to computed using SubhaloMassType.121212We thank V. Springel for pointing this out and for suggesting that we should also examine the raw Illustris data. To examine this possibility we use the raw Illustris data of the 420 and dark matter deficient galaxy subhalos (here and are computed using SubhaloMassType).
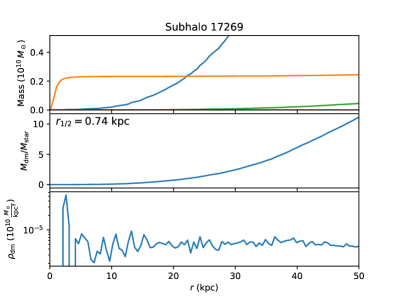
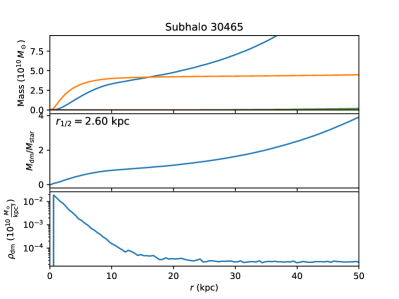
From the raw data for each of the 420 galaxy subhalos we compute spherically symmetrized radial density profiles for the dark matter (dm), star, gas, and black hole (bh) particle distributions out to a radius of 50 kpc. See Figs. 6 and 7 for some examples. Most of these 420 galaxy subhalos have diffuse dark matter halos.
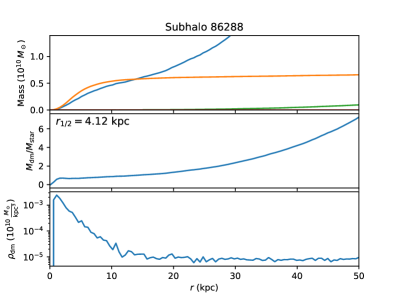
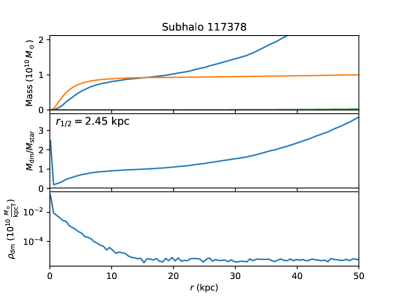
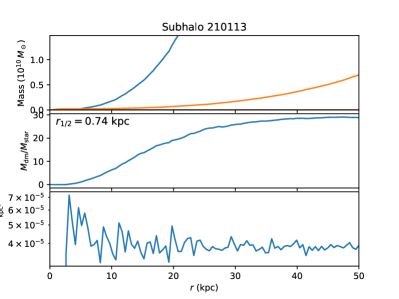
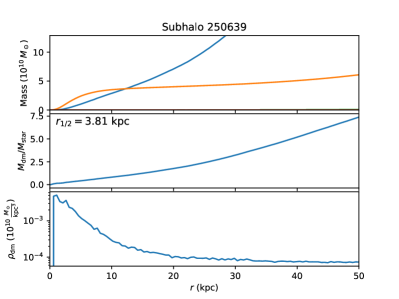
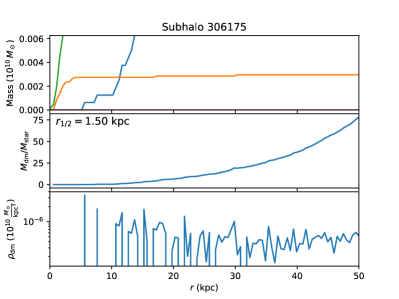
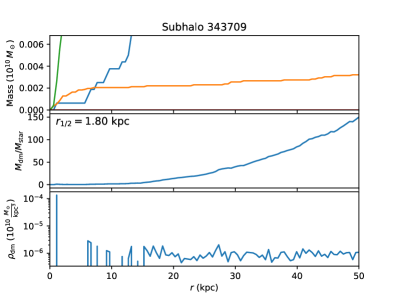
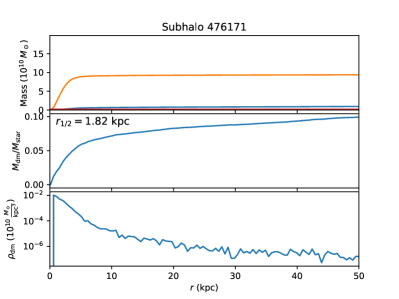
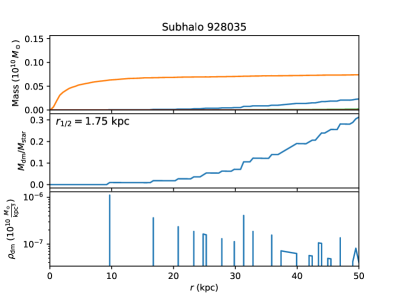
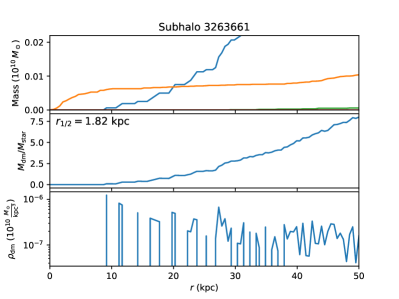
Only two (of the 420) have when the density profiles are integrated to a radial distance of 50 kpc from the galaxy subhalo center to determine and . These are subhalos 476171 (center panel in the right hand column of Fig. 7) and 928035 (bottom panel in the left hand column of Fig. 7). We examined subhalo 928035 and found that it was an isolated small subhalo first seen at snap 135 (). Its main properties are listed in the last data row of Table 1. Since subhalo 928035 first appears at snap 135, it has no progenitor and we are unable to trace its history back in time and so do not know how it formed. We discuss the formation history of subhalo 476171 below.
Observationally, 50 kpc is not necessarily an appropriate distance to integrate to to determine whether a galaxy subhalo is dark matter deficient. Perhaps more reasonable is to integrate out to a small multiple of the galaxy subhalo half-stellar-mass radius .131313We use computed using SubhaloMassType as we are interested only in the star particles bound to the subhalo. If we integrate to 3 we find that 177 (of the 420 SubhaloMassType and ) galaxy subhalos have raw data density profile and so are dark matter deficient. These 177 galaxy subhalos are 0.31% of the 57,945 Illustris galaxy subhalos with SubhaloMassType . Masses, ’s, and density profiles for a dozen of these 177 subhalo galaxies are shown in Figs. 6 and 7. The distribution of these 177 subhalo galaxies as a function of stellar mass is shown in Fig. 8. Figure 9 shows the distribution of these 177 galaxy subhalos in the — plain.
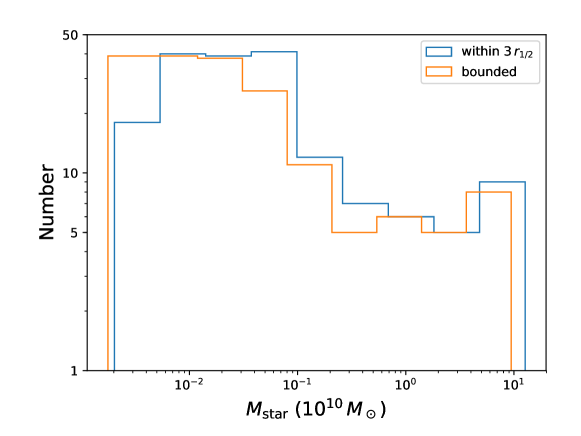
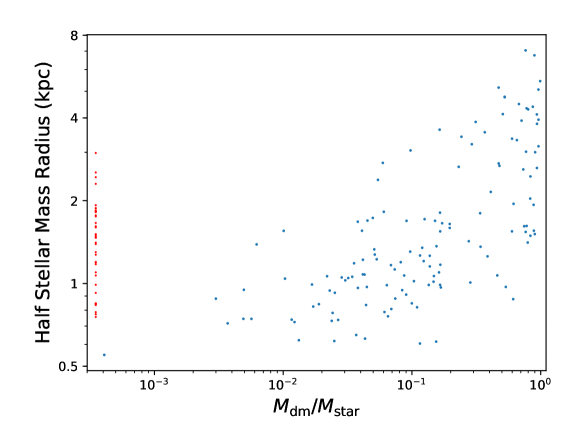
Figure 8 shows that the distribution in stellar mass of the 177 dark matter deficient galaxy subhalos is reasonably flat. It is of significant interest to determine the relative probability of these 177 subhalos as a function of stellar mass. A proper computation of this probability requires a determination of from the density profiles of all 57,945 galaxy subhalos with . This is beyond the computer resources we have available. We have found that 42% of the SubhaloMassType galaxy subhalos are indeed dark matter dominated when we integrate the density profiles to 3 (177 out of 420).141414This ratio will depend on the distance to which the density profiles are integrated, also, for the following -bins discussion, the ratio will depend on the value of under consideration. Consequently determined using SubhaloMassType is likely to provide a qualitatively reasonable approximation of the more correct determined from an integration of the density profiles and so we use the SubhaloMassType ’s to qualitatively estimate the relative probability (an estimate that should be correct to within a factor of 2 or 3).
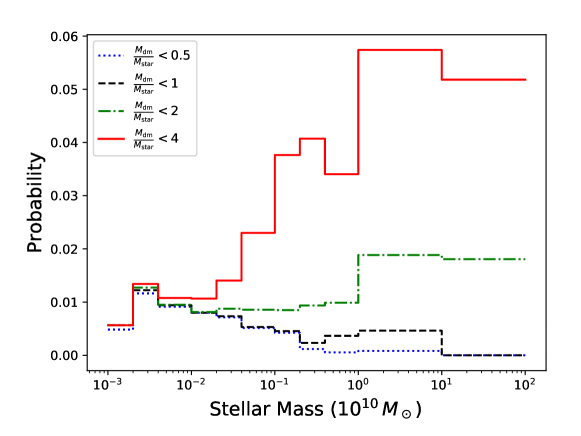
Figure 10 and Table 2 show and list the relative probabilities of dark matter deficient (under SubhaloMassType) galaxy subhalos in a range of stellar mass bins. We see that more than 0.7% of galaxy subhalos with SubhaloMassType (as found for the ultra-diffuse dwarf galaxy NGC1052-DF2 by van Dokkum et al., 2018a) have SubhaloMassType . Even for galaxies with , which should be easier to see, more than 0.4% have . If CDM and the Illustris simulation are accurate, given these SubhaloMassType probabilities, perhaps the more surprising thing about NGC1052-DF2 is not the low but rather that it took so long to find the first dark matter deficient galaxy (if it is indeed confirmed as such).
| Stellar mass bin | Total number of subhalos | Subhalos with | |||||||
| Number | Probability | ||||||||
| [1,2) | 1240 | 6 | 7 | 7 | 7 | 0.48% | 0.56% | 0.56% | 0.56% |
| [2,4) | 10142 | 118 | 124 | 129 | 136 | 1.16% | 1.22% | 1.27% | 1.34% |
| [0.4,1) | 10946 | 100 | 103 | 104 | 118 | 0.91% | 0.94% | 0.95% | 1.08% |
| [1,2) | 6380 | 51 | 51 | 52 | 68 | 0.80% | 0.80% | 0.82% | 1.07% |
| [2,4) | 4909 | 35 | 36 | 43 | 69 | 0.71% | 0.73% | 0.88% | 1.41% |
| [4,10) | 5258 | 27 | 28 | 45 | 121 | 0.51% | 0.53% | 0.86% | 2.30% |
| [0.1,0.2) | 3294 | 14 | 15 | 28 | 124 | 0.43% | 0.46% | 0.85% | 3.76% |
| [0.2,0.4) | 3414 | 4 | 8 | 32 | 139 | 0.12% | 0.23% | 0.94% | 4.07% |
| [0.4,1) | 5463 | 3 | 20 | 54 | 186 | 0.05% | 0.37% | 0.99% | 3.40% |
| [1,10) | 6047 | 5 | 28 | 114 | 347 | 0.08% | 0.46% | 1.89% | 5.74% |
| [10,100] | 830 | 0 | 0 | 15 | 43 | 0.00% | 0.00% | 1.81% | 5.18% |
We now consider in more detail the massive dark matter deficient galaxy subhalo 476171. In snap 135 at , subhalo 476171 is isolated with no satellite subhalo or substructure. Its half-stellar-mass radius is 1.82 kpc and its stellar photometric radius151515The radius at which the surface brightness profile, computed from all member stellar particles, drops below the limit of 20.7 mag arcsec-2 in the K band. is 4.76 kpc. Galaxy subhalo 476171 is very small relative to its large stellar mass and so the stars in 476171 are bound together tightly.161616It is possible that at least the more massive dark matter deficient galaxy subhalos (with and , see Fig. 3) have to be more tightly bound and hence might be expected to be ellipticals. Given their small spatial extent they should have higher surface brightness than more normal dark matter dominated galaxies of the same stellar mass. As a result they will likely not look like more normal dark matter dominated galaxies. It is of interest to determine what observational limits exist on such dark matter deficient galaxies and it is also of interest to search for such galaxies. From Table 1 we see that the other two massive dark matter deficient subhalos are also relatively small.
Galaxy subhalo 476171 has a three-dimensional velocity dispersion of 280 km s-1 and a black hole of mass . These values are only a little smaller than those that have been used to define massive ultracompact galaxies (MUGs, Buitrago et al., 2018). To establish whether 476171 can actually be classified as a MUG is beyond the scope of this paper. It is also of interest to measure the stellar and dynamical masses of MUGs to determine whether some or all them are dark matter deficient galaxies.
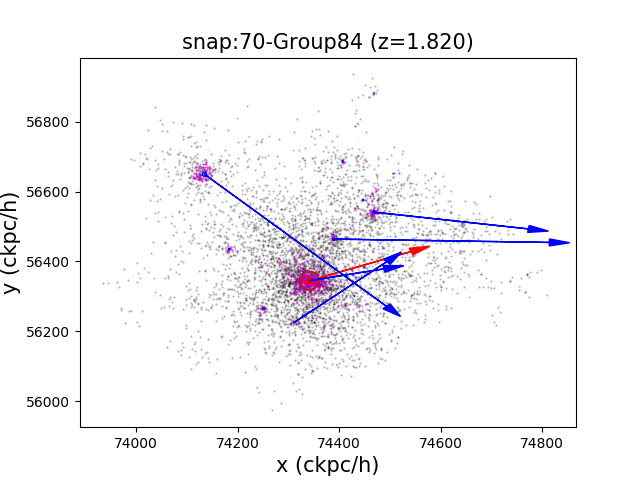
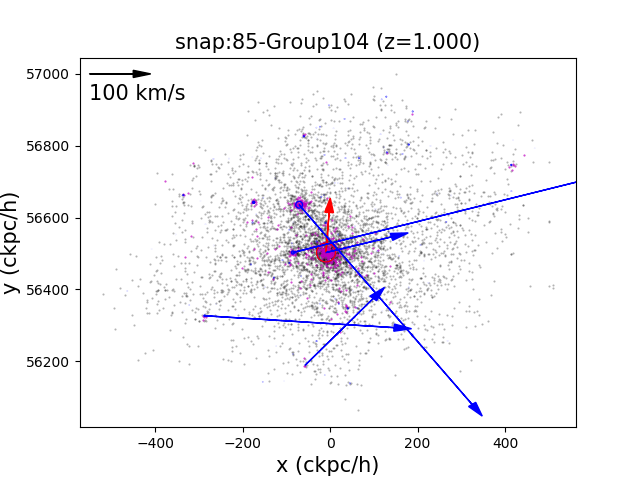
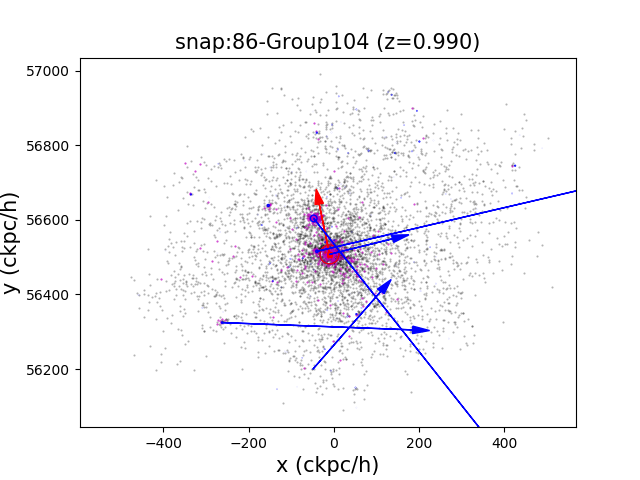
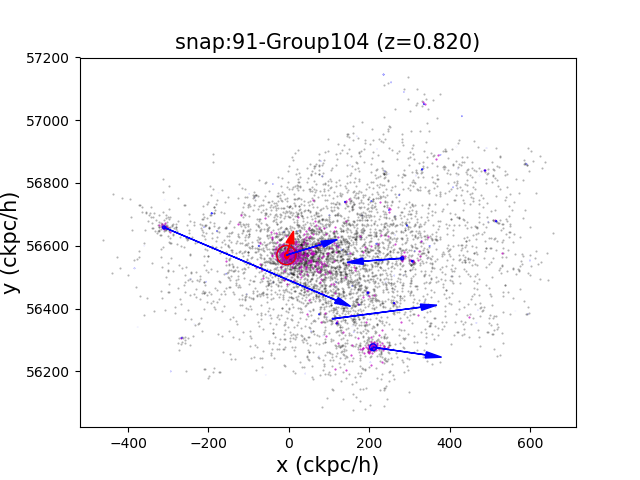
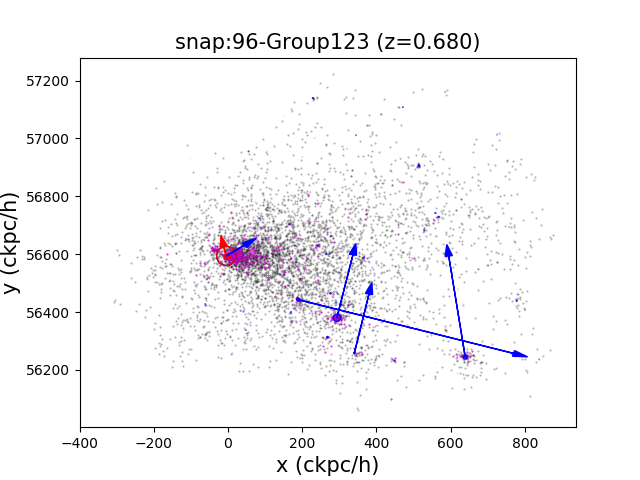
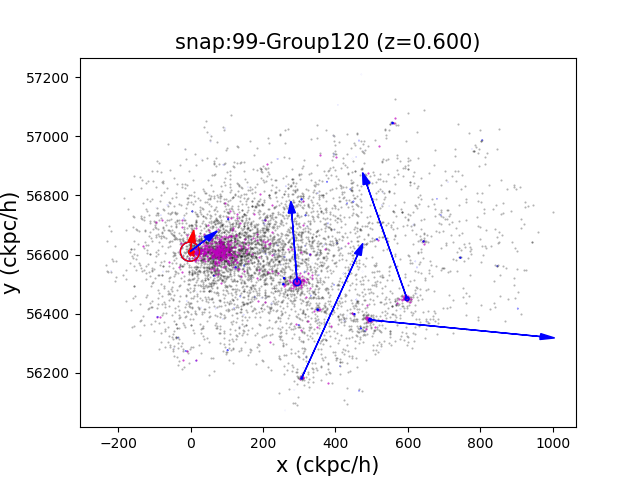
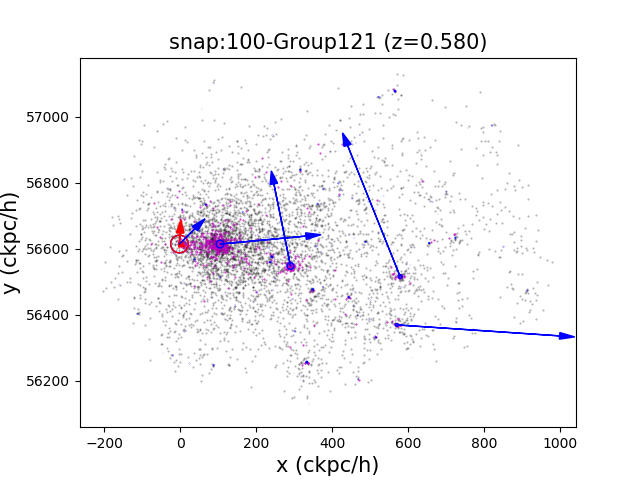
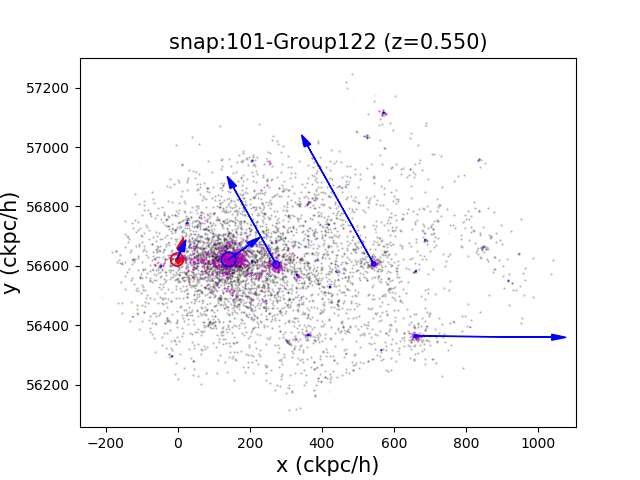
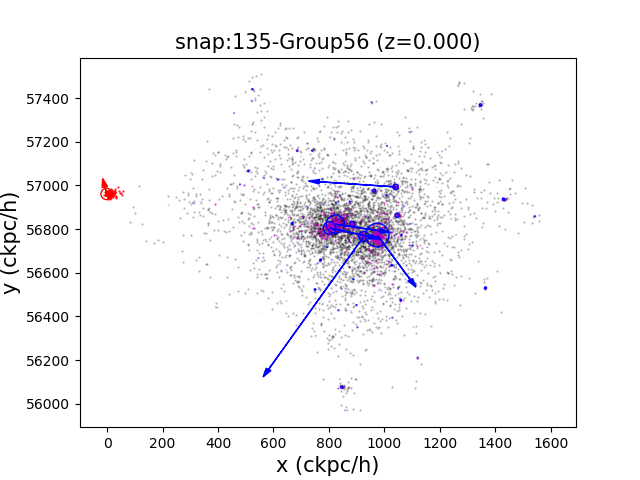
To understand how galaxy subhalo 476171 formed, we trace its formation history by examining the cutouts (which give the matter distribution and properties, such as the positions and velocities of the gas, dark matter and star particles, of its progenitors and parent groups) in snap 54 to 103 (from to 0.5) and in snap 134 () and 135 (). Figure 11 plots the cutout data of 476171 and its parent groups in a dozen snaps. The gray dots represent dark matter particles, purple dots stars, blue circles subhalos (with circle area proportional to stellar mass), and blue arrows represent the velocities of the five most massive subhalos in the parent groups. The red circles identify the progenitors of 476171 in the different snaps, the red dots are the positions of the stars which finally end up in subhalo 476171 in snap 135, and red arrows represent the mean velocity of the red stars. From these figures we see that at first the subhalo is at the center of its parent group that has a very large dark matter halo and they largely move together in the positive direction. But in snap 85 (), the subhalo has ceased moving in the positive direction while the rest of the group largely continues to do so. The subhalo then moves slowly towards the edge of the dark matter halo although it still dominates the whole halo until snap 100 () when a new subhalo starts forming at the center of the dark matter halo. This new subhalo comes to dominate the rest of the dark matter while the progenitor subhalo of 476171 is now at the edge of the whole dark matter halo and continues to move outwards. By this point the progenitor subhalo of 476171 has lost most of its dark matter and some (although relatively less) of its stellar mass which results in it becoming a dark matter deficient galaxy subhalo. (See the lower redshift parts of the central and lower subpanels in the subhalo 476171 panel of Fig. 2.) It keeps moving outward, getting farther and farther away from the rest of the dark matter halo. By snap 135 at , it has completely escaped from its former parent group, forming an isolated group of one with much more stellar mass than dark matter mass.
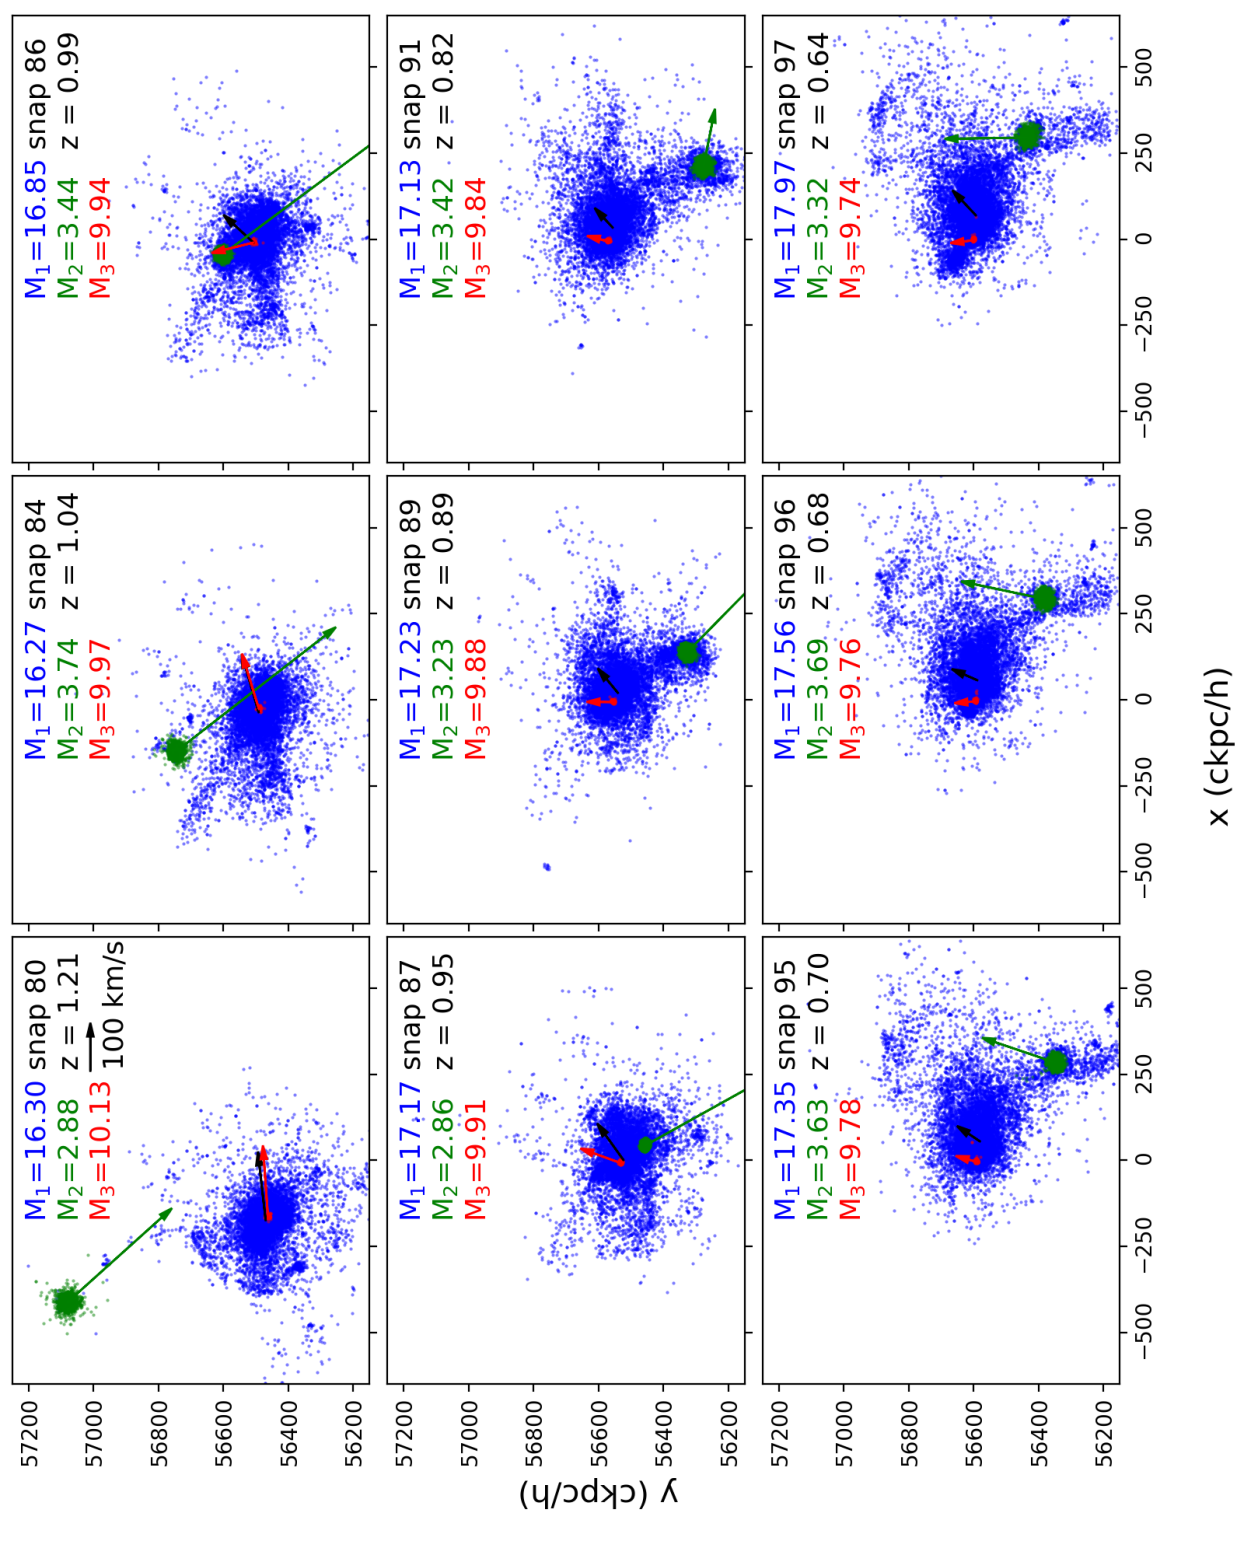
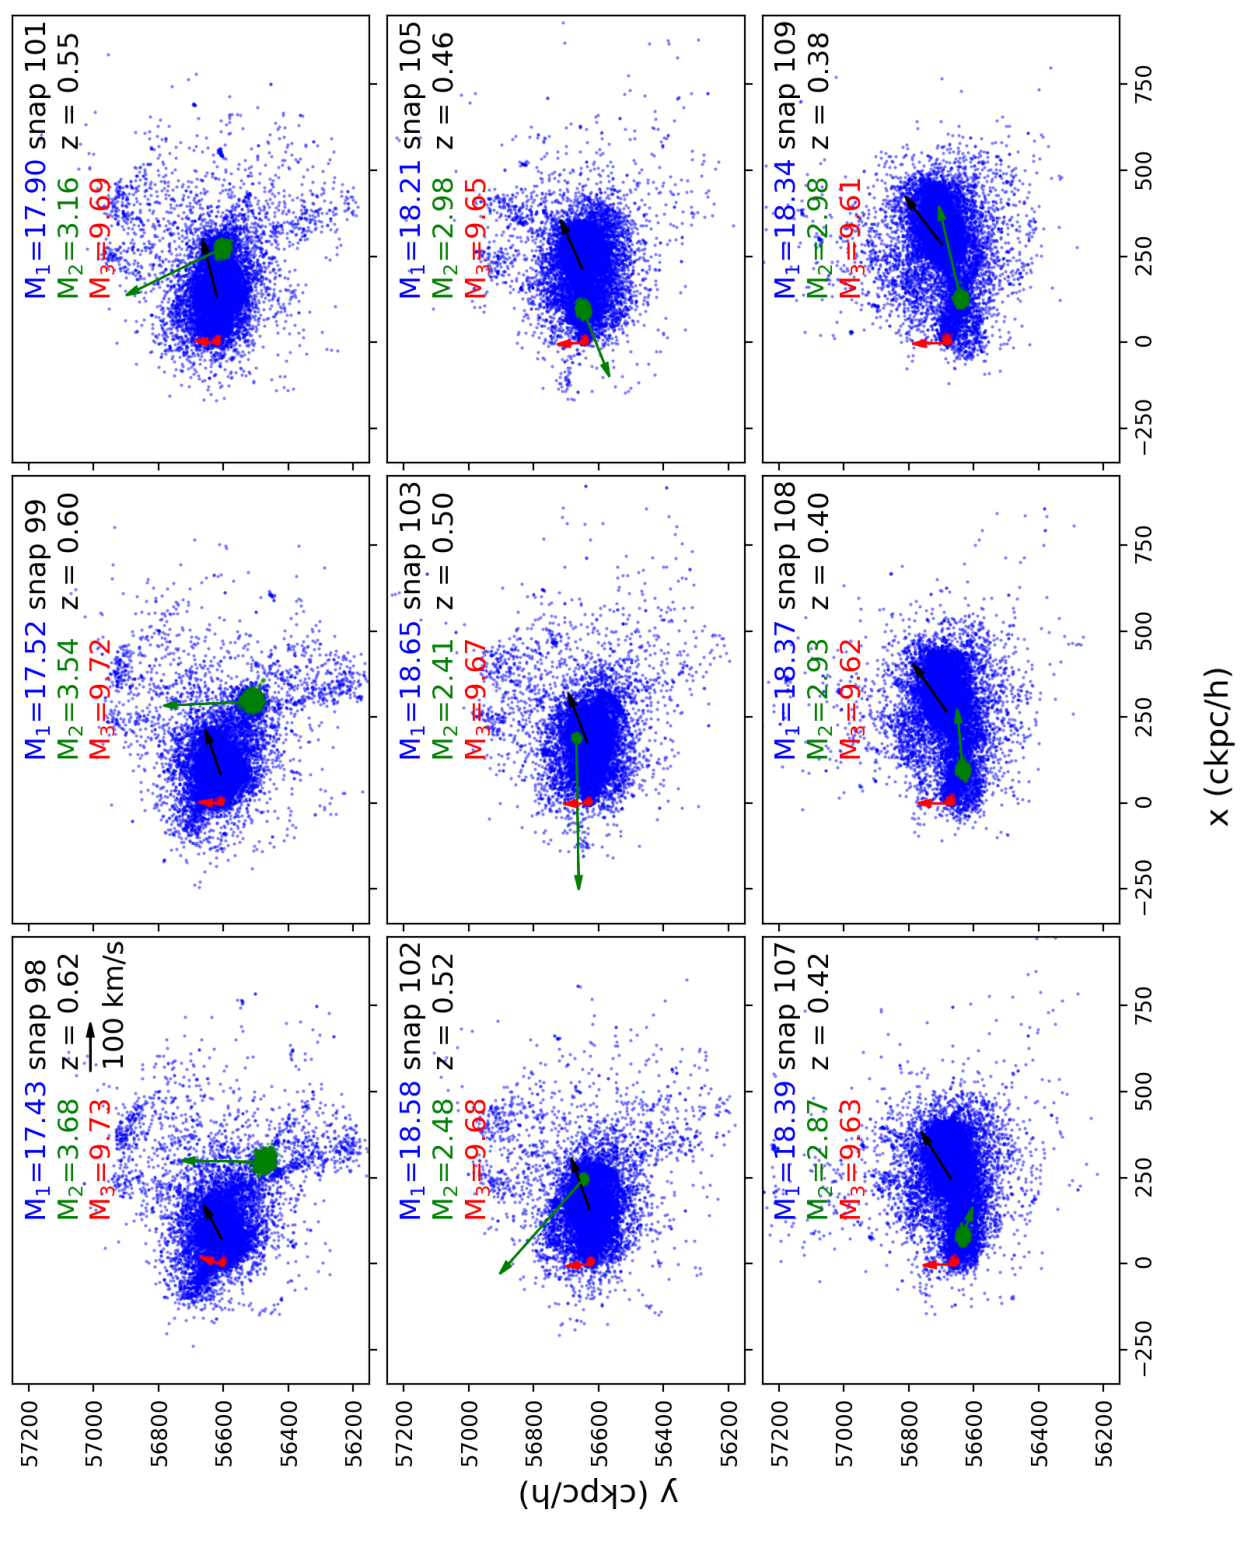
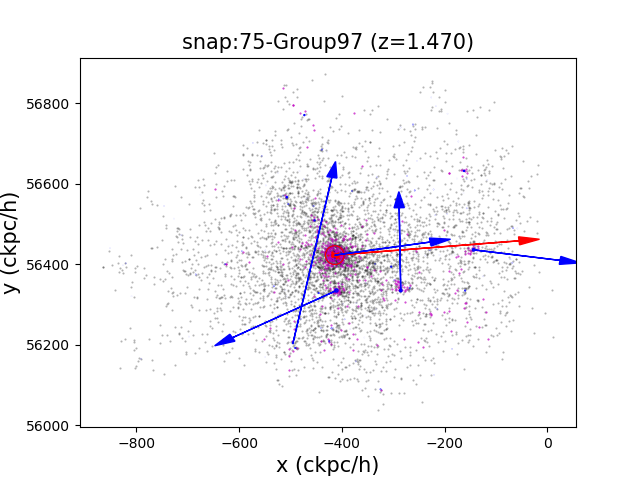
It is important to more clearly understand the physical processes that caused the ejection of galaxy subhalo 476171, as well as those that played a role in causing it to become dark matter deficient. We do not yet have a satisfactory understanding of either of these. In an attempt to elucidate what took place we focus on the progenitor(s) of galaxy subhalo 476171 and the second most massive nearby galaxy subhalo, whose SUBFIND ID is 78979 in snap 80 (), and follow these to snap 110 (). Eighteen snaps between 80 and 110 are shown in Figs. 12 and 13. For clarity these figures show only the more centrally concentrated stellar particles. In these two groups of figures, the green dots represent the stellar particles of subhalo 78979 and its descendants, the red dots are the stellar particles which will leave the FoF group and eventually end up in the subhalo 476171, and the blue dots (along with the red dots) are the stellar particles in the progenitors of galaxy subhalo 476171. (At snap 99 the blue and red dots belong to subhalo 143860, after snap 100 most of the blue dots belong to another subhalo, subhalo 155159 at snap 101.) The green, red, and black arrows are the velocities of the green, red, and blue collections of stars. The arrow in the top-left panels of Figs. 12 and 13 shows the velocity scale. In each panel we also list the snap number, the redshift, and the stellar mass (in units of ) of each of the three star clumps (in three different colors). Table 3 lists these and other relevant masses.171717In Figs. 12 and 13 and Table 3 the listed masses are determined by summing together the masses of all the particles of interest. These are not SubhaloMassType masses, although they do not appreciably differ from SubhaloMassType masses when both can be computed. We note that unlike SubhaloMassType masses, where gas masses include wind particle masses, in our procedure wind particle masses are included with star masses. (Wind particle masses do not contribute significantly to the totals.) We need to use our procedure for the mass determination (instead of using SubhaloMassType) because we want to follow the red stellar mass that eventually ends up in subhalo 476171 from well before the time when subhalo 476171 came into existence.
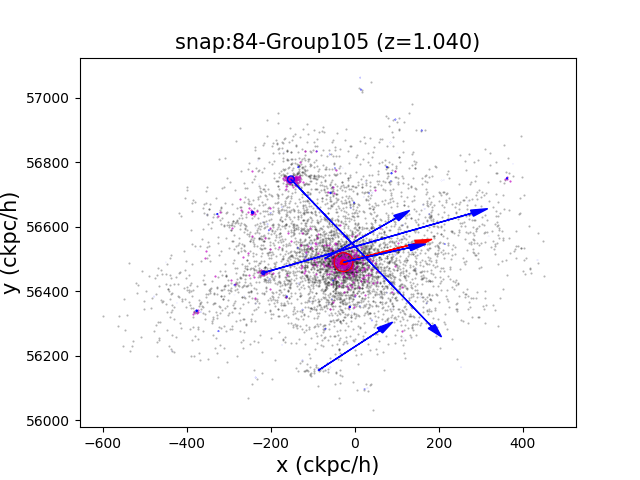
From these figures we see that the green and red+blue subhalos participate in a significant and protracted interaction.181818By also viewing the - projections of snaps 80 to 110 we have verified that the green subhalo passes through the red+blue subhalo. The first part of this interaction, during snaps 84 to 89, results in the braking of the positive direction motion of the red clump relative to the blue stellar particles. Given the length scales involved it is reasonable to assume that the gravitational force is the main cause of the relative motion of the green and red+blue stars and also of the relative motion between the red clump and the blue stars. See Table 3 for the masses involved in these motions. It seems that as the green clump comes in to the red+blue halo (see snaps 84 and 86) it initially more successfully pulls the compact red clump to it, compared to the effect it has on the more diffuse blue star collection (which it distorts by more effectively pulling closer blue stars towards it), and this gives rise to an overall relative velocity between the red and blue star particles.
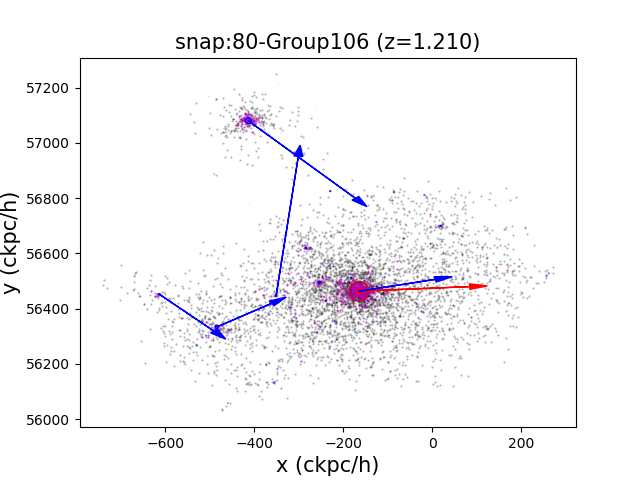
By snap 95 (), the green subhalo has almost turned around and as it moves back farther into the red+blue subhalo it has a bigger effect on the nearer blue particles (the red clump is now farther away), pulling them towards it and causing the blue particles to accelerate in the positive direction and away from the red clump. Until about snap 103 () the green subhalo is on the right of, and closer to, the center of the blue stars and so continues to more effectively pull blue stars away from the red clump. The green subhalo continues to move in a counterclockwise direction and during snaps 104 to 109 it is between the red clump and the center of the blue stars and no longer seems to increase the relative velocity between the blue and red clumps, however by this time the relative velocity is large enough for the red clump to go its own way and escape from the blue clump.
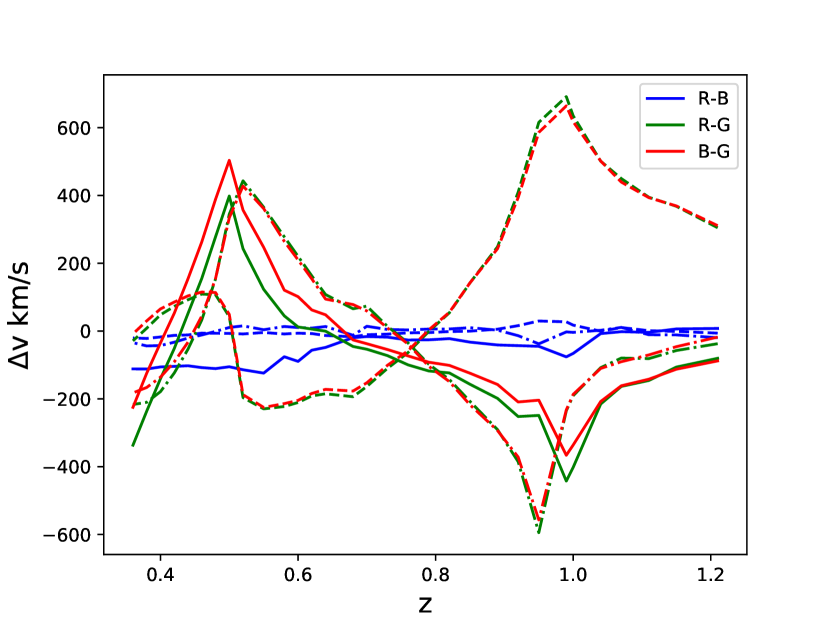
This behavior is also apparent in the redshift evolution of the velocity differences between the red, blue, and green clumps, see Fig. 14.191919We thank J. Peebles for suggesting that we examine these velocity differences. We see that as the green clump of stars makes a first pass through the central region of the red+blue clump of stars during redshifts between about 1 and 0.9, which correspond to snaps 86 and 89, the component of the red and blue velocity difference (the solid blue line in Fig. 14) deviates away from zero to the negative side, because the green clump is more effectively pulling the blue stars towards it. As the green clump continues to move outwards the differential effect it has on the red and blue clumps presumably decreases, resulting in a decrease of the velocity difference between the red and blue clumps. By snap 95 () the green clump has turned around and starts moving in a counterclockwise direction. As it comes back in it is on the right side of the blue clump and closer to it than to the red clump, presumably pulling more effectively on the blue clump than on the red clump and so increasing the component of the velocity difference between the blue and red clumps, that by snap 99 () has settled down to around 100 km/s, with the red stars drifting away in the negative direction from the blue stars.
It seems reasonable, at the level of the big picture, to presume that the tidal effects of gravity are responsible for both the red clump being ejected and for it becoming dark matter deficient, and that the interaction between the green and red+blue clumps was the prime cause of both, with the compactness of the red clump presumably also playing an important role. It is however very desirable to have a better and more granular understanding of this phenomenon, which might require a local simulation with higher resolution.
Table 3 lists masses of these objects from snap 80 to 110 (we do not record black hole particle masses here as these are much smaller). While the green clump is relatively much less massive than the red+blue one (it is only 6% as massive at snap 80), they have a reasonably high relative velocity, and the green clump loses most of its dark matter while interacting with the red+blue one. So it seems likely that gravity has enough to work with to be able to eject the red clump while stripping it of most of its dark matter and a significant amount of its stellar matter, thus creating a massive dark matter deficient galaxy (subhalo 476171).
Interestingly, if galaxy subhalo 476171 is a MUG, then perhaps the formation process we have summarized here can explain how some MUGs can come to exist in low-density environments (Buitrago et al., 2018). Observationally determining the dark matter fraction of MUGs as a function of environment might allow for discrimination between different MUG formation channels (Buitrago et al., 2018).
| Snap (Redshift) | Red+Blue | Blue SW | Red SW | Green | ||||
|---|---|---|---|---|---|---|---|---|
| Gas | DM | SW | Gas | DM | SW | |||
| 80 (1.21) | 17.2 | 876 | 26.4 | 16.3 | 10.1 | 9.81 | 42.5 | 2.88 |
| 81 (1.15) | 18.7 | 892 | 26.3 | 16.2 | 10.1 | 9.49 | 37.5 | 3.22 |
| 82 (1.11) | 19.8 | 901 | 26.3 | 16.2 | 10.1 | 9.05 | 35.5 | 3.33 |
| 83 (1.07) | 22.5 | 929 | 26.2 | 16.2 | 10 | 7.18 | 26.2 | 3.51 |
| 84 (1.04) | 25.2 | 942 | 26.27 | 16.3 | 9.97 | 6.05 | 23.2 | 3.74 |
| 85 (1) | 29.6 | 975 | 26.34 | 16.4 | 9.94 | 3.97 | 15.8 | 3.67 |
| 86 (0.99) | 31.6 | 988 | 26.74 | 16.8 | 9.94 | 2.9 | 11.3 | 3.44 |
| 87 (0.95) | 35 | 1010 | 27.11 | 17.2 | 9.91 | 1.87 | 5.69 | 2.86 |
| 88 (0.92) | 34 | 1010 | 27 | 17.1 | 9.9 | 3.31 | 8.13 | 3.17 |
| 89 (0.89) | 37.1 | 1040 | 27.08 | 17.2 | 9.88 | 2.23 | 7.64 | 3.23 |
| 90 (0.85) | 38.7 | 1070 | 27.06 | 17.2 | 9.86 | 3.11 | 8.17 | 3.37 |
| 91 (0.82) | 41.5 | 1100 | 26.94 | 17.1 | 9.84 | 1.98 | 8.39 | 3.42 |
| 92 (0.79) | 43 | 1110 | 26.93 | 17.1 | 9.83 | 2.45 | 8.73 | 3.49 |
| 93 (0.76) | 23.4 | 1120 | 26.91 | 17.1 | 9.81 | 2.67 | 9.26 | 3.51 |
| 94 (0.73) | 11.3 | 1130 | 27.09 | 17.3 | 9.79 | 3.24 | 8.94 | 3.51 |
| 95 (0.7) | 11.5 | 1120 | 27.18 | 17.4 | 9.78 | 3.57 | 8.98 | 3.63 |
| 96 (0.68) | 12.4 | 1130 | 27.36 | 17.6 | 9.76 | 2.1 | 10.1 | 3.69 |
| 97 (0.64) | 13.8 | 1150 | 27.74 | 18 | 9.74 | 1.06 | 8.23 | 3.32 |
| 98 (0.62) | 14.7 | 1160 | 27.13 | 17.4 | 9.73 | 1.29 | 10.7 | 3.68 |
| 99 (0.6) | 14.8 | 1160 | 27.22 | 17.5 | 9.72 | 0.935 | 9.41 | 3.54 |
| 100 (0.58) | 14.9 | 1110 | 23.11 | 13.4 | 9.71 | 0.781 | 7.85 | 3.32 |
| 101 (0.55) | 15.9 | 1160 | 27.59 | 17.9 | 9.69 | 0.81 | 6.49 | 3.16 |
| 102 (0.52) | 16.7 | 1190 | 28.28 | 18.6 | 9.68 | 0.601 | 3.6 | 2.48 |
| 103 (0.5) | 16.8 | 1190 | 28.37 | 18.7 | 9.67 | 0.737 | 3.28 | 2.41 |
| 104 (0.48) | 17.5 | 1220 | 27.86 | 18.2 | 9.66 | 0.606 | 4.99 | 2.92 |
| 105 (0.46) | 17.3 | 1240 | 27.85 | 18.2 | 9.65 | 0.48 | 5.25 | 2.98 |
| 106 (0.44) | 18.9 | 1270 | 27.94 | 18.3 | 9.64 | 0.458 | 4.95 | 2.89 |
| 107 (0.42) | 20.5 | 1310 | 28.03 | 18.4 | 9.63 | 0.51 | 4.88 | 2.87 |
| 108 (0.4) | 19.1 | 1330 | 28.02 | 18.4 | 9.62 | 0.56 | 5.13 | 2.93 |
| 109 (0.38) | 20.5 | 1370 | 27.91 | 18.3 | 9.61 | 0.563 | 5.34 | 2.98 |
| 110 (0.36) | 22.1 | 1400 | 27.9 | 18.3 | 9.6 | 0.575 | 5.46 | 3.03 |
3 Conclusion
Motivated by the findings of van Dokkum et al. (2018a), we have searched for dark matter deficient galaxy subhalos in the Illustris simulation (www.illustris-project.org, Vogelsberger et al., 2014a) of the CDM cosmogony and have discovered a significant number that seem to have properties similar to those ascribed to ultra-diffuse galaxy NGC1052-DF2 by van Dokkum et al. (2018a). It is of interest to more carefully examine such galaxy subhalos in the Illustris (and future) simulation(s).202020Perhaps a detailed analysis of the Illustris raw particle data can provide more information about the dark matter deficient galaxy subhalos we have found, especially those subhalos which first appear at snap 135. It would be useful to better characterize them, to understand how they form, and to have images of them. On the observational side, if the CDM model and the Illustris simulation are reasonably accurate (and there is no evidence to suggest otherwise), it is of great interest to find such dark matter deficient galaxies (for example, more than 0.7% of SubhaloMassType galaxies should have SubhaloMassType ); they should provide an unusual and valuable perspective on cosmological structure formation and dark matter.
The dark matter deficient galaxy subhalo 476171 is much more massive and an outlier, but the Illustris simulation of the CDM model results in many dark matter deficient () massive () galaxy subhalos. By studying the evolutionary history of subhalo 476171, we see that its progenitor massive subhalo contained a tightly bound cluster of stars. For some reason, perhaps as a consequence of gravitational interaction, this tightly-bound star cluster is kicked out of and escapes from its parent group. Perhaps because some of these stars are so tightly bound together, the massive subhalo 476171 and its stellar content largely preserve their structural integrity during the ejection process, losing only some stars but almost all dark matter, and so resulting in a dark matter deficient massive galaxy subhalo.
While it is clearly important to understand how the dark matter deficient massive galaxy subhalo 476171 (and its less extreme cousins) formed, if the Illustris simulation and the CDM structure formation model are accurate then such objects should exist in the real universe (for example, more than 0.4% of galaxies with SubhaloMassType should have SubhaloMassType ). Due to the large stellar mass of subhalo 476171, its r band magnitude is about , bright enough for us to detect it. It is of great interest to search for such objects; perhaps these are the MUGs.
We are indebted to F. Marinacci, J. Peebles, V. Springel, and M. Vogelsberger for valuable advice, comments, and discussion. We acknowledge valuable discussions with P. Gagrani, C.-G. Park, L. Samushia, and L. Weaver. This work is supported by the National Basic Research Program of China (973 Program, grant No. 2014CB845800), the National Natural Science Foundation of China (grants 11422325, 11373022, and U1831207), the Excellent Youth Foundation of Jiangsu Province (BK20140016), and by DOE grant DE-SC0019038. H.Y. also acknowledges support by the China Scholarship Council for studying abroad.
References
- Alam et al. (2017) Alam, S., Ata, M., Bailey, S., et al. 2017, MNRAS, 470, 2617 [arXiv:1607.03155]
- Blakeslee & Cantiello (2018) Blakeslee, J. P., & Cantiello, M. 2018, arXiv:1808.02176
- Buitrago et al. (2018) Buitrago, F., Ferreras, I., Kelvin, L. S., et al. 2018, arXiv:1807.02534
- Famaey et al. (2018) Famaey, B., McGaugh, S., & Milgrom, M., 2018, arXiv:1804.04167
- Farooq et al. (2013) Farooq, O., Crandall, S., & Ratra, B. 2013, Phys. Lett. B, 726, 72 [arXiv:1305.1957]
- Farooq et al. (2017) Farooq, O., Madiyar, F. R., Crandall, S., & Ratra, B. 2017, ApJ, 835, 26 [arXiv:1607.03537]
- Farooq & Ratra (2013) Farooq, O., & Ratra, B. 2013, ApJ, 766, L7 [arXiv:1301.5243]
- Fischler et al. (1985) Fischler, W., Ratra, B., & Susskind, L. 1985, Nucl. Phys. B, 259, 730
- Genel et al. (2014) Genel, S., Vogelsberger, M., Springel, V., et al. 2014, MNRAS, 445, 175 [arXiv:1405.3749]
- Guth & Pi (1982) Guth, A. H., & Pi, S.-Y. 1982, Phys. Rev. Lett., 49, 1110
- Haridasu et al. (2018) Haridasu, B. S., Luković, V. V., Moresco, M., & Vittorio, N. 2018, arXiv:1805.03595
- Hawking (1982) Hawking, S. W. 1982, Phys. Lett. B, 115, 295
- Hinshaw et al. (2013) Hinshaw, G., Larson, D., Komatsu, E., et al. 2013, ApJS, 208, 19 [arXiv:1212.5226]
- Jesus et al. (2018) Jesus, J. F., Holanda, R. F. L., & Pereira, S. H. 2018, JCAP, 1805, 073 [arXiv:1712.01075]
- Laporte et al. (2018) Laporte, C. F. P., Agnello, A., & Navarro, J. F., 2018, arXiv:1804.04139
- Luković et al. (2018) Luković, V. V., Haridasu, B. S., & Vittorio, N. 2018, arXiv:1801.05765
- Martin (2012) Martin, J. 2012, C. R. Physique, 13, 566 [arXiv:1205.3365]
- Martin et al. (2018) Martin, N. F., Collins, M. L. M,, Longeard, N., & Tollerud, E. 2018, ApJ, in press [arXiv:1804.04136]
- Mitra et al. (2018) Mitra, S., Choudhury, T. R., & Ratra, B. 2018, MNRAS, 479, 4566 [arXiv:1712.00018]
- Moresco et al. (2016) Moresco, M., Pozzetti, L., Cimatti, A., et al. 2016, JCAP, 1605, 014 [arXiv:1601:01701]
- Nusser (2018) Nusser, A. 2018, arXiv:1806.01812
- Ooba et al. (2018a) Ooba, J., Ratra, B., & Sugiyama, N. 2018a, ApJ, 864, 80 [arXiv:1707.03452]
- Ooba et al. (2017) Ooba, J., Ratra, B., & Sugiyama, N. 2017, arXiv:1710.03271
- Ooba et al. (2018b) Ooba, J., Ratra, B., & Sugiyama, N. 2018b, ApJ, in press [arXiv:1712.08617]
- Ooba et al. (2018c) Ooba, J., Ratra, B., & Sugiyama, N. 2018c, arXiv:1802.05571
- Park & Ratra (2018a) Park, C.-G., & Ratra, B. 2018a, arXiv:1801.00213
- Park & Ratra (2018b) Park, C.-G., & Ratra, B. 2018b, arXiv:1803.05522
- Park & Ratra (2018c) Park, C.-G., & Ratra, B. 2018c, arXiv:1807.07421
- Park & Ratra (2018d) Park, C.-G., & Ratra, B. 2018d, arXiv:1809.03598
- Peebles (1982) Peebles, P. J. E. 1982, ApJ, 263, L1
- Peebles (1984) Peebles, P. J. E. 1984, ApJ, 284, 439
- Planck Collaboration (2016) Planck Collaboration, Ade, P. A. R., Aghanim, N., Arnaud, M., et al. 2016, A&A, 594, A13 [arXiv:1502.01589]
- Ratra & Vogeley (2008) Ratra, B., & Vogeley, M. 2008, PASP, 120, 235 [arXiv:0706.1565]
- Ryan et al. (2018) Ryan, J., Doshi, S., & Ratra, B. 2018, MNRAS, 480, 759 [arXiv:1805.06408]
- Scarpa et al. (2018) Scarpa, R., Hernandez, X., Martin, R. A. C., Falomo, R., & López-Corredoira, M. 2018, arXiv:1804.04817
- Scolnic et al. (2017) Scolnic, D. M., Jones, D. O., Rest, A., et al. 2017, arXiv:1710.00845
- Sijacki et al. (2015) Sijacki, D., Vogelsberger, M., Genel, S., et al. 2015, MNRAS, 452, 575 [arXiv:1408.6842]
- Starobinsky (1982) Starobinsky, A. A. 1982, Phys. Lett. B, 117, 175
- Trujillo et al. (2018) Trujillo, I., Beasley, M. A., Borlaff, A., et al. 2018, arXiv:1806.10141
- van Dokkum et al. (2018c) van Dokkum, P., Danieli, S., Cohen, Y., & Conroy, C. 2018c, ApJ, 864, L18 [arXiv:1807.06025]
- van Dokkum et al. (2018b) van Dokkum, P., Cohen, Y., Danieli, S., et al. 2018b, ApJ, 856, L30 [arXiv:1803.10240]
- van Dokkum et al. (2018a) van Dokkum, P., Danieli, S., Cohen, Y., et al. 2018a, Nature, 555, 629 [arXiv:1803.10237]
- Vogelsberger et al. (2013) Vogelsberger, M., Genel, S., Sijacki, D., et al. 2013, MNRAS, 436, 3031 [arXiv:1305.2913]
- Vogelsberger et al. (2014a) Vogelsberger, M., Genel, S., Springel, V., et al. 2014a, Nature, 509, 177 [arXiv:1405.1418]
- Vogelsberger et al. (2014b) Vogelsberger, M., Genel, S., Springel, V., et al. 2014b, MNRAS, 444, 1518 [arXiv:1405.2921]
- Wasserman et al. (2018) Wasserman, A., Romanowsky, A. J., Brodie, J., et al. 2018, arXiv:1807.07069
- Yu et al. (2018) Yu, H., Ratra, B., & Wang, F.-Y. 2018, ApJ, 856, 3 [arXiv:1711.03437]