Asymmetric Electrolytes near Structured Dielectric Interfaces
Abstract
The ion distribution of electrolytes near interfaces with dielectric contrast has important consequences for electrochemical processes and many other applications. To date, most studies of such systems have focused on geometrically simple interfaces, for which dielectric effects are analytically solvable or computationally tractable. However, all real surfaces display nontrivial structure at the nanoscale and have, in particular, nonuniform local curvature. Using a recently developed, highly efficient computational method, we investigate the effect of surface geometry on ion distribution and interface polarization. We consider an asymmetric 2:1 electrolyte bounded by a sinusoidally deformed solid surface. We demonstrate that even when the surface is neutral, the electrolyte acquires a nonuniform ion density profile near the surface. This profile is asymmetric and leads to an effective charging of the surface. We furthermore show that the induced charge is modulated by the local curvature. The effective charge is opposite in sign to the multivalent ions and is larger in concave regions of the surface.
I Introduction
The behavior of electrolytes near interfaces has important consequences for the properties of surfaces and for processes that take place in their vicinity, such as redox reactions in electrochemical capacitorsSimon and Gogotsi (2008), ion transfer at biomembranesShirai et al. (1995), controlling the surface tension of aqueous solutionsWagner (1924); Onsager and Samaras (1934), and establishing colloidal stability via electric double layersHansen and Löwen (2000). Despite being at the very foundation of modern electrochemistry, complete understanding of electrolyte structure at interfaces is still elusive. Direct experimental probes of the electrolyte structure near an interface have long been challengingGrahame and Parsons (1961); Favaro et al. (2016). Theoretical approaches have used the classical Poisson–Boltzmann (PB) model, which offers a good description for dilute symmetric electrolytes, but often breaks down at high concentrations, in asymmetric electrolytes, or near strongly charged surfaces.Rouzina and Bloomfield (1996); Belloni (1998); Levin (2002) This breakdown is due to features ignored in the mean-field model, such as finite ion size Stern (1924); Andresen et al. (2004), hydration shells Randles (1977), dielectric effects Wagner (1924), and the molecular-scale structure of the liquid solution Luo et al. (2006). Many refinements in the theory have been made, including the modified PB equationBorukhov, Andelman, and Orland (1997), the Born–Green–YvonHenderson (1983) and the hypernetted chain approximation Lozada-Cassou, Saavedra-Barrera, and Henderson (1982), charge renormalization Ding, Lu, and Xing (2016), and the inclusion of ionic polarization Levin (2009). However, we are still far from a complete description.
Surface structure can have a strong influence on interfacial properties. In fact, physical roughness should be carefully considered in many applications Pajkossy (1994); Daikhin, Kornyshev, and Urbakh (1996); Vrijenhoek, Hong, and Elimelech (2001). For example, the Derjaguin–Landau–Verwey–Overbeek (DLVO) interaction, determined by the repulsive double layer and the attractive van der Waals interaction, is significantly different for rough surfaces than for perfectly smooth ones Bhattacharjee, Ko, and Elimelech (1998); Bowen and Doneva (2000); Bowen, Doneva, and Stoton (2002); Bradford and Torkzaban (2013). Moreover, due to the permittivity mismatch at the interface, ions induce polarization charges on the surface, which are nontrivial for surfaces with nonzero curvature.
Numerical solutions to the polarization problem offer a possible path to the investigation of these structured interfaces. However, even with the rapid growth of computational power, previous simulation studies have primarily focused on geometrically simple surfaces, where the method of image charges or other techniques can be exploited Messina (2002); Messina et al. (2002); dos Santos, Bakhshandeh, and Levin (2011); Lue and Linse (2011); Jing et al. (2015); Antila and Luijten (2018). For structured interfaces one can resort to finite-difference or finite-element methods. Such algorithms involve discretization of the full three-dimensional space, while (for systems with piecewise uniform permittivity) the induced charges only reside at the interface. Thus, these methods are inefficient for dynamic simulation purposes, which require updating the polarization charges at each time step. Recently, boundary element method (BEM)-based approaches have gained popularity Barros and Luijten (2014). Unlike volume discretization methods, the BEM only discretizes the interface and solves the Poisson equation directly to obtain the polarization charges, which then can be readily utilized in molecular dynamics (MD) simulations. In this paper, we apply the iterative dielectric solver (IDS), a recently developed fast BEM-based dielectric algorithm optimized for MD simulations,Barros, Sinkovits, and Luijten (2014); Wu and Luijten (2018) that has been demonstrated to be competitive to image-based methods Gan et al. (2015), to study the structured interfaces. The IDS has been applied to study complicated dielectric geometries such as patchy colloidsWu, Han, and Luijten (2016); Han, Wu, and Luijten (2016) and self-assembly in binary suspensions.Barros and Luijten (2014)
The surface structures that are of interest have nanoscale dimensions, making first-principle or all-atom simulations infeasible. We therefore employ a coarse-grained model with implicit solvent, which captures excluded-volume effects effects, ionic interactions and concentration fluctuations, and the polarization effects. To focus on the dielectric effects, we study neutral dielectric interfaces, where the electrostatic interaction between the interface and the ions is purely due to surface polarization charges. To complement the simulations we analytically study the same system to determine the contribution to the electric potential by charges near the interface due to their interaction with the surface. This calculation identifies the origin of the charge accumulation at the surface and its dependence on curvature.
II Model and method
We consider a neutral solid–liquid interface , separating a solid with uniform relative permittivity from a liquid with uniform relative permittivity . The surface is assumed smooth so that an outward (i.e., pointing to the liquid phase) normal unit vector is defined at each surface point . The surface polarization charge density satisfies the boundary equation
| (1) |
where is the vacuum permittivity, is the mean relative permittivity, and is the permittivity contrast. The electric field includes contributions from all free and bound charges, i.e., the ions in the liquid medium as well as the surface polarization charge. Explicitly,
| (2) | |||||
where an infinitesimal disk is excluded to avoid divergence of the layer potential. is the bulk free charge density in the liquid, representing the ion distribution. Combined, Eqs. (1) and (2) result in an integral equation for the surface charge that must to be solved self-consistently. Analytical solutions only exist for simple geometries, but numerical solution is possible for general geometries via surface discretization. We assume that across each discretized surface element the surface charge density is distributed uniformly and use a one-point quadrature to evaluate Eq. (2). Equation (1) can then be transformed into a matrix equation, which in the IDS is solved efficiently via a combination of a fast Ewald summation method and the generalized minimal residual (GMRES) method; see Ref. 34 for a detailed description of the IDS. Addressing the interactions of the ions with the dielectric interface in this manner allows us to carry out simulations of a primitive model in this environment. We model the hydrated ions as equisized spheres of diameter Å with point charges of valence embedded at their centers.
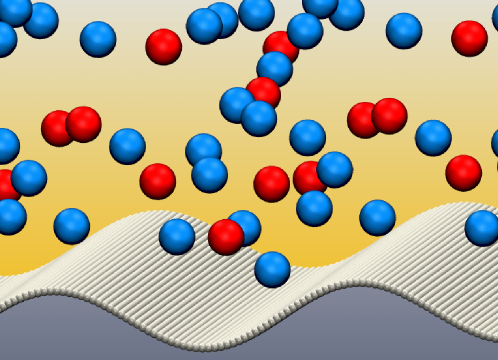
In nature, biomolecular structures, such as membranes and proteins, often display complicated surface morphology. Likewise, synthetic materials are often not perfectly planar. As a first model, we consider a solid–liquid interface with sinusoidal surface topography (Fig. 1). The system is considered as piecewise uniform, with a liquid electrolyte above a low-permittivity solid medium. We use for the solid, representing materials such as lipid bilayersMashaghi et al. (2012); Dilger et al. (1979); Tian (2010). The local height of the solid–liquid interface is described by , where is the amplitude of the height oscillation and its wavelength. We start our discussion with a configuration with and ; below we will vary the amplitude and the surface structure. Since the length scale of the “roughness” of our surface is much larger than the size of a water molecule, we treat the background solvent as an implicit dielectric continuum of relative permittivity . The interface is discretized into a curved rectangular mesh. To capture the excluded-volume effects and the atomistic nature of the surface, each mesh point interacts with the ions via a shifted-truncated Lennard-Jones (LJ) interaction. The distance between adjacent mesh points is , resulting in a mesh of elements (at amplitude ; more at larger amplitude). Such a fine mesh also guarantees an error less than in the force calculation of the IDS for worst-case configurations, i.e., when ions approach the surface most closely.
For symmetric electrolytes, polarization charges induced by negative and positive ions must cancel on average. However, for asymmetric electrolytes more interesting effects may occur. We focus on 2:1 electrolytes at a representative concentration of 50 mM. The simulation cell is periodic in the and directions, with lateral dimensions . The cell is nonperiodic in the direction with height , extending from to . The dielectric interface is centered at , so that the electrolyte only resides in the upper half of the box. This slab height is sufficient to eliminate boundary effects. The temperature is controlled via a Langevin thermostat with damping time , where is the unit time, with Boltzmann’s constant and the ion mass. The system is kept at room temperature, so that the Bjerrum length . All simulations are performed with a time step . The relative accuracy of the Ewald summation is and periodicity effects in the direction are suppressed via a vacuum layer of and a dipole correction. For each parameter choice we performed independent runs of time steps each, corresponding to independent samples. In the presence of dielectric effects, we chose runs that were times shorter, owing to the computational cost involved.
III Mean-field model
To better understand the features observed in the simulations presented below, we analyze the properties of solutions to Eq. (1) for a single ion of valence near the interface. These results indicate the dependence of induced charges on curvature. The solution is obtained as a perturbative expansion in the surface amplitude . Once the induced polarization charge is determined, the excess energy of the ion due to the polarization effects follows as , where is the electric potential due only to the polarization charges. The Boltzmann weight is then used to determine the relative depletion of ions at the interface.
The perturbative approach expands the polarization potential as and similar expansions are applied to the charge density and the geometric quantities. The order of a term in the expansion is the power of the modulation amplitude that appears in the expression. The zeroth order of this calculation corresponds to the case of a single ion near a flat interface. In that case, we have . In this flat geometry, the normal component of the electric field is due only to the single bulk ion. Each surface polarization charge in the first term on the right-hand side of Eq. (2) produces (at any other point on the surface) a field parallel to the surface and does not contribute to the normal component. Note that the integral excludes a small region around the evaluation point, so that a surface charge located at the point of evaluation does not contribute to the electric field. Thus, we have , where is a point at the surface and we take the ion position as . Integration of the Coulomb potential due to the resulting surface charge density gives the standard image-charge potential at the position of the ion: . The resulting energy of the ion is . This expression is positive when the solid phase has a lower permittivity.
The first-order term in the expansion of the potential is associated with deformation of the surface. To simplify its calculation, we consider the limit where the ion is brought toward the interface. In addition, we first consider the case where its position coincides with a peak of the deformed surface. Results for other positions follow from this calculation. According to the image-charge result, the energy in this limit is singular but the exclusion of a small region around the ion renders the result finite. We take the excluded region as spherical, with radius . That is, we use the original distance of the ion to the surface as the cutoff for the divergent terms. This choice is not essential but simplifies the presentation of the results. The evaluation of the potential retains an explicit dependence on the wavelength, which is the key feature of interest in our analysis. A more complex calculation, maintaining the ion at a finite distance from the interface, gives similar results. In this limit, the first-order terms in Eq. (1) read . Other terms in the expansion of the equation cancel owing to the geometry used. The first-order term in the expression for the normal is . Solving for the charge density we obtain . The electric potential follows from the integration of the product of this charge density and the Coulomb potential, . At the ion position, the leading correction term is , with a positive constant. For positive ions this excess potential is negative. At other positions, the leading correction to the potential is approximately . We now use the fact that the mean curvature of the surface is . This curvature is negative in convex regions, such as those around the peaks of the surface. Our result for the potential can be expressed in terms of the curvature, . We observe that this expression can be used as an approximation for the potential in cases with a different modulation of the surface. The resulting first-order contribution to the interaction energy between ion and surface is .
For a particle near the surface the dominant contribution to its energy is its interaction with the polarization charges. The ion distribution near the surface therefore follows from the Boltzmann population factor . Expanding the exponential factor and multiplying by the bulk densities, we obtain the excess charge density near the surface. Within an atomic diameter from the surface, the net accumulated charge per unit area takes the approximate form
| (3) | |||||
where is the bulk number density of species , and the integration constants and are positive according to the functional form of the estimated potentials. The values of the constants can be estimated in terms of the parameters of the system but we note that, within the calculation outlined above, they depend on the specific cutoff chosen. Equation (3) retains the dependence on valencies and characteristic lengths. In particular, we emphasize that for asymmetric electrolytes the result is nonzero. The net charge is a result of the asymmetric depletion of ions near the interface. Additionally, the sign of the first-order term indicates that the depletion is stronger at concave regions. This result ignores ion correlations and is based on the properties of the direct interaction of individual ions with the dielectric interface. Yet, as shown below, it reproduces the key features of the charge distribution observed in simulations, indicating that it likely represents the dominant contribution.
IV Results and Discussion
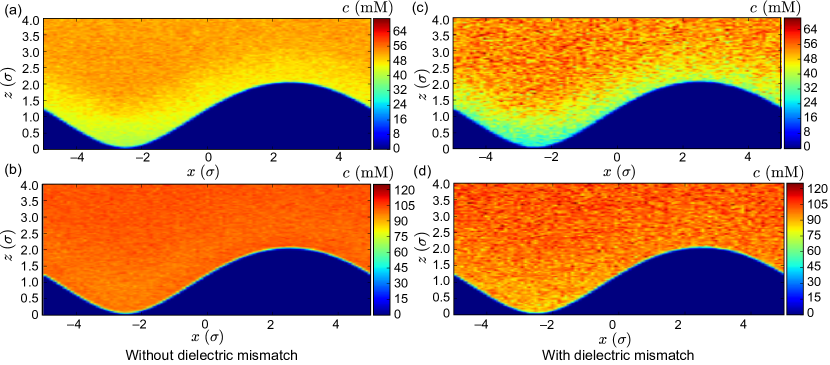
Figure 2 shows the ion number density for the 50 mM 2:1 electrolyte near the modulated surface. In the absence of dielectric contrast (left-hand panels in Fig. 2) the bulk monovalent ion density is almost exactly twice that of the divalent ions; only close to the surface a small depletion occurs, which is more pronounced for the divalent ions. This effect appears as ions near the interface lack a symmetric shell of screening counterions. The asymmetric counterion shell pulls the ions towards the bulkGan et al. (2015). These results serve as a baseline to assess the effects of the case with dielectric contrast.
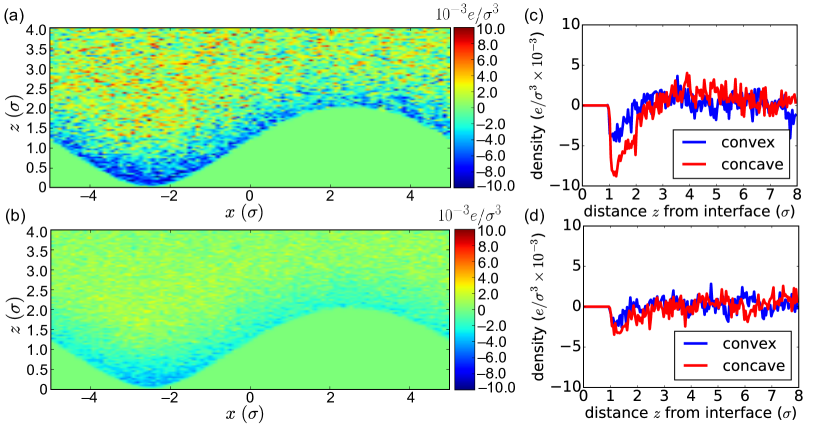
In the presence of dielectric contrast (right-hand panels in Fig. 2) we observe a stronger depletion of both charged species, owing to the repulsive polarization charges. The depletion now extends further into the bulk, as can be expected from the long-range nature of the electrostatic interactions. More importantly, since the interaction between the ion and its polarization charge scales as , the divalent ions are significant more depleted near the surface than the monovalent ions. This asymmetry breaks the concentration balance that is fulfilled in the bulk, so that charge neutrality is violated in the vicinity of the surface, with a net negative charge cloud above the surface [Fig. 3(a)]. Strictly, this effect also occurs in the absence of dielectric mismatch [Fig. 3(b)] owing to the above-mentioned difference in asymmetry of the counterion shell, but the net charge density is substantially stronger in the presence of dielectric contrast. Also, we observe that the depletion effect is stronger near concave domains of the surface than near convex ones [Fig. 3(c)]. This result matches the modulation of the excess charge found in our analytic calculation Eq. (3).
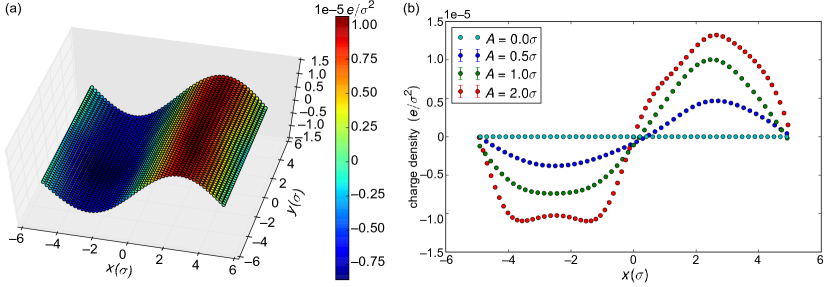
Along with the net ionic charge density in the electrolyte, the simulations also provide the average induced surface charge density. Although globally the net induced charge of the interface must vanish, it presents persistent nonzero averages as a function of position. Consistent with the modulation of the ionic charge density, the average induced charge density is positive at convex regions and negative at the concave regions, as illustrated by the time average in Fig. 4(a).
To further examine the dependence of the induced charge and ion charge density on surface structure we systematically vary the parameters of the modulated surface. We perform simulations for different modulation amplitudes ranging from to . Figure 4(b) shows the induced charge density averaged over the direction, along which the properties of the system are invariant. For large amplitudes, we observe that the induced charge density amplitude is larger and varies more rapidly at the peak than in the trough. At low amplitude, the induced charge density itself mimics the sinusoidal variation of the surface, but this similarity breaks down at high amplitude (). This break-down reflects steric effects, where ions cannot reach the bottom of the trough once the gap near the minimum becomes too narrow. It is noteworthy that asymmetries in ion size could further complicate the observed density distributions. In particular, it is possible that nonuniform ion distributions could even be reproduced for charge-symmetric salts with size asymmetry between the anions and cations Messina et al. (2002).
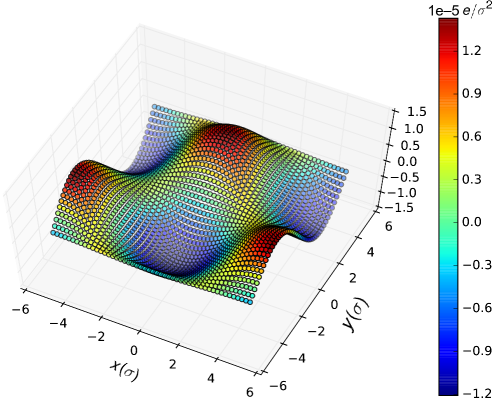
Lastly, the phenomenon we have found in our simulations as well as the PB analysis, of curvature-dependent charge depletion, is generic and not limited to surfaces with modulation in a single dimension. Indeed, it can be generalized to other structures. For example, Fig. 5 illustrates the net surface polarization charge pattern of the same 50 mM 2:1 electrolyte above a structured dielectric interface with permittivity mismatch 80/2, but a surface modulation in both and directions, . Similar to our previous results, the valleys of the surface acquire a negative surface polarization charge, whereas the peaks carry a positive induced charge. We note that periodicity of the modulation is not a requirement for the phenomenon to occur.
The simulations presented, along with the arguments based on single-ion interactions with the surface, demonstrate that the effect observed is universal. The local curvature of the surface always induces effective surface polarization and net ion charge accumulation in the presence of asymmetric electrolytes. The effect should be observable not only on surfaces that bound an electrolyte, but also at the surface of electrolyte-immersed colloids. Our findings can be applied to the design of surfaces with useful physical–chemical properties.
Acknowledgements.
This research was supported through award 70NANB14H012 from the U.S. Department of Commerce, National Institute of Standards and Technology, as part of the Center for Hierarchical Materials Design (CHiMaD), the National Science Foundation through Grant No. DMR-1610796, and the Center for Computation and Theory of Soft Materials (CCTSM) at Northwestern University. We thank the Quest high-performance computing facility at Northwestern University for computational resources.References
- Simon and Gogotsi (2008) P. Simon and Y. Gogotsi, “Materials for electrochemical capacitors,” Nature Mater. 7, 845–854 (2008).
- Shirai et al. (1995) O. Shirai, S. Kihara, Y. Yoshida, and M. Matsui, “Ion transfer through a liquid membrane or a bilayer lipid membrane in the presence of sufficient electrolytes,” J. Electroanal. Chem. 389, 61–70 (1995).
- Wagner (1924) C. Wagner, “Die Oberflächenspannung verdünnter Elektrolytlösungen,” Phys. Z. 25, 474–477 (1924).
- Onsager and Samaras (1934) L. Onsager and N. N. T. Samaras, “The surface tension of Debye-Hückel electrolytes,” J. Chem. Phys. 2, 528–536 (1934).
- Hansen and Löwen (2000) J.-P. Hansen and H. Löwen, “Effective interactions between electric double layers,” Ann. Rev. Phys. Chem. 51, 209–242 (2000).
- Grahame and Parsons (1961) D. C. Grahame and R. Parsons, “Components of charge and potential in the inner region of the electrical double layer: Aqueous potassium chloride solutions in contact with mercury at 25∘,” J. Am. Chem. Soc. 83, 1291–1296 (1961).
- Favaro et al. (2016) M. Favaro, B. Jeong, P. N. Ross, J. Yano, Z. Hussain, Z. Liu, and E. J. Crumlin, “Unravelling the electrochemical double layer by direct probing of the solid/liquid interface,” Nature Comm. 7, 12695 (2016).
- Rouzina and Bloomfield (1996) I. Rouzina and V. A. Bloomfield, “Macroion attraction due to electrostatic correlation between screening counterions. 1. Mobile surface-adsorbed ions and diffuse ion cloud,” J. Phys. Chem. 100, 9977–9989 (1996).
- Belloni (1998) L. Belloni, “Ionic condensation and charge renormalization in colloidal suspensions,” Colloids Surf. A 140, 227–243 (1998).
- Levin (2002) Y. Levin, “Electrostatic correlations: from plasma to biology,” Rep. Prog. Phys. 65, 1577–1632 (2002).
- Stern (1924) O. Stern, “Zur Theorie der elektrolytischen Doppelschicht,” Ber. Bunsenges. Phys. Chem. 30, 508–516 (1924).
- Andresen et al. (2004) K. Andresen, R. Das, H. Y. Park, H. Smith, L. W. Kwok, J. S. Lamb, E. J. Kirkland, D. Herschlag, K. D. Finkelstein, and L. Pollack, “Spatial distribution of competing ions around DNA in solution,” Phys. Rev. Lett. 93, 248103 (2004).
- Randles (1977) J. E. B. Randles, “Structure at the free surface of water and aqueous electrolyte solutions,” Phys. Chem. Liq. 7, 107–179 (1977).
- Luo et al. (2006) G. Luo, S. Malkova, J. Yoon, D. G. Schultz, B. Lin, M. Meron, I. Benjamin, P. Vanýsek, and M. L. Schlossman, “Ion distributions near a liquid-liquid interface,” Science 311, 216–218 (2006).
- Borukhov, Andelman, and Orland (1997) I. Borukhov, D. Andelman, and H. Orland, “Steric effects in electrolytes: A modified Poisson–Boltzmann equation,” Phys. Rev. Lett. 79, 435–438 (1997).
- Henderson (1983) D. Henderson, “Recent progress in the theory of the electric double layer,” Prog. Surf. Sci. 13, 197–224 (1983).
- Lozada-Cassou, Saavedra-Barrera, and Henderson (1982) M. Lozada-Cassou, R. Saavedra-Barrera, and D. Henderson, “The application of the hypernetted chain approximation to the electrical double layer: Comparison with Monte Carlo results for symmetric salts,” J. Chem. Phys. 77, 5150–5156 (1982).
- Ding, Lu, and Xing (2016) M. Ding, B.-S. Lu, and X. Xing, “Charged plate in asymmetric electrolytes: One-loop renormalization of surface charge density and Debye length due to ionic correlations,” Phys. Rev. E 94, 042615 (2016).
- Levin (2009) Y. Levin, “Polarizable ions at interfaces,” Phys. Rev. Lett. 102, 147803 (2009).
- Pajkossy (1994) T. Pajkossy, “Impedance of rough capacitive electrodes,” J. Electroanal. Chem. 364, 111–125 (1994).
- Daikhin, Kornyshev, and Urbakh (1996) L. I. Daikhin, A. A. Kornyshev, and M. Urbakh, “Double-layer capacitance on a rough metal surface,” Phys. Rev. E 53, 6192–6199 (1996).
- Vrijenhoek, Hong, and Elimelech (2001) E. M. Vrijenhoek, S. Hong, and M. Elimelech, “Influence of membrane surface properties on initial rate of colloidal fouling of reverse osmosis and nanofiltration membranes,” J. Membr. Sci. 188, 115–128 (2001).
- Bhattacharjee, Ko, and Elimelech (1998) S. Bhattacharjee, C.-H. Ko, and M. Elimelech, “DLVO interaction between rough surfaces,” Langmuir 14, 3365–3375 (1998).
- Bowen and Doneva (2000) W. R. Bowen and T. A. Doneva, “Atomic force microscopy studies of membranes: Effect of surface roughness on double-layer interactions and particle adhesion,” J. Colloid Interface Sci. 229, 544–549 (2000).
- Bowen, Doneva, and Stoton (2002) W. R. Bowen, T. A. Doneva, and J. A. G. Stoton, “The use of atomic force microscopy to quantify membrane surface electrical properties,” Colloids Surf. A 201, 73–83 (2002).
- Bradford and Torkzaban (2013) S. A. Bradford and S. Torkzaban, “Colloid interaction energies for physically and chemically heterogeneous porous media,” Langmuir 29, 3668–3676 (2013).
- Messina (2002) R. Messina, “Image charges in spherical geometry: Application to colloidal systems,” J. Chem. Phys. 117, 11062–11074 (2002).
- Messina et al. (2002) R. Messina, E. González-Tovar, M. Lozada-Cassou, and C. Holm, “Overcharging: The crucial role of excluded volume,” Europhys. Lett. 60, 383–389 (2002).
- dos Santos, Bakhshandeh, and Levin (2011) A. P. dos Santos, A. Bakhshandeh, and Y. Levin, “Effects of the dielectric discontinuity on the counterion distribution in a colloidal suspension,” J. Chem. Phys. 135, 044124 (2011).
- Lue and Linse (2011) L. Lue and P. Linse, “Macroion solutions in the cell model studied by field theory and Monte Carlo simulations,” J. Chem. Phys. 135, 224508 (2011).
- Jing et al. (2015) Y. Jing, V. Jadhao, J. W. Zwanikken, and M. Olvera de la Cruz, “Ionic structure in liquids confined by dielectric interfaces,” J. Chem. Phys. 143, 194508 (2015).
- Antila and Luijten (2018) H. S. Antila and E. Luijten, “Dielectric modulation of ion transport near interfaces,” Phys. Rev. Lett. 120, 135501 (2018).
- Barros and Luijten (2014) K. Barros and E. Luijten, “Dielectric effects in the self-assembly of binary colloidal aggregates,” Phys. Rev. Lett. 113, 017801 (2014).
- Barros, Sinkovits, and Luijten (2014) K. Barros, D. Sinkovits, and E. Luijten, “Efficient and accurate simulation of dynamic dielectric objects,” J. Chem. Phys. 140, 064903 (2014).
- Wu and Luijten (2018) H. Wu and E. Luijten, “Accurate and efficient numerical simulation of dielectrically anisotropic particles,” J. Chem. Phys. 149 (2018), in press.
- Gan et al. (2015) Z. Gan, H. Wu, K. Barros, Z. Xu, and E. Luijten, “Comparison of efficient techniques for the simulation of dielectric objects in electrolytes,” J. Comp. Phys. 291, 317–333 (2015).
- Wu, Han, and Luijten (2016) H. Wu, M. Han, and E. Luijten, “Dielectric effects on the ion distribution near a Janus colloid,” Soft Matt. 12, 9575–9584 (2016).
- Han, Wu, and Luijten (2016) M. Han, H. Wu, and E. Luijten, “Electric double layer of anisotropic dielectric colloids under electric fields,” Eur. Phys. J. Special Topics 225, 685–698 (2016).
- Mashaghi et al. (2012) A. Mashaghi, P. Partovi-Azar, T. Jadidi, N. Nafari, P. Maass, M. R. Rahimi Tabar, M. Bonn, and H. J. Bakker, “Hydration strongly affects the molecular and electronic structure of membrane phospholipids,” J. Chem. Phys. 136, 114709 (2012).
- Dilger et al. (1979) J. P. Dilger, S. G. A. McLaughlin, T. J. McIntosh, and S. A. Simon, “The dielectric constant of phospholipid bilayers and the permeability of membranes to ions,” Science 206, 1196–1198 (1979).
- Tian (2010) P. Tian, “Computational protein design, from single domain soluble proteins to membrane proteins,” Chem. Soc. Rev. 39, 2071–2082 (2010).
- Shen, Li, and Olvera de la Cruz (2017) M. Shen, H. Li, and M. Olvera de la Cruz, “Surface polarization effects on ion-containing emulsions,” Phys. Rev. Lett. 119, 138002 (2017).