Enhanced oxygen solubility in metastable water under tension
Abstract
Despite its relevance in numerous natural and industrial processes, the solubility of molecular oxygen has never been directly measured in capillary condensed liquid water. In this article, we measure oxygen solubility in liquid water trapped within nanoporous samples, in metastable equilibrium with a subsaturated vapor. We show that solubility increases two-fold at moderate subsaturations (). This evolution with relative humidity is in good agreement with a simple thermodynamic prediction using properties of bulk water, previously verified experimentally at positive pressure. Our measurement thus verifies the validity of this macroscopic thermodynamic theory to strong confinement and large negative pressures, where significant non-idealities are expected. This effect has strong implications for important oxygen-dependent chemistries in natural and technological contexts.
I Introduction
Many essential chemical processes in the environment and in technological applications involve reaction of solvated gases, typically in aqueous conditions: before reaching reactive sites, gas species are captured from the atmosphere by dissolution in a solvent. Examples include gases like molecular oxygen, or dioxygen, for biochemistry and respirationIngraham and Meyer (1985), geochemistrySleep (2005), corrosionGleeson (1941); McIntire et al. (1990), soil remediationFry et al. (1997), metallurgyMiller et al. (1998); Greenwood and Earnshaw (1998) and cathodic reductionsDamjanovic (1992); Girishkumar et al. (2010); molecular nitrogen for nitrogen fixation in soils Postgate (1976); and carbon dioxide for photosynthesis Rabinowitch (1969), carbon dioxide sequestration and the formation of carbonates Berner et al. (1983); Morse et al. (2007). In these scenarios, solubility defines the concentration of dissolved solute; in turn, concentration controls rates of mass transfer and reaction Levich (1962). In general, the solvent is present as an absorbate, in confinement within pores, or both.
Significant research has been conducted to describe the dynamics and the equilibrium state for the adsorption of species Bruch et al. (1997); Thommes et al. (2015); Alba-Simionesco et al. (2006); Soprunyuk et al. (2016). The topic of gas solubility in nanoconfined solvents has more specifically received significant attention over the past two decades Mercury et al. (2003); Lassin et al. (2005); Luzar and Bratko (2005); Miachon et al. (2008); Pera-Titus et al. (2009); Rakotovao et al. (2010); Ho et al. (2011); Clauzier et al. (2012); Soubeyrand-Lenoir et al. (2012); Ho et al. (2013, 2015); Sánchez-González et al. (2016); Lassin et al. (2016). Model predictions, numerical simulations as well as experiment indicate that the solubility of gases tends to be larger in nanoconfined solvents than in the bulk. Two perspectives on this oversolubility have emerged in the literature.
Starting with simulations by Luzar and Bratko Luzar and Bratko (2005); Bratko and Luzar (2008) and experiments by Miachon et al. Miachon et al. (2008), a literature on oversolubility in nanoconfined solvents emerged in the context of catalysis. These studies focused on gas solubilities in synthetic mesoporous matrices wetted with organic solvents or water. These studies document dramatically increased solubilities (over ten-fold) of , and non-condensing organics as the confinement of the solvent increases and the solvent loading of the pore space decreases Luzar and Bratko (2005); Miachon et al. (2008); Ho et al. (2011, 2013, 2015). These investigators explain the observed oversolubility by a combination of adsorption at the pores wall and at the liquid-gas meniscus and enhanced solvation due to confinement induced layering of the solvent molecules, depending on the chemical character of the host matrix, the solvent and the solute.
Simultaneously, research led by Mercury and collaborators have emphasized the importance of capillary stress in solvents on the equilibrium constants of dissolution from both solid phases and gases in the context of geochemistry Mercury (1997); Mercury and Tardy (1997); Lassin et al. (2005); Pettenati et al. (2008). In the context of a solvent condensed in small pores, the capillary stress is a reduction of pressure (possibly down to negative values) controlled by Kelvin equilibrium with an unsaturated atmosphere of the solvent’s vapor; concavely curved menisci pinned at the mouth of the wettable pores maintain the difference in pressure between the gas phase (positive pressure, ) and that of the solvent (reduced or even negative pressure, ). The reduction of pressure in the pore solvent modifies solubilities according to the rules of classical thermodynamics of bulk substances. In particular, as discussed in detail below, for solutes with positive partial molar volumes of mixing, one expects solubility to increase with decreasing solvent pressure. With a focus on water as a solvent in geological contexts (i.e. porous minerals as hosts), these investigators have used state-of-the-art descriptions Helgeson et al. (1981) of aqueous solutions as a function of pressure, temperature and composition to predict the dependence of solubilities on the saturation of the water vapor (relative humidity where is the saturation pressure) with which the pore liquid is in equilibrium Mercury et al. (2003). With elegant analysis and experimentation they have shown that this Kelvin mechanism can explain measured equilibria within hydrated reactive minerals as a function of the of water vapor Lassin et al. (2005, 2016). Of note for our study, these works provide convincing yet indirect evidence that the solubilities of and increase with decreasing due to the reduced pressure within pore solvent.
Experiments to measure solubility in nanoconfined solvents have used both macroscopic and microscopic techniques. Some studies Lassin et al. (2005, 2016); Ho et al. (2011, 2013, 2015); Clauzier (2014); Clauzier et al. (2012); Pera-Titus et al. (2009) used macroscopic measurements of phase equilibrium, for example by measuring the equilibrium partial pressure of in contact with hydrated carbonate mineral Lassin et al. (2016) or of in contact with a mesoporous matrix wetted by organic solvents Clauzier et al. (2012); Pera-Titus et al. (2009). Miachon et al., on the other hand, used integrate peak size in NMR spectra of confined solutions to extract solute concentrations Miachon et al. (2008).
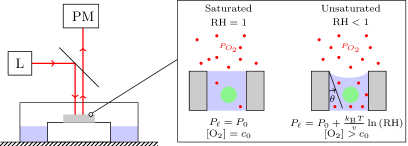
In this work, we show that the solubility of molecular oxygen () in capillary condensed water in the pores of a wettable solid increases when the of the gas atmosphere decreases (see Fig. 1). To do so we introduce a new microscopic technique based on phosphorescence lifetime to evaluate relative changes in oxygen concentration in liquid water in the pores of two porous media with pore radii of a few nanometers. This study represents the first direct measurement of -solubility in nanoconfinement as a function of the degree of vapor saturation. To explain our results, we adopt the Kelvin mechanism of Mercury et al., although with simpler assumptions about the properties of the solvent. This model successfully captures the observed evolutions and is consistent with previous studies on oxygen solubility in water under high positive pressure Krichevsky and Kasarnovsky (1935); Taylor (1978).
We organize the remainder of our presentation as follows. First, we explain in more detail the Kelvin mechanism leading to equilibrium between pore liquid and an unsaturated vapor and its consequences on the solubility of gases. Second, we describe the experimental setup and present the phosphorescent dye and the porous media used in the study. Then, we show the results obtained from the experiments and compare them with theoretical predictions. Finally, we discuss these results relative to the aforementioned literature.
II Theoretical background
Fig. 1 presents our experimental system. In the expanded view, we show an individual pore containing liquid water in equilibrium with a gas phase containing oxygen and either saturated water vapor (left) or unsaturated vapor (right). This simple representation of the pore architecture does not capture the full complexity of pores within the porous media studied here (Vycor and porous silicon) with respect to interconnectedness, distribution of pore size, or surface roughness (see section 1 in SI for more details on porous media). Nonetheless, the consideration of a simplified pore geometry (cylindrical with smooth walls ans uniform diameter) allows us to capture the relevant physics for this study.
In the following theoretical development, we assume that the macroscopic thermodynamic properties and relations remain relevant in the pore solvent despite significant confinement (pore diameters below ). By confronting the predictions of this approach with our experimental observations (see Results section), we show that, within the context of this study, these macroscopic arguments are indeed relevant. We do not exclude the possibility that nanoscale confinement has some influence on the properties of the pore liquid, we simply conclude that any such effects are not resolvable by our measurements of the variation of solubility with imposed relative humidity in pores of radius greater that .
Classical arguments from thermodynamics predict that a capillary condensed pore liquid in equilibrium with a subsaturated vapor exists in a superheated state at reduced pressure Caupin et al. (2012); Wheeler and Stroock (2009); Chen et al. (2016) defined by the Kelvin-Laplace relation Wheeler and Stroock (2008); Gor et al. (2017):
| (1) |
where is the total gas pressure, is the molar density of the liquid phase, is the relative humidity of the gas phase ( being vapor saturation pressure), is the surface tension (for pure bulk water, but this value could depend on the curvature of the meniscus and of the concentration of dissolved gases) of the liquid and is the contact angle with the solid at the pore mouth. Equation (1) predicts that the pressure in the pore liquid decreases (and eventually becomes negative) as drops; this state persists until cavitation occurs or until the contact angle of the meniscus reaches its receding value. Modest changes in should induce large changes in the pressure experienced in the adsorbate: for instance, while pressure in saturated conditions () is about , it decreases to for a moderate unsaturation .
We Vincent et al. (2014, 2016, 2017) and other groups Gruener et al. (2009); Huber (2015) have recently shown that predictions of Eq. (1) hold to extremes of confinement (pore radius down to ) and pressure (). In the following, we use Eq. (1) to interpret responses to changes in in terms of changes in solvent pressure. This approach provides a simple route to pursue an unprecedented study of solubility at reduced pressures, extending previous studies conducted under elevated pressures Taylor (1978).
The effect of solvent pressure on the solubility can be modelled by using simple arguments based on macroscopic thermodynamics. If we assume that the partial molar volume of oxygen in water is independent of pressure, Gibbs-Duhem equation can be easily integrated to give the change of chemical potential with pressure. If we further assume that the gas phase is ideal, we get the Krichevsky and Kasarnovsky equation Krichevsky and Kasarnovsky (1935):
| (2) |
We provide a derivation of this relation in section 4 of SI. These arguments assume that the pore liquid can be treated as having a well-defined pressure and bulk behavior despite the significant confinement imposed by the walls of the nanoscale pores. For the pore dimensions used in this study ( and ), our previous work Vincent et al. (2016) and that of others Bocquet and Charlaix (2010) suggest that this assumption of macroscopic thermodynamic behavior should hold. The success of this treatment in describing our data (see Results section) serves as a test of its consistency. In section 4 of SI, we also provide a more general relation directly between the imposed and the solubility. Variations of molar volume () with pressure can be accounted for by using van der Waals-like equations of state Widom and Underwood (2012); Cerdeiriña and Widom (2016).
III Materials and methods
The experimental setup is described in Fig. 1. Initially, we filled a dry porous sample with a solution of oxygen-sensitive phosphorescent dye with concentration : we placed a drop of solution on the sample and left it at rest for about to allow filling by capillary imbibition. After carefully drying the surface of the sample, we placed it in a closed chamber with controlled humidity and oxygen pressure , and allowed equilibration of pore liquid with the atmosphere for before measurements. We used two different porous solids – porous glass (pore radius ) and porous silicon () – to host the condensed water. Some details on the porous samples are given in section 1 in SI.
The composition of the atmosphere for each experiment was either air or a mixture of oxygen and nitrogen at atmospheric pressure and with the ratio controlled by a gas mixer (Oxydial); the mixer was calibrated with respect to the Clark electrode. The humidity of the atmosphere was imposed by the saturation vapor pressure of salt solutions placed in the box; no direct contact occurred between this solution and the porous sample. In this experiment, solutions of sodium or lithium chloride at various concentrations were used to impose liquid pressures ranging from (pure water, saturated atmosphere) to . For each solution and before every experiment, water potential was measured using a chilled mirror hygrometer (WP4C, Meter Group Cerdeiriña and Widom (2016)). The experiment was performed at a temperature of : in the following, all numerical results and theoretical predictions will be given at his temperature.
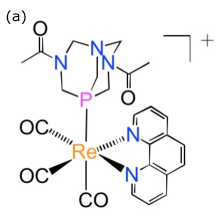
To measure the concentration, , of dissolved oxygen in pore liquid water, we exploited the oxygen quenching of the phosphorescence of specific dyes Esipova et al. (2011); Choi et al. (2012): we used a rhenium based phosphor Marker et al. (2018) synthesized by our team (details in section 3 of SI). This dye presents the advantage over commercial ones by yielding significant luminescence signal, and being water soluble and small enough to fit within the nanoscale pores. By fitting the luminescence signal following pulsed laser excitation of the phosphor, we measured the phosphorescence lifetime, of the dye (see Fig. 2(a) and section 2 in SI for more details on the optical setup).
For both substrates, we observed variations of lifetime when we performed measurements at different locations across the samples. However, the size of the laser spot (diameter ) was larger than the typical pore size and we thus expected to observe an homogeneous value. It is known that lifetime of fluorescent dyes can display fluctuations due to molecular conformation Tinnefeld et al. (2000); Esipova et al. (2011), but this effect should not affect significantly our measurement as the spot size is larger than the typical pore size. However, it has been observed that Stern-Volmer parameters can display significant variations on micrometric scales on a priori homogeneous surfaces Bedlek-Anslow et al. (2000); Kneas et al. (2000). Furthermore, as was seen with other dyes Kennelly et al. (1985); Shi et al. (1985), we observed a significant variation of lifetime between the different porous media and with respect to bulk solution (see section 3 in SI for more details): this observation hints at a strong interaction between the dye and the solid glass matrix which could explain the observed spatial variations, as small variations of the glass properties on large scale could significantly impact measured lifetimes. In order to moderate the impact of these fluctuations, we repeated measurements for each value of at different places of the samples () and computed average lifetimes. Uncertainties are represented by the standard deviation of the measured series.
We expect the relationship between the lifetime, , and the concentration, , of oxygen in the pore liquid to be given by the Stern-Volmer relation:
| (3) |
where and are parameters to be determined by calibration which depend on the nature of the substrate. The concentration is related to the oxygen pressure through Henry’s law , so we predict:
| (4) |
where and is the mole fraction of in the atmosphere.
To calibrate the sensor, we filled the experimental cell with a mixture of oxygen and nitrogen with a controlled ratio and at atmospheric total pressure , saturated with water vapor (). The lifetimes we obtained for different mole fractions of oxygen in the gas phase is presented in Fig.2(b). For both substrates, the equation (4) describes satisfactorily our measurements and this calibration allows us to determine the values of and , where subscript sat indicates that this value is valid at saturation. Values of the parameters for the two substrates are given in section 3 in SI.
For any value of , we have
| (5) |
As we control and by assuming that the determined values of and do not depend on the pressure in the liquid, our measurements of lifetime give us access to . In other words, we can track relative changes in the concentration of in the pore liquid with this technique; we cannot determine absolute concentrations.

IV Results
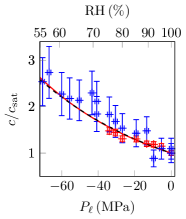
Fig. 5 represents the observed evolution of the relative concentration of dissolved oxygen in the pore liquid (aqueous solution of phosphor) for fixed mole fraction in the gas phase () and various values of . We used calibration curves as in Fig. 2 to evaluate the relative concentration from phosphorescence lifetimes, with the value at saturation (), , as a reference. We report the imposed on the top axis and the corresponding pressure in the pore liquid (calculated with Eq. (1)) on the bottom axis.
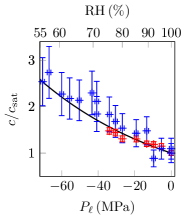
The range of (or pore pressure) over which we report concentrations for each sample type ( for Vycor and for porous silicon) were limited from below by the disappearance of detectable phosphorescence for drier conditions. We interpret this loss of signal as occurring at the point at which the pore liquid receded into the pores when the stress implied by the Kelvin equation ( in Eq. (1)) exceeded the maximum capillary stress sustainable in the pores Rasmussen et al. (2010) ( in Eq. (1) where is the receding contact angle of water on the pore wall). For Vycor, with , we expect this drying transition to occur at ; for porous silicon, with , we expect it at . In both cases, we use a reasonable value and find reasonable agreement with the observed transitions.
We now remark the good agreement in the measured values of relative concentration as a function of for the two substrates over the shared portion of their ranges (). We further note the large (over two-fold) increase in relative concentration of dissolved as the vapor goes from saturation to . We conclude that a modest degree of subsaturation in the vapor phase, commonly encountered in our environment, has a dramatic effect on the solubility of of in the pore liquid.
The black line in Fig. 5 represents the prediction of Krichevsky and Kasarnovsky (Equation (2)) for a literature value for the molar volume Taylor (1978); Zhou and Battino (2001) of in water: . Predictions of the more sophisticated model detailed in section 5 of SI match those of the simple model within a few percent, well within the experimental uncertainty. Thus, our theory agrees quantitatively with experimental results. Importantly, we employed no fitting parameter in performing this comparison. Interestingly, the same Krichevsky and Kasarnovsky equation had previously been used to describe the evolution of oxygen solubility at positive pressures Taylor (1978); our experiment thus extends its range of validity by a factor two and, for he first time, into the regime of negative pressure.
V Discussion
V.1 Comparison with literature
Given the structural and chemical distinctions between the two substrates, the agreement between data acquired for both of them and our model for a wide range of vapor saturations demonstrates:
-
1.
the appropriateness of interpreting the impact of subsaturation as the impact of the thermodynamic state of the pure fluid imposed by metastable equilibrium with its vapor (Equation (1)) and not of the detailed characteristics of the host matrix, and
-
2.
the relevance of bulk thermodynamics relations for multi-phase, multi-component equilibrium for nano-confined pore liquids.
This success supports the perspective put forward by Mercury, Lassin et al. Mercury et al. (2003, 2004); Lassin et al. (2005, 2013, 2016) that the Kelvin stress within the pore fluid plays an essential role in defining the solubility of gases in unsaturated porous media. Our model relies on a far simpler description of the thermodynamic properties of the solute and solvent than that employed by these authors Helgeson et al. (1981); Lassin et al. (2016). However, the matrices used in our study should be completely unreactive (except for the possible deprotonation of silanol groups) such that pore liquid remains essentially pure water and ion effects should be minimal. In contrast, within the geological samples of interest to them, account for these effects was necessary. The good agreement between Krichevsky and Kasarnovsky equation and a more complete model with an equation of state for the mixture of oxygen and liquid water (see section 5 in SI) can be explained by the small variation of the partial molar volume of oxygen with pressure Mercury et al. (2003).
We further consider the interplay between Kelvin mechanism and the studies following experiments by Miachon Miachon et al. (2008) and Ho Ho et al. (2011) in which the effects of the saturation of the solvent vapor were not explored. Our experiments are restricted to a situation in which the porous solid remains completely filled with the liquid and the liquid achieves equilibrium with a nanoscopic deformation of the meniscii pinned at the pore mouths (see expanded view in Fig. 1). In this filled state, the extent of liquid-solid and liquid-vapor interfaces within the host stays constant as we vary , such that we expect the interfacial effects involved by Miachon and Ho should not impact the variation of relative solubility, , that we report here. On the other hand, we expect that this mechanism should impact the absolute concentrations in our host media (e.g. the concentration at vapor saturation, , may be larger than in bulk water). However, due to our calibration procedure, we only measure directly the ratio of concentration at a given humidity over its reference saturated value. We do observe a significant discrepancy between the average lifetime of the dye in bulk solution and in pores under saturated conditions, however, we cannot interpret this observation as an effect of confinement on solubility as the behaviour of the dye itself is likely affected by the confinement as we noted previously (see section 3 in SI for a comparison of lifetimes in solid substrates and in bulk solutions).
We cannot exclude that the confinement induced oversolubility mechanism would play a role in our system at low saturations for which gas and liquid would be interspersed through the whole pore space. Our method of observation was not sensitive enough to obtain phosphorescence signal in this regime. While the mechanism proposed by Miachon and Ho is likely to be dominant in the very dry regime, where the liquid only remains as an adsorbate on the pores walls, it should be corrected by the Kelvin mechanism in the more humid regime when capillary condensation starts to occur.
V.2 Absence of anomalous hydrophobic effect
Under the relative humidities involved in our study, we predict that liquid pressure reaches , for which density should decrease by about with respect to saturation. It is surprising that our simple model, based on thermodynamic assumptions of ideality and bulk properties of water, holds in this notably stretched state and at such confinement, in pores of diameter of the order of a few molecular diameters.
In particular, the solubility of species in water under tension has been investigated numerically in the context of hydrophobic interactions, involved for instance in protein folding Chen and Makhatadze (2017). In this regime, there are strong numerical clues that the properties of solvent should be significantly altered and that an anomalous solvation effect occurs for hydrophibic molecules Rajamani et al. (2005).
Oxygen has not been specifically studied with respect to the hydrophobic effect but its apolar nature and the non monotonous behavior of its solubility with temperature Battino and Clever (1966); Clever et al. (2014) hint at a hydrophobic character. The agreement with our theory is thus particularly striking. Further studies involving more hydrophobic and larger molecules would be of strong interest.
V.3 Impact on physico-chemical processes
Such a dependency of the solubility of oxygen on for capillary condensed water is expected to impact various physico-chemical processes. In natural conditions, capillary condensed water is mostly found in soils: there, dissolved oxygen can be beneficial, for instance in agriculture as it enhances root growth Geisler (1967); Nobel and Palta (1989) and microbial activity Molz et al. (1986), or detrimental, for instance as it triggers the formation of polluting sulphidic compounds in mine tailings Yanful (1993). Significant work has been done on the modelling of oxygen transport within unsaturated soils Chesnaux (2009) and incorporation of our result could help to reach more quantitative predictions.
Electrochemical transformations represent important class of processes susceptible to be impacted by this phenomennon. Dry corrosion of metals, which happens in contact with an unsaturated medium, is one of the most widely studied physico-chemical phenomenon due to the enormous industrial cost it represents for the maintenance of pipes and structural materials Chesnaux (2009). Many studies have reported effects of the relative humidity in the gas phase on corrosion rates in several contexts like atmospheric corrosion Vernon (1931); Mansfeld and Kenkel (1976); Stratmann and Streckel (1990, 1990); Tsuru et al. (1995), corrosion by hot steam Deal (1963) or soil corrosion Gupta and Gupta (1979); Gardiner and Melchers (2002). In all these cases, the metals are covered by a thin liquid film and any asperity of the surface may host a pocket of water under tension. Our findings are thus highly relevant in this context and may be a key phenomenon for the understanding of these observations.
In the context of research for sustainable power sources, a significant effort is devoted to fuel cells where oxygen is delivered in a gaseous phase to serve as an oxidant. Among these various technologies, air breathing fuel cells operate with reactants supplied to the electrodes by gas flows with controlled to maintain hydration of the electrodes Ferrigno et al. (2002); Coz et al. (2016). At high current density, the efficiency is limited by oxygen transport Kjeang et al. (2009); Jayashree et al. (2005); Owejan et al. (2014); Weber et al. (2014) and it has been shown that the relative humidity of the gas has an impact on this efficiency Chu and Jiang (1999); Jayashree et al. (2005); Simon et al. (2017). Our results offer a possible basis for rationalizing this observation. Moreover, it opens the way for new design of porous cathodes that could exploit this enhanced oxygen solubility in unsaturated conditions to improve significantly the performance of this technology.
VI Conclusions
We have shown in the present work that the solvation of oxygen in adsorbed water is strongly influenced by the relative humidity of the surrounding atmosphere and that this effect can be described quantitatively by thermodynamic models using bulk properties of water. This success extends the conclusions made by our team Vincent et al. (2014, 2016, 2017) and others Gruener et al. (2009); Huber (2015) that the bulk thermodynamic behaviors of liquid water persist to strong confinement and large tension. The Krichevsky and Kasarnosky theory is not restricted to dioxygen and predicts a similar exponential variation of the solubility of any gas with pressure. Consistent with Le Chateliers’s principle, the solubility of solutes with positive partial molar volumes of mixing should increase with increasing tension while the solubility of solutes with negative partial molar volumes of mixing should decrease. Beyond this dependence on the partial molar volume, this prediction does not depend on the identity or microscopic details of the solvent and solute. Further work should confront this prediction by considering other molecules that display a strong hydrophobic character and for which we may expect qualitative changes of the solvent properties of pore-confined liquid water under tension.
This modification of gas solubility in adsorbed water is likely to affect important chemical processes like corrosion and it may be a missing ingredient for modeling in many situations in which dependence on has been observed. More interestingly, this study calls for the development of chemical processes exploiting capillary condensed water as a tunable solvent in the context of green chemistry: while most of studies on the effect of pressure have focused on the supercritical regime, our study shows that pressure quantitatively affects the solubility in water in a regime easier to access in practice and opens the path to the study of chemistry in metastable water, interesting for both fundamental and applied perspectives.
Ackowledgements -Experiments presented in this article have been conducted in the Biotechnology Resource Center Imaging Facility at Cornell University. The authors thank Prof. Benjamin Widom for interesting discussion on the theory, Hanwen Lu for discussions and characterization of Vycor samples and Olivier Vincent for making the porous silicon sample. The authors acknowledge an anonymous reviewer for the suggesting the relation between solubility and relative humidity (included in section 4 of SI). The authors acknowledge funding from Air Force Office for Scientific Research (FA9550-15-1-0052) and Cornell College of Engineering. Substrates were prepared, in part, in the Cornell Nanoscale Facility, an NNCI member supported by NSF grant ECCS-1542081.
References
- Ingraham and Meyer (1985) Ingraham, L.; Meyer, D. Biochemistry of Dioxygen; Plenum Press, 1985.
- Sleep (2005) Sleep, N. Metal ions in biological Systems - Vol.43: Biogeochemical Cycles of Elements; Taylor and Francis Group, 2005; Chapter 3, pp 49–74.
- Gleeson (1941) Gleeson, G. Fundamentals of Corrosion. Journal of the American Water Work Association 1941, 33, 1249–1262.
- McIntire et al. (1990) McIntire, G.; Lippert, J.; Yudelson, J. The Effect of Dissolved and on the Corrosion of Iron. Corrosion 1990, 46, 91–95.
- Fry et al. (1997) Fry, V.; Selker, J.; Gorleick, S. Experimental investigations for trapping oxygen gas in saturated porous media for in situ bioremediation. Water Resources Research 1997, 33, 2687–2696.
- Miller et al. (1998) Miller, T.; Jimenez, J.; Sharan, A.; Goldstein, D. Steelmaking and Refining Volume; The AISE Steel Foundation, 1998; Chapter 9, pp 475–424.
- Greenwood and Earnshaw (1998) Greenwood, N.; Earnshaw, A. Chemistry of the Elements; Butterworth Heinemann, 1998; Chapter 14, pp 475–424.
- Damjanovic (1992) Damjanovic, A. Electrochemistry in Transition; Plenum Press, 1992; Chapter 9, pp 107–126.
- Girishkumar et al. (2010) Girishkumar, G.; McCloskey, B.; Luntz, A.; Swanson, S.; Wilcke, W. Lithium-Air Battery: Promise and Challenges. Journal of Physical Chemistry Letters 2010, 1, 2193–2203.
- Postgate (1976) Postgate, J. The Chemistry and Biochemistry of Nitrogen Fixation; Plenum Press, 1976.
- Rabinowitch (1969) Rabinowitch, E. Photosynthesis; Wiley, 1969.
- Berner et al. (1983) Berner, R.; Lasaga, A.; Garrels, R. The Carbonate-Silicate Geochemical Cycle and its Effect on the Atmospheric Carbon Dioxide over the past 100 million years. American Journal of Science 1983, 283, 641–683.
- Morse et al. (2007) Morse, J.; Arvidson, R.; Lüttge, A. Calcium Carbonate Formation and Dissolution. Chemical Reviews 2007, 107, 342–381.
- Levich (1962) Levich, V. PhysicoChemical Hydrodynamics; Prentice Hall, 1962.
- Bruch et al. (1997) Bruch, L.; Cole, M.; Zaremba, E. Physical Adsorption: Forces and Phenomena; Clarendon Press, 1997.
- Thommes et al. (2015) Thommes, M.; Kaneko, K.; Neimark, A.; Olivier, J.; Rodriguez-Reinoso, F.; Rouquerol, J.; Sing, K. Physisorption of gases, with special reference to the evaluation of surface area and pore size distribution. Pure and Applied Chemistry 2015, 87, 1051–1069.
- Alba-Simionesco et al. (2006) Alba-Simionesco, C.; Coasne, B.; Dosseh, G.; Dudziak, G.; Gubbins, K.; Radhakrishnan, R.; Sliwinska-Bartkowiak, M. Effects of confinement on freezing and melting. Journal of Physics: Condensed Matter 2006, 18, 15–68.
- Soprunyuk et al. (2016) Soprunyuk, V.; Schranz, W.; Huber, P. Dynamic mechanical analysis of supercooled water in nanoporous confinement. Europhysics Letters 2016, 115, 46001.
- Mercury et al. (2003) Mercury, L.; Azaroual, M.; Zeyen, H.; Tardy, Y. Thermodynamic properties of solutions in metastable systems under negative or positive pressures. Geochimica et Cosmochimica Acta 2003, 67, 1769–1785.
- Lassin et al. (2005) Lassin, A.; Azaroual, M.; Mercury, L. Geochemistry of unsaturated soil systems: Aqueous speciation and solubility of minerals and gases in capillary solutions. Geochimica et Cosmochimica Acta 2005, 69, 5187–5201.
- Luzar and Bratko (2005) Luzar, A.; Bratko, D. Gas Solubility in Hydrophobic Confinement. Journal of Physical Chemistry B 2005, 109, 22545–22552.
- Miachon et al. (2008) Miachon, S.; Syakaev, V.; Rakhmatullin, A.; Pera-Titus, M.; Caldarelli, S.; Dalmon, J. Higher Gas Solubility in Nanoliquids? ChemPhysChem 2008, 9, 78–82.
- Pera-Titus et al. (2009) Pera-Titus, M.; El-Chahal, R.; Rakotovao, V.; Daniel, C.; Miachon, S.; Dalmon, J. Direct Volumetric Measurement of Gas Oversolubility in Nanoliquids: Beyond Henry’s Law. ChemPhysChem 2009, 10, 2082–2089.
- Rakotovao et al. (2010) Rakotovao, V.; Ammar, R.; Miachon, S.; Pera-Titus, M. Influence of the mesoconfining solid on gas oversolubility in nanoliquids. Chemical Physics Letters 2010, 485, 299–303.
- Ho et al. (2011) Ho, L.; Pellitero, J.; Porcheron, F.; Pellenq, R. Enhanced CO2 Solubility in Hybrid MCM-41: Molecular Simulations and Experiments. Langmuir 2011, 27, 8187–8197.
- Clauzier et al. (2012) Clauzier, S.; Ho, L.; Pera-Titus, M.; Coasne, B.; Farrusseng, D. Enhanced H2 Uptake in Solvents Confined in Mesoporous Metal-Organic Framework. Journal of the American Chemical Society 2012, 134, 17369–17371.
- Soubeyrand-Lenoir et al. (2012) Soubeyrand-Lenoir, C., E. an Vagner; Yoon, J.; Bazin, P.; Ragon, F.; Hwang, Y.; Serre, C.; Chang, J.; Llewellyn, P. How Water Fosters a Remarkable 5-Fold Increase in Low-Pressure CO2 Uptake within Mesoporous MIL-100(Fe). Journal of the American Chemical Society 2012, 134, 10174–10181.
- Ho et al. (2013) Ho, L.; Clauzier, S.; Schuurman, Y.; Farrusseng, D.; Coasne, B. Gas Uptake in Solvents Confined in Mesopores: Adsorption versus Enhanced Solubility. Journal of Physical Chemistry Letters 2013, 4, 2274–2278.
- Ho et al. (2015) Ho, L.; Schuurman, Y.; Farusseng, D.; Coasne, B. Solubility of Gases in Water Confined in Nanoporous Materials: ZSM-5, MCM-41, and MIL-100. Journal of Physical Chemistry C 2015, 119, 21547–21554.
- Sánchez-González et al. (2016) Sánchez-González, E.; Álvarez, J.; Peralta, R.; Campos-Reales-Pineda, A.; Tejeda-Cruz, A.; Lima, E.; Balmaseda, J.; González-Zamora, E.; Ibarra, I. Water Adsorption Properties of NOTT-401 and CO2 Capture under Humid Conditions. ACS Omega 2016, 1, 305–310.
- Lassin et al. (2016) Lassin, A.; Marty, N.; Gailhanou, H.; Henry, B.; Trémosa, J.; Lerouge, C.; Madé, B.; Altmann, S.; Gaucher, E. Equilibrium partial pressure of CO2 in Callovian-Oxfordian argillite as a function of relative humidity: Experiments and modelling. Procedia Earth and Planetary Science 2016, 186, 91–104.
- Bratko and Luzar (2008) Bratko, D.; Luzar, A. Attractive Surface Force in the Presence of Dissolved Gas: A Molecular Approach. Langmuir 2008, 24, 1247–1253.
- Mercury (1997) Mercury, L. Équilibres minéraux-solutions en milieu non saturé des sols. Thermodynamique de l’eau capillaire et modélisation physicochimique. Ph.D. thesis, Université de Poitiers, 1997.
- Mercury and Tardy (1997) Mercury, L.; Tardy, Y. Pression négative et propriétés thermodynamiques de l’eau capillaire. Comptes Rendus de l’Académie des Sciences de Paris 1997, 324, 863–873.
- Pettenati et al. (2008) Pettenati, M.; Mercury, L.; Azaroual, M. Capillary geochemistry in non-saturated zone of soils. Water content and geochemical signatures. Applied Geochemistry 2008, 23, 3799–3818.
- Helgeson et al. (1981) Helgeson, H.; Kirkham, D.; Flowers, G. Theoretical prediction of the thermodynamic behaviour of aqueous electrolyets at high pressures and temperatures: IV. Calculation of activity coefficients, osmotic coefficients, and apparent molal and standard and relative partial molala properties to 600°C and 5 kB. American Journal of Science 1981, 281, 1249–1516.
- Clauzier (2014) Clauzier, S. Étude de la solubilité de l’hydrogène dans des liquides confinés. Ph.D. thesis, Université de Lyon, 2014.
- Krichevsky and Kasarnovsky (1935) Krichevsky, I.; Kasarnovsky, J. Thermodynamical Calculations of Solubilities of Nitrogen and Hydrogen in Water at High Pressures. Journal of the American Chemical Society 1935, 57, 2168–2171.
- Taylor (1978) Taylor, C. The Effect of Pressure upon the Solubility of Oxygen in Water - Implications of the Deviation from the Ideal Gas Law upon Measurements of Fluorescence Quenching. Archives of Biochemistry and Biophysics 1978, 191, 375–384.
- Caupin et al. (2012) Caupin, F.; Arvengas, A.; Davitt, K.; El Mekki Azouzi, M.; Shmulovich, K.; Ramboz, C.; Sessoms, D.; Stroock, A. Exploring water and other liquids at negative pressure. Journal of Physics: Condensed Matter 2012, 24, 284110.
- Wheeler and Stroock (2009) Wheeler, T.; Stroock, A. Stability Limit of Liquid Water in Metastable Equilibrium with Subsaturated Vapors. Langmuir 2009, 25, 7609–7622.
- Chen et al. (2016) Chen, I.; Sessoms, D.; Sherman, Z.; Choi, E.; Vincent, O.; Stroock, A. Stability Limit of Water by Metastable Vapor−Liquid Equilibrium with Nanoporous Silicon Membranes. Journal of Physical Chemistry B 2016, 120, 5209–5222.
- Wheeler and Stroock (2008) Wheeler, T.; Stroock, A. The transpiration of water at negative pressures in a synthetic tree. Nature 2008, 455, 208–212.
- Gor et al. (2017) Gor, G.; Huber, P.; Bernstein, N. Adsorption-induced deformation of nanoporous materials—A review. Applied Physics Reviews 2017, 4, 011303.
- Vincent et al. (2014) Vincent, O.; Sessoms, D.; Huber, E.; Guioth, J.; Stroock, A. Drying by Cavitation and Poroelastic Relaxations in Porous Media with Macroscopic Pores Connected by Nanoscale Throats. Physical Review Letters 2014, 113, 134501.
- Vincent et al. (2016) Vincent, O.; Szenicer, A.; Stroock, A. Capillarity-driven flows at the continuum limit. Soft Matter 2016, 12, 6656–6661.
- Vincent et al. (2017) Vincent, O.; Marguet, B.; Stroock, A. Imbibition Triggered by Capillary Condensation in Nanopores. Langmuir 2017, 33, 1655–1661.
- Gruener et al. (2009) Gruener, S.; Hofmann, T.; Wallacher, D.; Kityk, A.; Huber, P. Capillary rise of water in hydrophilic nanopores. Physical Review E 2009, 79, 067301.
- Huber (2015) Huber, P. Soft matter in hard confinement: phase transition thermodynamics, structure, texture, diffusion and flow in nanoporous media. Journal of Physics: Condensed Matter 2015, 27, 103102.
- Bocquet and Charlaix (2010) Bocquet, L.; Charlaix, E. Nanofluidics, from bulk to interfaces. Chemical Society Reviews 2010, 39, 1073–1095.
- Widom and Underwood (2012) Widom, B.; Underwood, R. Second Osmotic Virial Coefficient from the Two-Component van der Waals Equation of State. Journal of Physical Chemistry B 2012, 116, 9492–9499.
- Cerdeiriña and Widom (2016) Cerdeiriña, C.; Widom, B. Osmotic Second Virial Coefficients of Aqueous Solutions from Two-Component Equations of State. Journal of Physical Chemistry B 2016, 120, 13144–13151.
- Cerdeiriña and Widom (2016) Decagon/Meter Aqualab, https://www.metergroup.com/food/products/aqualab-4te-water-activity-meter/ .
- Esipova et al. (2011) Esipova, T.; Karagodov, A.; Miller, J.; Wilson, D.; Busch, T.; Vinogradov, S. Two New “Protected” Oxyphors for Biological Oximetry: Properties and Application in Tumor Imaging. Analytical Chemistry 2011, 83, 8756–8765.
- Choi et al. (2012) Choi, N.; Verbridge, S.; Williams, R.; Chen, J.; Kim, J.; Schmehl, R.; Farnum, C.; Zipfel, W.; Fischbach, C.; Stroock, A. Phosphorescent nanoparticles for quantitative measurements of oxygen profiles in vitro and in vivo. Biomaterials 2012, 33, 2710–2722.
- Marker et al. (2018) Marker, S.; MacMillan, S.; Zipfel, W.; Li, Z.; Ford, P.; Wilson, J. Photoactivated in Vitro Anticancer Activity of Rhenium(I) Tricarbonyl Complexes Bearing Water-Soluble Phosphines. Inorganic Chemistry 2018, 57, 1311-−1331
- Tinnefeld et al. (2000) Tinnefeld, P.; Buschmann, V.; Herten, D.; Han, K.; Sauer, M. Confocal Fluorescence Lifetime Imaging Microscopy (FLIM) at the Single Molecule Level. Single Molecules 2000, 1, 215–223.
- Bedlek-Anslow et al. (2000) Bedlek-Anslow, J.; Hubner, J.; Carroll, B.; Schanze, K. Micro-heterogeneous Oxygen Response in Luminescence Sensor Films. Langmuir 2000, 16, 9137–9141.
- Kneas et al. (2000) Kneas, K.; Demas, J.; DeGraff, B.; Periasamy, A. Fluorescence Microscopy Study of Heterogeneity in Polymer-supported Luminescence-based Oxygen Sensors. Microscopy and Microanalysis 2000, 6, 551–561.
- Kennelly et al. (1985) Kennelly, T.; Gafney, H.; Braun, M. Photoinduced Disproportionation of on Porous Vycor Glass. Journal of the American Chemical Society 1985, 107, 4431–4440.
- Shi et al. (1985) Shi, W.; Wolfgang, S.; Strekas, T.; Gafney, H. Spectral and Photophyslcal Propertles of Adsorbed onto Porous Vycor Glass. Journal of Physical Chemistry 1985, 89, 974–978.
- Rasmussen et al. (2010) Rasmussen, C.; Vishnyakov, A.; Thommes, M.; Smarsly, B.; Kleitz, F.; Neimark, A. Cavitation in Metastable Liquid Nitrogen Confined to Nanoscale Pores. Langmuir 2010, 26, 10147–10157.
- Zhou and Battino (2001) Zhou, T.; Battino, R. Partial Molar Volumes of 13 Gases in Water at 298.15 K and 303.15 K. Journal of Chemical and Engineering Data 2001, 46, 331–332.
- Mercury et al. (2004) Mercury, L.; Pinti, D.; Zeyen, H. The effect of the negative pressure of capillary water on atmospheric noble gas solubility in ground water and palaeotemperature reconstruction. Earth and Planetary Science Letters 2004, 223, 147–161.
- Lassin et al. (2013) Lassin, A.; Marty, N.; Henry, B.; Trémosa, J.; Gailhanou, H.; Madé, B.; Altmann, S.; Gaucher, E. Equilibrium partial pressure of CO2 in the Callovo-Oxfordian argillite as a function of relative humidity. Procedia Earth and Planetary Science 2013, 7, 459–462.
- Chen and Makhatadze (2017) Chen, C.; Makhatadze, G. Molecular determinant of the effects of hydrostatic pressure on protein folding stability. Nature Communications 2017, 8, 14561.
- Rajamani et al. (2005) Rajamani, S.; Truskett, T.; Garde, S. Hydrophobic hydration from small to large lengthscales: Understanding and manipulating the crossover. Proceedings of The National Academy of Science 2005, 102, 9475–9480.
- Battino and Clever (1966) Battino, R.; Clever, H. The solubility of gases in liquids. Chemical Reviews 1966, 66, 395–463.
- Clever et al. (2014) Clever, H.; Battino, R.; Miyamoto, H.; Yampolski, Y.; Young, C. IUPAC-NIST Solubility Data Series. 103. Oxygen and Ozone in Water, Aqueous Solutions, and Organic Liquids (Supplement to Solubility Data Series Volume 7). Journal of Physical and Chemical Reference Data 2014, 43, 033102.
- Geisler (1967) Geisler, G. Interactive Effects of and in Soil on Root and Top Growth of Barley and Peas. Plant Physiology 1967, 42, 305–307.
- Nobel and Palta (1989) Nobel, P.; Palta, J. Soil and effects on root respiration of cacti. Plant and Soil 1989, 120, 263–271.
- Molz et al. (1986) Molz, F.; Widdowson, M.; Benefield, L. Simulation of Microbial Growth Dynamics Coupled to Nutrient and Oxygen Transport in Porous Media. Water Resources Research 1986, 22, 1207–1216.
- Yanful (1993) Yanful, E. Oxygen Diffusion through Soil Covers on Sulphidic Mine Tailings. Journal of Geotechnical Engineering 1993, 119, 1207–1228.
- Chesnaux (2009) Chesnaux, R. How groundwater seepage and transport modelling software can be useful for studying gaseous transport in an unsaturated soil. Water and Environment Journal 2009, 23, 32–40.
- Chesnaux (2009) International Measures of Prevention, Application, and Economics of Corrosion Technologies Study, National Agency of Chemical Engineers 2016 .
- Vernon (1931) Vernon, W. A laboratory study of the atmospheric corrosion of metals. Part I - The Corrosion of copper in certain synthetic atmospheres, with particular reference to the influence of sulphur dioxide in air of various relative humidities. Transactions of the Faraday Society 1931, 27, 255–277.
- Mansfeld and Kenkel (1976) Mansfeld, F.; Kenkel, J. Electrochemical Monitoring of Atmospheric Corrosion Phenomena. Corrosion Science 1976, 16, 111–122.
- Stratmann and Streckel (1990) Stratmann, M.; Streckel, H. On the atmospheric corrosion of metals which are covered with thin electrolyte layers-I. Verification of the experimental technique. Corrosion Science 1990, 30, 681–696.
- Stratmann and Streckel (1990) Stratmann, M.; Streckel, H. On the atmospheric corrosion of metals which are covered with thin electrolyte layers-II. Experimental results. Corrosion Science 1990, 30, 697–714.
- Tsuru et al. (1995) Tsuru, T.; Nishikata, A.; Wang, J. Electrochemical studies on corrosion under a water film. Materials Science and Engineering A 1995, 198, 161–168.
- Deal (1963) Deal, B. The Oxidation of Silicon in Dry Oxygen, Wet Oxygen, and Steam. Journal of the Electrochemical Society 1963, 110, 527–533.
- Gupta and Gupta (1979) Gupta, S.; Gupta, B. The critical soil moisture content in the underground corrosion of mild steel. Corrosion Science 1979, 19, 171–178.
- Gardiner and Melchers (2002) Gardiner, C.; Melchers, R. Corrosion of mild steel in porous media. Corrosion Science 2002, 44, 2459–2478.
- Ferrigno et al. (2002) Ferrigno, R.; Stroock, A.; Clark, T.; Mayer, M.; Whitesides, G. Membraneless Vanadium Redox Fuel Cell Using Laminar Flow. Journal of the American Chemical Society 2002, 124, 12930–12931.
- Coz et al. (2016) Coz, E.; Théry, J.; Boillat, P.; Faucheux, V.; Alincant, D.; Capron, P.; Gébel, G. Water management in a planar air-breathing fuel cell array using operando neutron imaging. Journal Power Sources 2016, 331, 535–543.
- Kjeang et al. (2009) Kjeang, E.; Djilali, N.; Sinton, D. Microfluidic fuel cells: A review. Journal of Power Sources 2009, 186, 353–369.
- Jayashree et al. (2005) Jayashree, R.; Gancs, L.; Choban, E.; Primak, A.; Natarajan, D.; Markoski, L.; Kenis, P. Air-Breathing Laminar Flow-Based Microfluidic Fuel Cell. Journal of the American Chemical Society 2005, 127, 16758–16759.
- Owejan et al. (2014) Owejan, J.; Trabold, T.; Mench, M. Oxygen transport resistance correlated to liquid water saturation in the gas diffusion layer of PEM fuel cells. International Journal of Heat and Mass Transfer 2014, 71, 585–592.
- Weber et al. (2014) Weber, A.; Borup, R.; Darling, R.; Das, P.; Dursch, T.; Gu, W.; Harvey, D.; Kusoglu, A.; Litster, S.; Mench, M.; Mukundan, R.; Owejan, J.P.; Pharoah, J.G.; Secanell, M.; Zenyuk, I.V. A Critical Review of Modeling Transport Phenomena in Polymer-Electrolyte Fuel Cells. Journal of the Electrochemical Society 2014, 161, 1254–1299.
- Chu and Jiang (1999) Chu, D.; Jiang, R. Performance of polymer electrolyte membrane fuel cell (PEMFC) stacks - Part I. Evaluation and simulation of an air-breathing PEMFC stack. Journal of Power Sources 1999, 83, 128–133.
- Simon et al. (2017) Simon, S.; Hasché, F.; Gasteiger, H. Influence of the Gas Diffusion Layer Compression on the Oxygen Transport in PEM Fuel Cells at High Water Saturation Levels. Journal of the Electrochemical Society 2017, 164, 591–599.
VII Supporting Information
1. Porous materials
Two different porous materials have been used in the experiment:
-
•
circular disk (radius , thickness ) of Vycor 7930 porous glass. Before every experiment, the sample was cleaned by immersion for in boiling hydrogen peroxide ( by mole in water). Pore size distribution was determined by nitrogen adsorption porosimetry. It displays a sharp maximum at radius with a half width of .
-
•
a thin layer (-thick) of nanoporous silicon. This layer was produced by anodization in a similar manner to that previously described by us Vincent et al. (2014) but with thermal oxidation at higher temperature ( at followed by at in pure oxygen) after synthesis. The pore size distribution of the sample used in this study was not measured but we expect it to be similar to that measured previously Vincent et al. (2014): average radius and half width , with possibly slightly smaller average size due to the stronger oxidation.
For both systems, there is a three dimensional disordered and interconnected pore structure. However, due to scattering of the laser beam, we only probe liquid in pores at or close to the surface of the sample in our experiment and there is thus no impact of this complex organization on our results.
2. Optical setup
Laser excitation for the phosphorescence lifetime measurements was provided by pulsing the laser line from a four-line iChrome MLE laser (Toptica Photonics AG, Munich, Germany). The diode laser in the iChrome was triggered by a DG535 Digital Delay/Pulse Generator (Stanford Research, Sunnyvale, CA) at and delivered FWHM excitation pulses. The pulses were fiber-delivered to a modified BioRad MRC-600 confocal scanhead mounted on an Olympus BX-51 upright microscope stand. Excitation pulses were delivered through an Olympus 4x/0.28 NA (XLFLUOR4X/340) objective lens focused on the sample and the phosphorescence collected back though the confocal scanhead. The phosphorescence was routed to one of the MRC-600’s internal multi-alkali photomultiplier tubes (PMT) after passing through a long pass filter (HQ470lp, Chroma Technology, Bellows Falls, VT) and the confocal pinhole which was set to Airy disk (optical sectioning was ). Photon counts from the PMT output were collected in time bins using a SR430 Multi-channel scaler (Stanford Research, Sunnyvale, CA). Data was transferred to a PC via the SR430 GPIB bus. As displayed in Fig.2(a) in main text, lifetime is obtained by fitting the luminescence intensity with a single exponential decay
| (6) |
3. Luminescent dye
The dye used in this experiment is a water soluble rhenium-based complex whose structure is described in Fig. 4(a). Details about its synthesis and characterization are given in Marker et al. Marker et al. (2018)
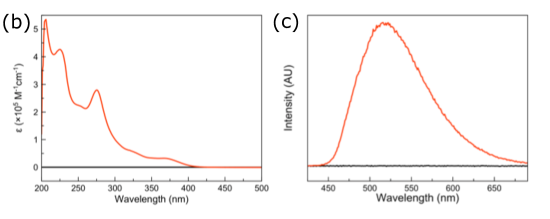
Analytical photochemical measurements were performed using a Newport Mercury/Xenon Arc Lamp. The light output was modulated using a combination of a Newport heat absorbing glass filter () with infrared cut-off (Schott KG5 filter glass), a Newport mercury line bandpass filter (, center wavelength ), and a Newport visible absorbing filter (, center wavelength ) made of dark optical glass to isolate monochromatic light. The UV-visible absorption spectrum of the dye and its emission spectrum for excitation at are respectively displayed on Fig. 4(b) and (c).
As explained in main text, the luminescence lifetime of the dye is related to the concentration of oxygen in pore liquid via the equation
| (7) |
The calibration procedure to determine the parameters and has been described in main text. In Vycor, we obtained and while in porous silicon, we obtained and .
As evoked in the main text, we suspect that interactions between the dye and the wall modify significantly and . This explains the discrepancies of the values obtained for these parameters in the two porous media and justifies the necessity to perform in situ calibrations.
This is further supported by a few complimentary tests. In bulk water under ambient conditions (), we measured a lifetime , to be compared with in Vycor and in porous silicon in the same conditions. We thus observe an notable discrepancy between lifetime measured in bulk solution and under confinement. For a phosphate buffered solution (, concentration ) we measured in ambient conditions and in a solution saturated with nitrogen.
4. Derivation of Krichevsky and Kasarnovsky equation
Let us consider the equilibrium between an ideal solution of molecular oxygen in water, of concentration and pressure , and a gas phase, of total pressure with a mole fraction in oxygen and a relative humidity, . We want to compare the concentrations and of oxygen between the considered situation and the saturation where and (see Eq. (1) in main text). The temperature is kept constant.
In both situations, the mole fraction of oxygen and the total pressure in the gas phase are the same, so if we assume the vapor is ideal, the chemical potential of oxygen in the gas is the same in the two situations: at equilibrium, this implies that the chemical potential of dissolved oxygen in the liquid phase is the same too, i.e.:
| (8) |
First, we can expand the term on the left hand side with respect to pressure:
| (9) |
If we introduce the partial molar volume of oxygen and assume it is independent of pressure, we obtain
| (10) |
If we assume the solution is ideally dilute, we can write
| (11) |
where is the chemical potential of molecular oxygen in the hypothetical infinitely dilute solution, which is independent of the concentration of oxygen, and is the molar density of the liquid, which depends on its pressure.
By combining these expressions, we obtain the Krichevsky and Kasarnovsky equation:
| (12) |
This formula has been initially derived in a context of elevated pressure (i.e. ), with bulk liquid. In our situation, it could be questionable due to confinement: because of solid/liquid interaction, the pressure becomes heterogeneous and anisotropic at nanoscale and is thus ill-defined. It could be better not to refer to pressure but rather to only consider chemical potential and relative humidity which does no suffer from wall effect. The equation (8) then becomes
| (13) |
The most general relation that we can get between and the solubility is
| (14) |
For large pores or nanopores connected to hierarchical larger pores, we can derive from Kelvin-Laplace equation that
| (15) |
In that case, we recover Krichevsky and Kasarnovsky equation expressed in terms of relative humidity:
| (16) |
5. More refined model
To refine Krichevsky and Kasarnovsky relation, one can account for a variation of the partial molar volume with pressure by using more accurate equations of state for the liquid phase, as described by Widom and Cerdeiriña Widom and Underwood (2012); Cerdeiriña and Widom (2016). For instance, we fit the density curve provided by the IAPWS equation of state Wagner and Pruss (2002); Davitt et al. (2010) for pressures between and with van der Waals-like equation of states. This results in an agreement between the fit and the IAPWS data of a few percent with interaction parameter and covolumes respectively equal to and . It is to note that deviations from IAPWS in the negative pressure regime have been observed below Pallares et al. (2016).
Then, we assume that the (dilute) aqueous solution of dioxygen follows the same equation of state with effective parameters determined by an empirical mixing rule: van Konynenburg and Scott (1980)
| (17) |
where and are the number densities of solvent and solute. Parameters , , and are respectively the interaction parameters () and covolumes () of pure water (subscript ) and pure oxygen (subscript . The parameters and play no role in the considered dilute limit. The parameters and are fitting parameters used to enforce agreement with tabulated data at saturation.
With these assumptions, the solubility parameter introduced by Widom and defined as the ratio of over the value it would have in a hypothetical ideal gas at the same temperature and composition, can be computed. In the dilute limit, the concentration of dioxygen is finally expressed as
| (18) |
Detailed calculation of for different Van der Waals-like equations of state have been presented by Widom and Cerdeiriña Cerdeiriña and Widom (2016). Parameters and are chosen to match the tabulated values of solubility Haynes (2015) and oxygen molar volume Taylor (1978); Zhou and Battino (2001) at saturation and standard pressure.
Prediction of this model is compared to these of the simple model presented in the main text and to the experimental results. Within experimental uncertainty, we cannot distinguish between predictions by the two models. As well as for the agreement with the model by Lassin et al. Helgeson et al. (1981); Lassin et al. (2016), this can be explained by the fact that the molar volume of oxygen in water is almost independent on pressure in the considered range Mercury et al. (2003).
References
- Vincent et al. (2014) Vincent, O.; Sessoms, D.; Huber, E.; Guioth, J.; Stroock, A. Drying by Cavitation and Poroelastic Relaxations in Porous Media with Macroscopic Pores Connected by Nanoscale Throats. Physical Review Letters 2014, 113, 134501.
- Marker et al. (2018) Marker, S.; MacMillan, S.; Zipfel, W.; Li, Z.; Ford, P.; Wilson, J. Photoactivated in Vitro Anticancer Activity of Rhenium(I) Tricarbonyl Complexes Bearing Water-Soluble Phosphines. Inorganic Chemistry 2018, 57, 1311–1331.
- Widom and Underwood (2012) Widom, B.; Underwood, R. Second Osmotic Virial Coefficient from the Two-Component van der Waals Equation of State. Journal of Physical Chemistry B 2012, 116, 9492–9499.
- Cerdeiriña and Widom (2016) Cerdeiriña, C.; Widom, B. Osmotic Second Virial Coefficients of Aqueous Solutions from Two-Component Equations of State. Journal of Physical Chemistry B 2016, 120, 13144–13151.
- Wagner and Pruss (2002) Wagner, W.; Pruss, A. The IAPWS Formulation 1995 for the Thermodynamic Properties of Ordinary Water Substance for General and Scientific Use. Journal of Physical and Chemical Reference Data 2002, 31, 387–535.
- Davitt et al. (2010) Davitt, K.; Rolley, E.; Caupin, F.; Arvengas, A.; Balibar, S. Equation of state of water under negative pressure. Journal of Chemical Physics 2010, 133, 174507.
- Pallares et al. (2016) Pallares, G.; Gonzalez, M.; Abascal, J.; Valeriani, C.; Caupin, F. Equation of state for water and its line of density maxima down to -120 MPa. Phys. Chem. Chem. Phys. 2016, 18, 5896–5900.
- van Konynenburg and Scott (1980) van Konynenburg, P.; Scott, R. Critical Lines and Phase Equilibria in Binary van der Waals Mixtures. Philosophical Transactions of the Royal Society of London 1980, 298, 495–540.
- Haynes (2015) Haynes, W. Handbook of Chemistry and Physics; CRC, 2015.
- Taylor (1978) Taylor, C. The Effect of Pressure upon the Solubility of Oxygen in Water - Implications of the Deviation from the Ideal Gas Law upon Measurements of Fluorescence Quenching. Archives of Biochemistry and Biophysics 1978, 191, 375–384.
- Zhou and Battino (2001) Zhou, T.; Battino, R. Partial Molar Volumes of 13 Gases in Water at 298.15 K and 303.15 K. Journal of Chemical and Engineering Data 2001, 46, 331–332.
- Helgeson et al. (1981) Helgeson, H.; Kirkham, D.; Flowers, G. Theoretical prediction of the thermodynamic behaviour of aqueous electrolyets at high pressures and temperatures: IV. Calculation of activity coefficients, osmotic coefficients, and apparent molal and standard and relative partial molala properties to 600∘C and 5 kB. American Journal of Science 1981, 281, 1249–1516.
- Lassin et al. (2016) Lassin, A.; Marty, N.; Gailhanou, H.; Henry, B.; Trémosa, J.; Lerouge, C.; Madé, B.; Altmann, S.; Gaucher, E. Equilibrium partial pressure of CO2 in Callovian-Oxfordian argillite as a function of relative humidity: Experiments and modelling. Procedia Earth and Planetary Science 2016, 186, 91–104.
- Mercury et al. (2003) Mercury, L.; Azaroual, M.; Zeyen, H.; Tardy, Y. Thermodynamic properties of solutions in metastable systems under negative or positive pressures. Geochimica et Cosmochimica Acta 2003, 67, 1769–1785.