The distribution of information for sEMG signals in the rectal cancer treatment process
Abstract
The electrical activity of external anal sphincter can be registered with surface electromyography. This signals are known to be highly complex and nonlinear. This work aims in characterisation of the information carried in the signals by harvesting the concept of information entropy. We will focus of two classical measures of the complexity. Firstly the Shannon entropy is addressed. It is related to the probability spectrum of the possible states. Secondly the Spectral entropy is described, as a simple frequency-domain analog of the time-domain Shannon characteristics. We discuss the power spectra for separate time scales and present the characteristics which can represent the dynamics of electrical activity of this specific muscle group. We find that the rest and maximum contraction states represent rather different spectral characteristic of entropy, with close-to-normal contraction and negatively skewed rest state.
keywords:
surface electromyography , colorectal cancer , entropy1 Introduction
The colorectal cancer (CRC) remains one of the most common cancer with a high mortality rate [1, 2]. The appropriate diagnostic procedures are required for both prior to treatment and during the multimodal therapy. In order to implement the most effective healing process while increasing the probability of fast recovery, not only the tumor diagnostic techniques are important but also the monitoring of surrounding anatomical structures that may be potentially affected by the invasive therapy including surgery or radiation [3, 4]. On top of that the understanding of the evolution and mutation of the CRC cells are crucial for more effective future treatment [5]. In this work we study the results of some less conventional method of diagnosis of an external anal sphincter (EAS) activity before and after the surgery. The classification of patients can be effectively based on the anorectal manometry together with the descriptive parameters like root mean square or median frequency of raw sEMG signals [6]. The electrical activity of this muscle group is investigated through the surface electromyography technique (sEMG) before and after the anterior resection (AR) or the lower anterior resection (LAR). The registered time series indicate a high degree of complexity, hence it is necessary to apply methods that adequately characterise the dynamics of the complex process hidden in the high-dimensional data sets. The sEMG signals in question exhibit two distinct scaling regions which can be identified with multifractal spectra. The multi– and mono–fractal nature of the signals can be seen for the short and large time scales respectively with the former being the result of the long–range correlations for weak and large fluctuations [7]. Quite recently, considerable attention has been paid to the entropy-based techniques with a very promising potential in bio-medical signal processing [8, 9, 10, 11]. The idea of implementing the entropy notions for the measure of biodiversity is present in an increasing number of the studied biosystems, from the microscopic level [12, 13] to the whole body response that can be investigated by the spectrum of electrophysiological signals as electrocardiography (ECG) [14, 15, 16], encephalography (EEG) [17] or magnetoencephalography (MEG) [18]. The specific values of the approximate entropy measures and their dependence on the time scales were analysed for the sEMG signals registered with patients with colorectal cancer [19]. The statistically significant differences among all stages of medical treatment and for all consecutive depths of rectum area were found for the Sample Entropy () [20]. The analysis of over multiple time scales exhibits the most visible differences between AR and LAR groups were identified one month after an operation. It was also shown that the information carried out by the sEMG signals measured one year after the surgery returns to the state of that before the surgery for the selected cases [19].
This work presents the application of basics ideas taken from the information theory for the characterisation of a specific neuromuscular activity of EAS. To better understand of features of analysed signals and how complexity is assessed from them the standard Shannon entropy () with their frequency analogue – spectral entropy () were applied. A thorough spectral analysis was also carried out for the full characterisation of the examined time series.
2 Material and methods
Patients. The study group include 20 subjects. Among them were 6 female and 14 male with the average age . All patients were diagnosed with a rectal cancer and undergone one of a surgical procedure (LAR or AR).
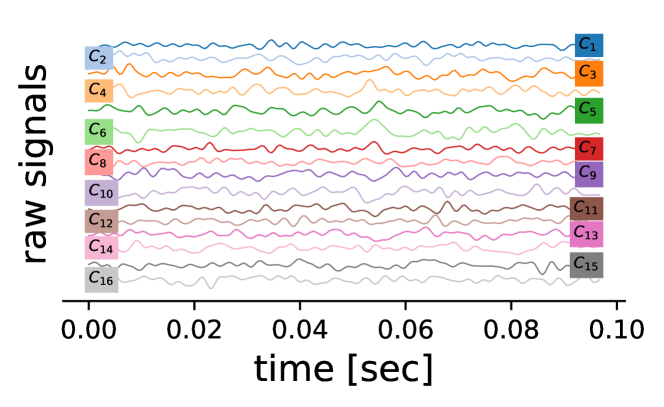
Data acquisition. The series were recorded before surgery, and two times after, respectively 6 months and 1 year in the postoperative period. In addition the two extreme cases of muscle tension, relaxation and maximum voluntary contraction (MVC) were considered separately. The measuring device developed at the Politechnico di Torino in collaboration with the OT-Bioelettronica consist of 3 rings of 16 silver/silver oxide bar electrodes. The proper measurement took 10 seconds each. The sampling frequency was set to 2048 Hz. Low and high pass filters were used at 10 and 500 Hz respectively and resulted in typical 3dB bandwidth for the Analog to Digital Converter. The 20 subjects x 16 channels x 3 different depth of rectum x 2 stages of muscle tension (REST vs MVC) x 3 different stages of treatment resulted in about 6000 signals for analysis.
3 Information entropy
In statistical thermodynamics the macroscopic state of the microsystem is characterised by the distribution of the possible states. The entropy of distribution of a discrete set of microstates is given by the Gibbs formula , where is a temperature and is the Boltzmann constant. This definition works also for systems far away from equilibrium. An early idea of Gibbs was transmitted to the information theory in 1948 by Claude Shannon [21] and since then serves as a popular definition of the complexity of signals [22].
3.1 Shannon Entropy
The average Shannon information content of an outcome characterises the average information contained in the signal. It calculates the number of possible states that the system represented by a respective time series can take. is often associated with the degree of uncertainty present in the signal or with the information that is inversely proportional to its predictability. The basic formula for calculating of time series of samples with the probability distribution function is given as a average number of the logarithm of the probability of a certain state .
| (1) |
The higher values of are determined by more unpredictable character of the series. The maximum of occurs in the case when all the states are equally probable. The base for logarithm in (1) defines the unit of entropy. Throughout this paper we will use the original formulation of Shannon [21], where base equals 2 and the unit of entropy is called shannon or bit.
3.2 Power Spectral Entropy
The Power Spectral Entropy () is a simple analog of the in the frequency–domain. It tells us how broadly the power in the signal is distributed across the available frequencies. It is used as a measure of the width and uniformity of the power spectrum. The frequency components of the power spectrum are always found to be linearly independent, regardless of the presence or absence of correlations. It gives an advantage over the standard method of creating a histogram where the correlations present in the signal are lost. The main limitation of this method lies in the fact that the determination of the power spectrum filters out all the nonlinearities that might be present in the signal, thus is an insensitive method for more subtle features of the signals [23]. The first step in the procedure of estimation of the is the calculation of the Power Spectral Density function. Next, the is normalised by the sum of all its spectral components .
| (2) |
Above is the Fourier transform (FT) of the process and is the frequency in . For the estimation of the PSD of we use the periodogram [23]. As a non-parametric estimator of the PSD is not always consistent due to the fact that its variance does not always converge to zero with the signal length, for formal analysis of the PSD (see Fig, 4) we use the Welch method [24]. In short, it splits the random signal into overlapping segments, estimate the PSD for each one and returns the average over these local estimates. The Power Spectral Entropy is defined as
| (3) |
If only few frequencies are present the will naturally be low valued, so deterministic systems with a single frequency, such as a sine wave, have an entropy value of 0. For the case of wide distribution of frequencies, like for the white or pink noises, the value of will be much higher. For instance white Gaussian noise have the maximal on a given scale.
4 Results
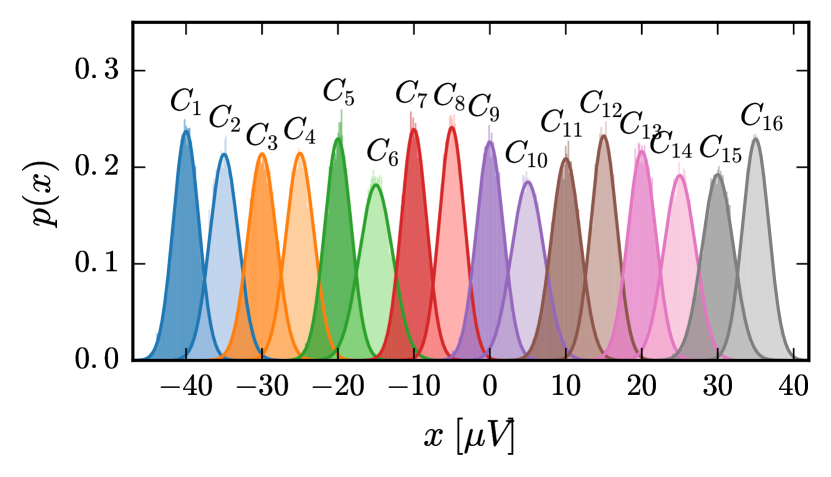
Shannon entropy. We start with the estimation of the probability distribution of the amplitudes of the signal. The simplest way to do so is to use the values of the signal itself and calculate their frequency. It is done by creating histograms of the amplitudes and normalise them by total number of samples . Exemplary plots of the histograms can be seen in Fig. 2 for all channels at depth. At first glance all the characteristics look normal, although about 85% of the analysed signals fail Lilliefors test [25] and more than 90% of signals fail Anderson-Darling normality test [26] at the significance level .
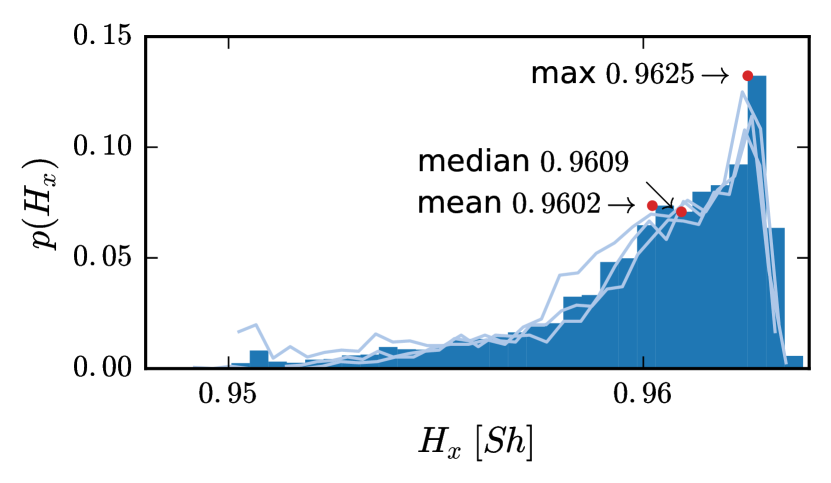
Next, for the estimated probabilities we calculate the Shannon entropy. In Fig. 3 we depict the distribution of the obtained values. They range from 0.9492Sh to 0.9639Sh. The most common value is 0.9625Sh, while the average and median read 0.9602Sh and 0.9609Sh, respectively. All values are accurate to four significant digits. This characteristics stay similar for the pre/post stages of surgical treatment, c.f. light blue lines in Fig. 3.
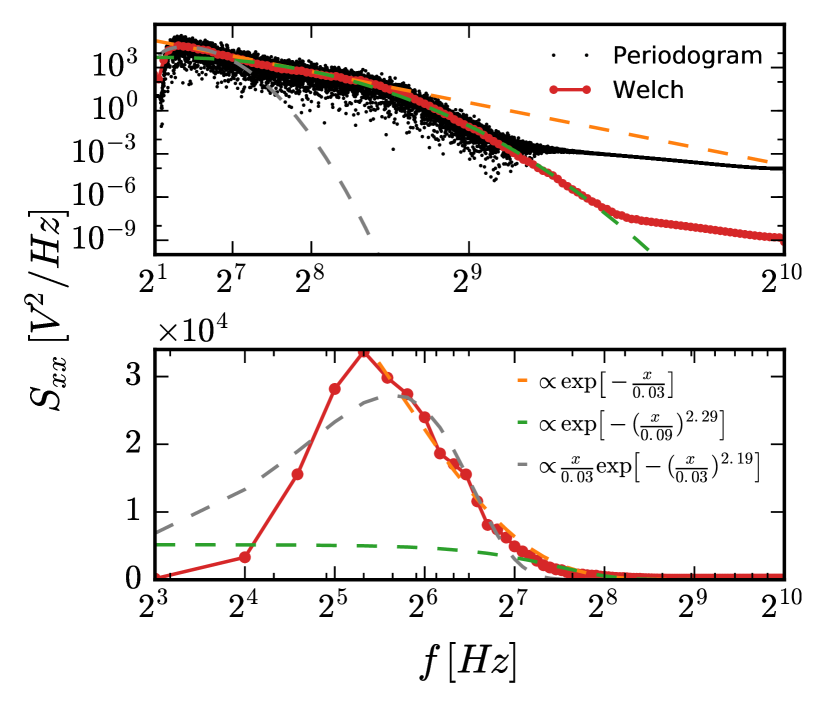
Spectral entropy. Similarly we start with the calculation of power spectra. For sEMG signals we found them rather complex where certain timescales can be described with different distribution functions, see Fig. 4 for details. Slow dynamics (, dashed grey) can be represented by the stretched exponential distribution of the Weibull form , with the average values of and . On the other hand relatively slow dynamics (, dashed orange) can also be represented by the simple exponential distribution with the average . for the fast and intermediate frequencies (, dashed green) is given by the stretched exponential distribution with the average values of and .
In comparison with the probability based , the typical values of are drastically lower, see Fig. 5. The average value of the spectral entropy for the total number of signals equals . The distribution of the spectral entropy over the whole samples in question is bi–modal, c.f. grey histogram in Fig. 5. This can be explained once we consider separately the rest (blue) and MVC (orange) states. For the rest state the shape of the distribution of spectral entropy reminds the distribution of the Shannon entropy, with specific most common (maximum) state and the negative skewness, see Tab. 1. The distribution of the for MVC is much closer to normal with the kurtosis 3.2969 and skewnes 0.2556. In contrast to the its frequency domain equivalent also indicates a significant decrease of the average value for MVC. Both distribution are rather leptokurtic as both produce rather above average number of outliers than the standard normal distribution.
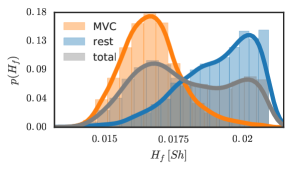
This situation is partially justified by the concept of entropy as a measure of the diversity of the available states in the system. The reduction of these states is a consequence of the muscle contraction phenomenon itself. During the propagation of the action potential within the functional motor units the specific direction of the process is dominated, which automatically entails the decrease of the number of possible states that the system can choose.
| total | rest | MVC | |
|---|---|---|---|
| mean | 0.0179 | 0.0190 | 0.0167 |
| std | 0.0017 | 0.0015 | 0.0011 |
| skewness | -0.0894 | -1.4040 | 0.2556 |
| kurtosis | -0.2013 | 4.3347 | 3.2969 |
5 Discussion and Conclusions
The purpose of this work is to characterise the average information content of sEMG signals registered from external anal sphincter during multi–modal rectal cancer therapy. The data were examined in terms of application of the basic notions of information theory with a special effort devoted to the frequency distribution and the spectral entropy which is built upon it. The spectral analysis itself brings a valuable information about the character of data. The power spectrum density for frequencies of the electrical activity of EAS is relatively wide, with the power that decrease exponentially for slow and even faster for the intermediate and higher frequency components. For the slow dynamics there is clear frequency of around 50Hz for which is maximal for all signals.
The standard probability based Shannon entropy did not provide any significant discrepancy for the signals measured before and after the surgery or for the relaxation vs MVC stages. This is partially a consequence of noisy character of sEMG data and similar probability distributions obtained for all the compared states. The broad power spectrum identified below the Nyquist limit should result in the relatively large values of , which is not confirmed by our results. The effect of the drastically decreasing of and its very small values can be justified by the dominance of the narrow-banded slow dynamics and fast decreasing power spectrum for fast dynamics. Despite the a little amount of spectral information contained by the EAS activity, in contrast to the Shannon estimator, parameter clearly distinguishes the extreme states of muscle tension (relax vs MVC). This contrast can also be found for multiscale (MSE). For the relaxation state of muscle the value of MSE grows much faster to it’s maximum value with the increase of the scale factor. [19]. The anal sphincter muscle group resting activity contains a valuable amount of information which in frequency domain is greater than for the case of forced activity. This feature can be of importance for the clinicians in case of pre-surgery survey with sEMG.
The main limitations of this study is due to the problem of inter–subject variability. The large diversity in distribution of EAS innervation zones, mainly caused by the high level of the individual asymmetries significantly affects the differences between the compared groups. That effect potentially has the greatest impact on very weak ability to distinguish the different states of treatment. Also the computational technique used has its internal limitations such as insensitivity to non–linear character of data. However, to our knowledge this is the first study which implements the information theory to the complex neuromuscular EAS activity and further investigations of the issue is still required. In our future research we intend to particularly concentrate on the methods that next to the statistical properties of data also taking into consideration the signal dynamics.
References
- [1] J. Ferlay, I. Soerjomataram, R. Dikshit, S. Eser, C. Mathers, M. Rebelo, D. M. Parkin, D. Forman, F. Bray, Cancer incidence and mortality worldwide: sources, methods and major patterns in globocan 2012, International journal of cancer 136 (5).
- [2] M. Arnold, M. S. Sierra, M. Laversanne, I. Soerjomataram, A. Jemal, F. Bray, Global patterns and trends in colorectal cancer incidence and mortality, Gut (2016) gutjnl–2015.
- [3] K. Ammann, W. Kirchmayr, A. Klaus, G. Mühlmann, R. Kafka, M. Oberwalder, A. De Vries, D. Öfner, H. Weiss, Impact of neoadjuvant chemoradiation on anal sphincter function in patients with carcinoma of the midrectum and low rectum, Archives of Surgery 138 (3) (2003) 257–261.
- [4] T. J. Ridolfi, N. Berger, K. A. Ludwig, Low anterior resection syndrome: Current management and future directions, Clinics in colon and rectal surgery 29 (03) (2016) 239–245.
- [5] S. F. Roerink, N. Sasaki, H. Lee-Six, M. D. Young, L. B. Alexandrov, S. Behjati, T. J. Mitchell, S. Grossmann, H. Lightfoot, D. A. Egan, A. Pronk, N. Smakman, J. van Gorp, E. Anderson, S. J. Gamble, C. Alder, M. van de Wetering, P. J. Campbell, M. R. Stratton, H. Clevers, Intra-tumour diversification in colorectal cancer at the single-cell level, Nature 556 (7702) (2018) 457.
- [6] M. Nowakowski, K. A. Tomaszewski, Ł. Machura, P. Trybek, R. M. Herman, Sensitivity and specificity of multichannel surface electromyography in diagnosing fecal incontinence, Folia Med Cracov 57 (1) (2017) 29–38.
- [7] P. Trybek, M. Nowakowski, L. Machura, Multifractal characteristics of external anal sphincter based on semg signals, Medical engineering & physics 55 (2018) 9–15.
- [8] V. V. Nikulin, T. Brismar, Comment on “multiscale entropy analysis of complex physiologic time series”, Physical review letters 92 (8) (2004) 089803.
- [9] M. Costa, A. L. Goldberger, C.-K. Peng, Multiscale entropy analysis of biological signals, Physical review E 71 (2) (2005) 021906.
- [10] P. A. Kaplanis, C. S. Pattichis, D. Zazula, et al., Multiscale entropy-based approach to automated surface emg classification of neuromuscular disorders, Medical & biological engineering & computing 48 (8) (2010) 773–781.
- [11] M. Borowska, Entropy-based algorithms in the analysis of biomedical signals, Studies in Logic, Grammar and Rhetoric 43 (1) (2015) 21–32.
- [12] J. J. Stewart, C. Y. Lee, S. Ibrahim, P. Watts, M. Shlomchik, M. Weigert, S. Litwin, A shannon entropy analysis of immunoglobulin and t cell receptor, Molecular immunology 34 (15) (1997) 1067–1082.
- [13] Z. Zhang, R. Xiao, Empirical study on entropy models of cellular manufacturing systems, Progress in Natural Science 19 (3) (2009) 389–395.
- [14] D. Cysarz, H. Bettermann, P. Van Leeuwen, Entropies of short binary sequences in heart period dynamics, American Journal of Physiology-Heart and Circulatory Physiology 278 (6) (2000) H2163–H2172.
- [15] C. Kamath, Entropy-based algorithm to detect life threatening cardiac arrhythmias using raw electrocardiogram signals, Middle East J. Sci. Res 12 (2012) 1403–1412.
- [16] D. Makowiec, A. Kaczkowska, D. Wejer, M. Żarczyńska-Buchowiecka, Z. R. Struzik, Entropic measures of complexity of short-term dynamics of nocturnal heartbeats in an aging population, Entropy 17 (3) (2015) 1253–1272.
- [17] D. Q. Phung, D. Tran, W. Ma, P. Nguyen, T. Pham, Using shannon entropy as eeg signal feature for fast person identification., in: ESANN, Vol. 4, 2014, pp. 413–418.
- [18] C. Gómez, R. Hornero, Entropy and complexity analyses in alzheimer’s disease: an meg study, The open biomedical engineering journal 4 (2010) 223.
- [19] P. Trybek, M. Nowakowski, J. Salowka, J. Spiechowicz, L. Machura, Sample entropy of semg signals at different stages of rectal cancer treatment, Entropy 20 (11) (2018) 863.
- [20] J. S. Richman, J. R. Moorman, Physiological time-series analysis using approximate entropy and sample entropy, American Journal of Physiology-Heart and Circulatory Physiology 278 (6) (2000) H2039–H2049.
- [21] C. E. Shannon, A mathematical theory of communication, Bell system technical journal 27 (3) (1948) 379–423.
- [22] D. J. MacKay, Information theory, inference and learning algorithms, Cambridge university press, 2003.
- [23] J. L. Semmlow, B. Griffel, Biosignal and medical image processing, CRC press, 2014.
- [24] P. Welch, The use of fast fourier transform for the estimation of power spectra: a method based on time averaging over short, modified periodograms, IEEE Transactions on audio and electroacoustics 15 (2) (1967) 70–73.
- [25] H. W. Lilliefors, On the kolmogorov-smirnov test for normality with mean and variance unknown, Journal of the American statistical Association 62 (318) (1967) 399–402.
- [26] T. W. Anderson, D. A. Darling, Asymptotic theory of certain ”goodness of fit” criteria based on stochastic processes, The annals of mathematical statistics (1952) 193–212.