Effect of pressure on the physical properties of the superconductor NiBi3
Abstract
We present an experimental study of the superconducting properties of NiBi3 as a function of pressure by means of resistivity and magnetization measurements and combine our results with DFT calculations of the band structure under pressure. We find a moderate suppression of the critical temperature from K to K by pressures up to 2 GPa. By taking into account the change of the band structure as a function of pressure, we argue that the decrease in is consistent with conventional, electron-phonon-mediated BCS-type superconductivity.
I Introduction
Bismuth-rich compounds have played a leading role in the last couple of years in the search for novel topological phases Isaeva13 due to the strong spin-orbit coupling which is associated with the heavy Bi atoms. Among these systems, Bi2Se3 and Bi2Te3 were established as good candidate systems for topological insulators Xia09 ; Chen09 . The concept of topology, however, is not only restricted to insulators, but can also be extended to any system with a gap in the excitation spectrum Shao16 . This includes, in particular, superconductors which, in case they are topological in nature, have potential applications in quantum computing Nayak08 . It is argued, that unconventional -wave superconductors intrinsically realize this novel topological state Sato17 . Among the Bi-based compounds, CuxBi2Se3 Sasaki11 is a prominent example to realize such a topological superconducting state in the Bi-based family.
Another Bi-rich compound, which is known to superconduct, is NiBi3. It has a critical temperature of K (Alekseevskii52, ). However, the nature of superconductivity in this compound has not yet been clarified. In studies of the nature of superconductivity (SC), pressure has proven to be an useful tool to explore the properties of SC (see e.g. Lorenz05 for a review). In the case of NiBi3, a very early report suggested an increase of the superconducting critical temperature with pressure Alekseevskii52 . However, a detailed study of the properties of NiBi3 under pressure is still missing. Thus, we present here a comprehensive study of the superconducting properties of NiBi3 under pressure by utilizing measurements of the resistance and magnetization, combined with DFT calculations of the band structure under pressure. Our results show a decrease of with which can be described quantitatively within the framework of BCS theory. Thus, our results indicate a conventional nature of superconductivity in NiBi3.
II Experimental and Computational Details
Single crystals of NiBi3 were grown by a flux-growth technique Canfield92 out of excess Bi. To this end, Ni (Alfa Aesar 99.99%) and Bi (Alfa Aesar 99.99%) in the molar ratio 1:9 were loaded into a fritted alumina Canfield Crucible Set Canfield16 and sealed into a fused silica ampoule under partial argon atmosphere. The ampoule was heated to 1000∘C in 3 hours and dwelled at this temperature for another 3 hours. It was then cooled rapidly to 600∘C (3 hours) and dwelled there for another 3 hours. After that, the ampoule was slowly cooled to 320∘C over 40 hours. At this temperature, the ampoule was removed from the furnace and excess liquid was decanted by the help of a centrifuge. The resulting crystals were needle-shaped and had dimensions of about mm3 (see bottom inset of Fig. 1). These crystals were characterized initially by x-ray as well as magnetization measurements. The x-ray data was acquired by using a Rigaku MiniFlex diffractometer (Cu radiation) at room temperature on ground single crystals.
Magnetization at ambient pressure was measured in a Quantum Design Magnetic Property Measurement System (MPMS-3). An aggregate of randomly oriented single crystals of total mass mg were loaded in a gelantine capsule. The background of the gelantine capsule and the sample holder was determined independently and subtracted from the measured magnetization data.
For measurements of the resistivity under pressure, the samples were cut into pieces of dimensions of mm3. Resistivity was measured in a standard four-point configuration; four 25 m Pt wires were attached to the sample by using silver epoxy. The ac resistivity measurements were performed in a Quantum Design Physical Property Measurement System with a current of 1 mA and frequency of 17 Hz. The current was applied along the long needle axis which is the crystallographic axis. Measurements were performed upon cooling using a rate of 0.25 K/min. For measurements in magnetic field, , the field was applied perpendicular to the long needle axis, i.e., perpendicular to the crystallographic axis. To apply pressures up to 2 GPa, the sample was placed in a Be-Cu/Ni-Cr-Al hybrid piston-cylinder cell. The design of the cell is similar to the one described in Ref. Budko84 . A 4:6 mixture of light mineral oil:n-pentane Budko84 ; Thompson84 ; Kim11 was used as a pressure-transmitting medium. It solidifes at 34 GPa at room temperature, i.e., well above our maximum pressure. Thus, hydrostatic pressure conditions are ensured in the full pressure range of investigation. Pressure at low temperatures was inferred from the pressure dependence of the superconducting temperature of Pb Bireckoven88 .
Magnetization measurements under pressure were performed in MPMS-3 in a dc field of 2 mT. A commercially-available HDM Be-Cu piston-pressure cell Mcell was used to apply pressure up to 1.2 GPa. Daphne oil 7373 was used as a pressure medium Yokogawa07 , which solidifies at 2.2 GPa at room temperature, thus ensuring hydrostatic pressure conditions in the full range. of Pb was used to determine the low-temperature pressure Bireckoven88 .
The band structure of NiBi3, at different hydrostatic pressures, was calculated in density functional theory Hohenberg64 ; Kohn65 (DFT) using PBEsol as exchange-correlation functional with the spin-orbit coupling (SOC) effect included. With the forces and stress calculated using the Feynman-Hellmann theorem, the unit cell lattice constants and ionic positions were fully relaxed at different pressures before the band structures were calculated. The density of states (DOS) was calculated using the tetrahedral method in reciprocal space. All DFT calculations were performed in VASP Kresse96a ; Kresse96b with a plane-wave basis set and projector augmented wave Bloechl94 method. We used the orthorhombic cell of 16 atoms with a -centered Monkhorst-Pack (5124) k-point mesh Monkhorst76 and kinetic energy cutoff was 337 eV. The convergence with respect to k-point mesh was carefully checked, with total energy converged below 1 meV/atom. For ionic relaxation, the absolute magnitude of force on each atom was reduced below 0.01 eV/Å.
III Results
III.1 Experimental Results
III.1.1 Ambient-pressure characterization
Figure 1 shows our ambient-pressure x-ray as well as magnetization data (inset). The peaks resolved in our powder x-ray diffraction pattern match very well with the reported peak positions of the orthorhombic structure of NiBi3. We also find additional peaks that can be attributed to excess Bi flux.
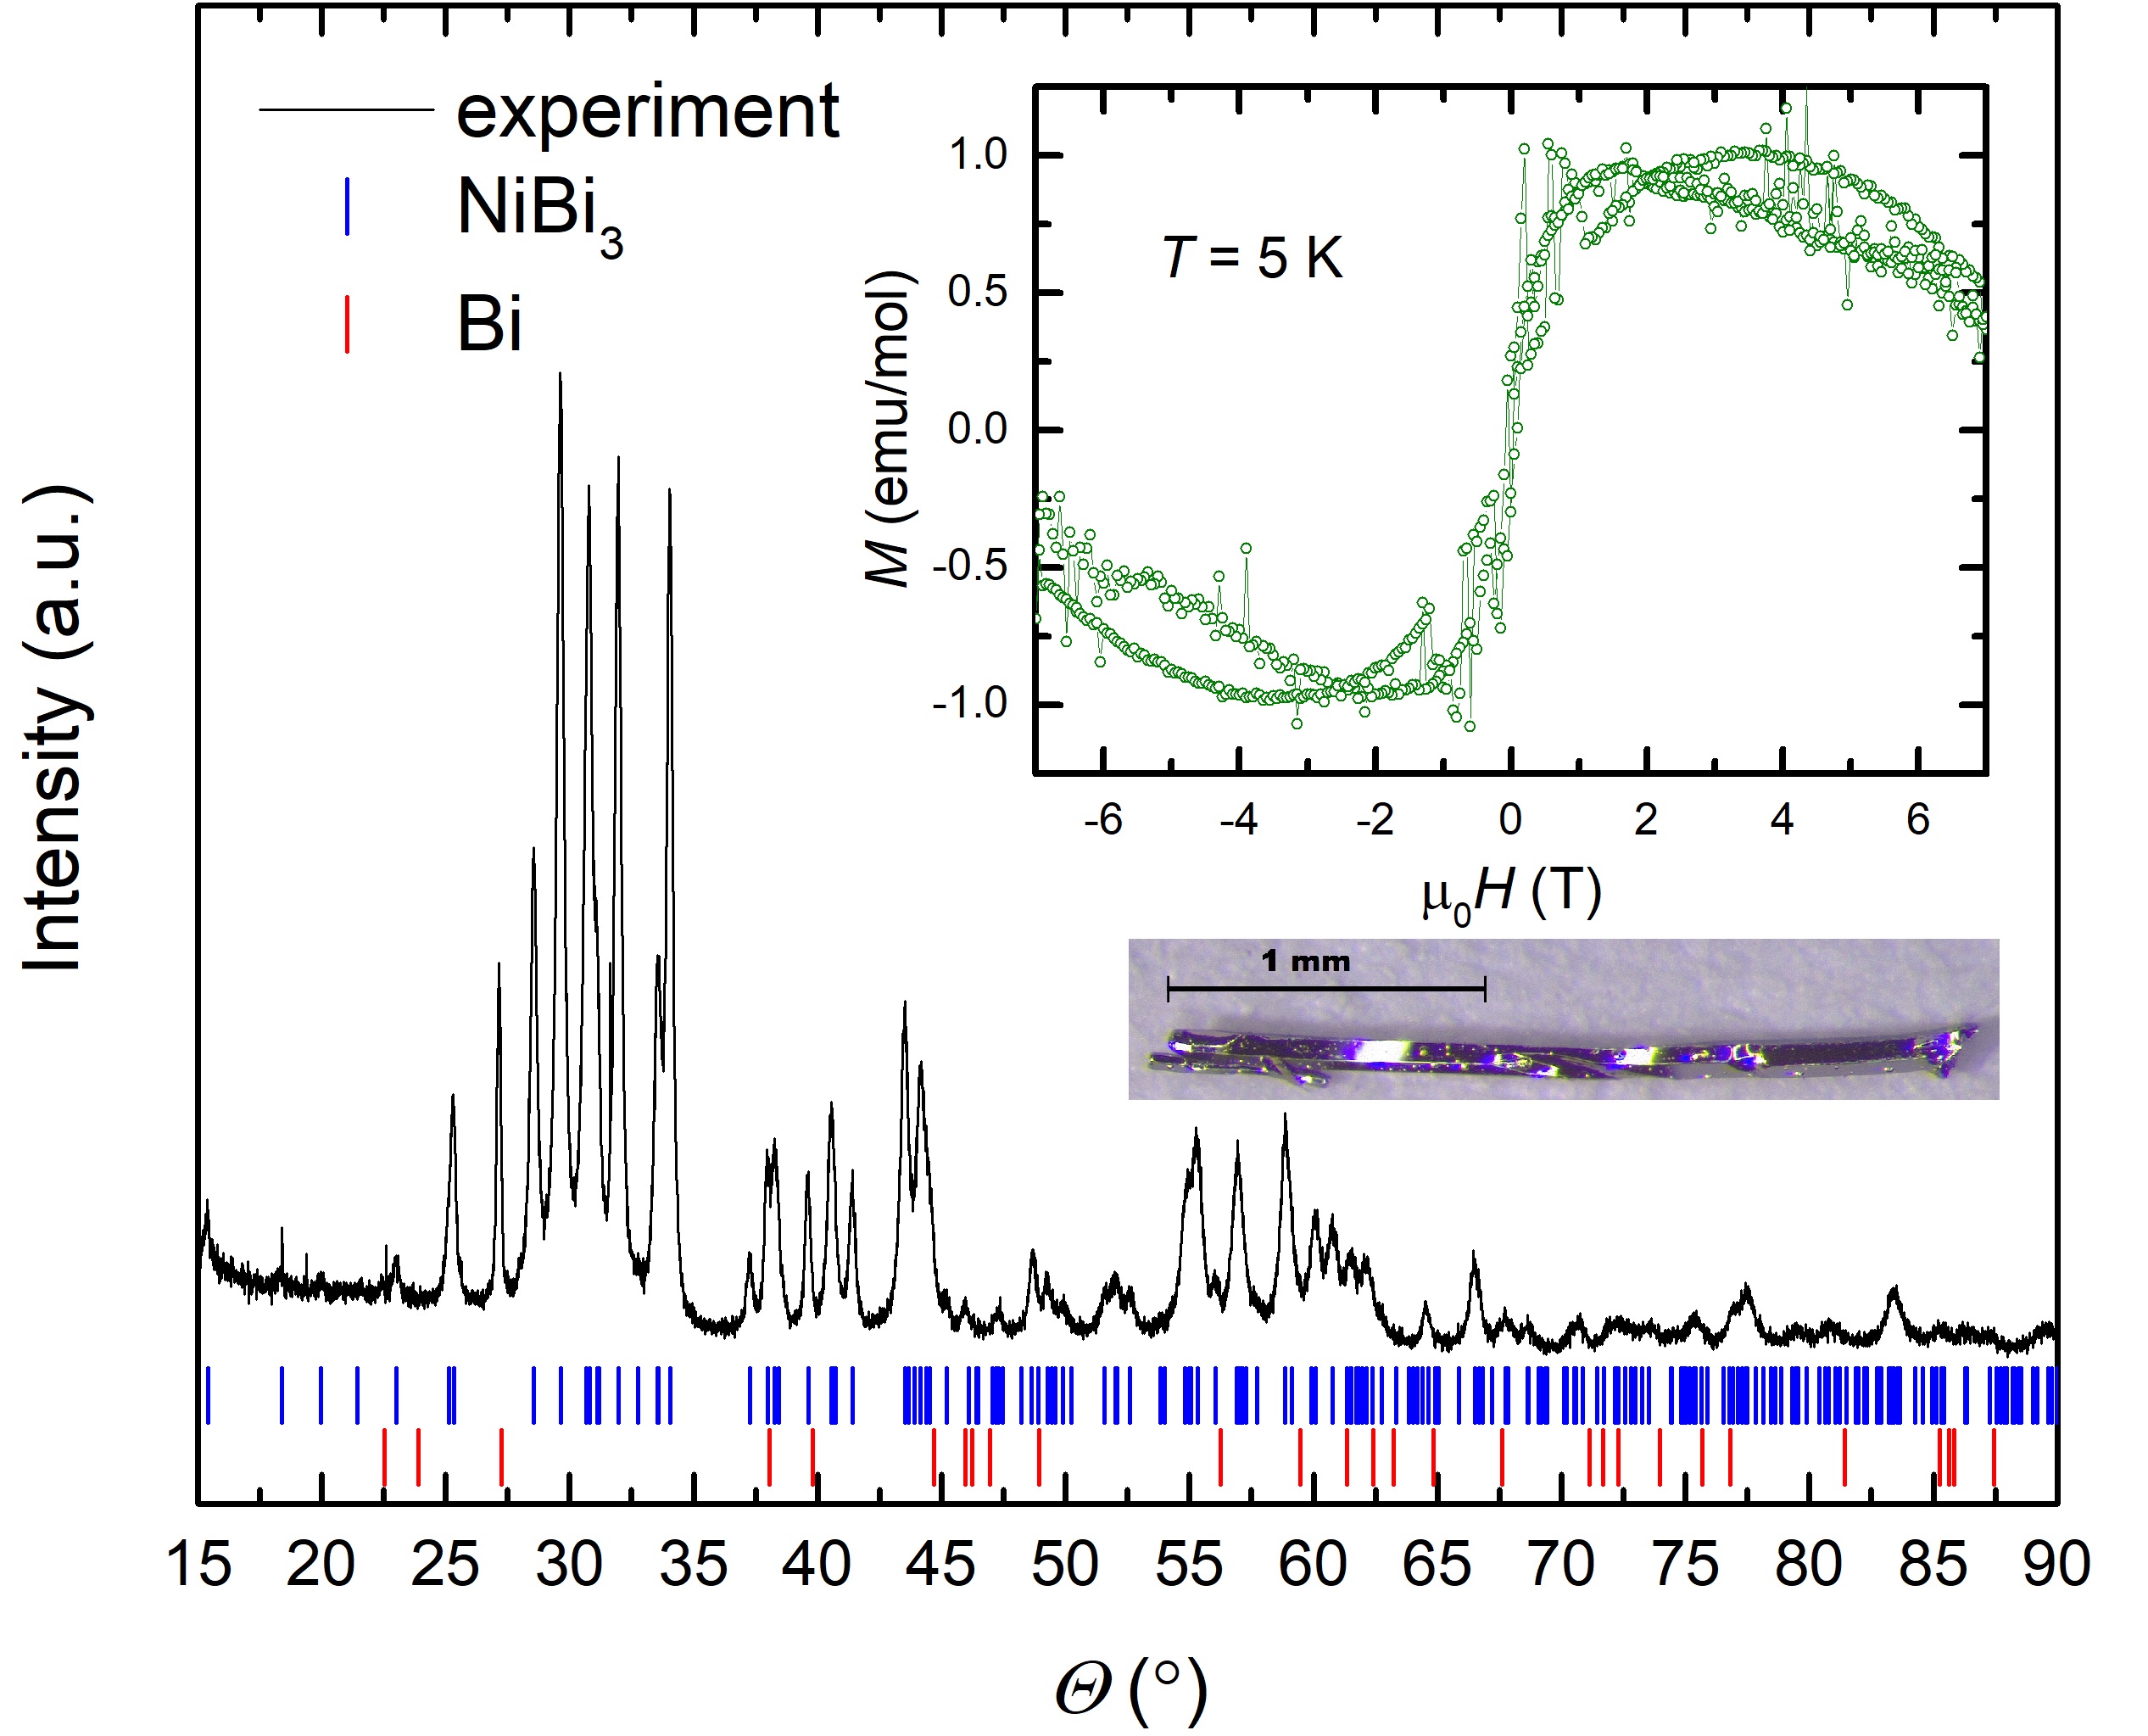
In light of a previous report of amorphous Ni in flux-grown single crystalline NiBi3 Silva13 , we note that our x-ray pattern does not indicate the presence of Ni impurities. However, as peaks from Ni might not be resolvable in x-ray diffraction due to small amount of Ni below the resolution limit and/or the amorphous nature of Ni impurities, we also performed measurements of the magnetization as a function of field, , at 5 K, i.e., at (see Fig. 1, top inset). This magnetization data set indicates weak ferromagnetism in the measured lump of NiBi3 samples. The measured moment is very small and corresponds to per formula unit. As our data is comparable to the literature results presented in Ref. Silva13 , we infer that small amounts of Ni impurities are present in our samples, most likely in droplets of excess Bi flux.
III.1.2 Pressure-dependent measurements
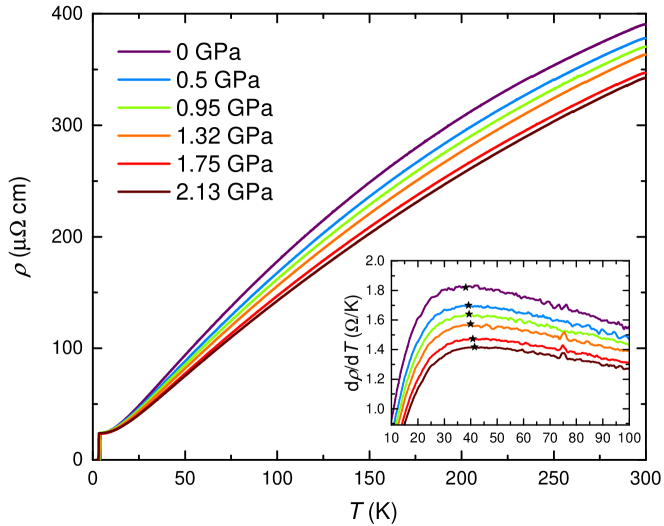
First, we focus on a discussion of the effect of pressure on the superconducting properties of NiBi3 and discuss the change of the critical temperature with pressure . Figure 2 presents resistivity, , and magnetization, , data as a function of for various pressures up to 2.1 GPa and 1.2 GPa, respectively. At ambient pressure, we find a relatively sharp resistance transition at K corresponding to the onset of superconductivity. The sharp feature in resistance is accompanied by a clear drop in which reflects the onset of diamagnetism. This is very consistent with various reports in literature on samples grown with different methods, which typically should give rise to different ferromagnetic impurity concentrations. This rules out a significant influence of the Ni impurities on the superconducting properties of NiBi3. Upon applying pressure, the transitions seen in and shift to lower temperatures. Importantly, we do not find any significant broadening of the features in or in even up to the highest pressures of our experiment. This is consistent with the good hydrostatic conditions provided by our pressure environment.
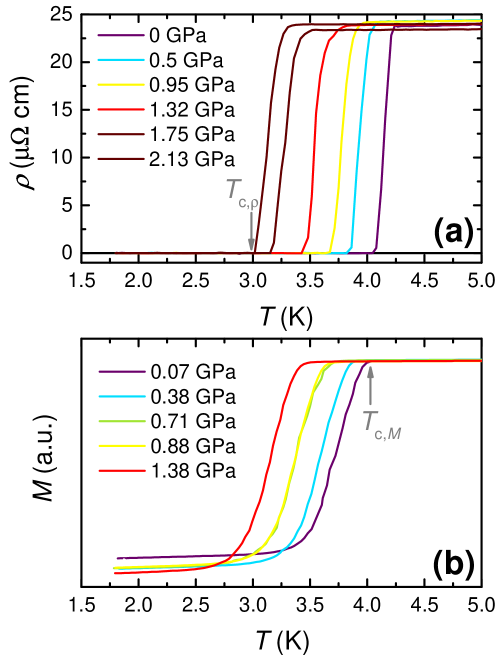
To compile a temperature-pressure phase diagram from the data presented in Fig. 2, we use the following criteria to determine from the present data sets (see arrows in Fig. 2): The critical temperature from resistivity is defined as the temperature at which the resistance reaches zero. The critical temperature from magnetization is inferred from the onset of the drop in , i.e., the temperature at which the magnetization reaches 5 % of the value at 1.8 K. The resulting - phase diagram is presented in Fig. 3. It should be noted that we find a somewhat lower value of compared to for all pressures investigated. This can most likely be related to the shift of by the small field of 2 mT applied in measurements of the magnetization. Although, the extracted ambient-pressure values are in good agreement with previously-published literature results Alekseevskii52 ; Fujimori00 , we find an unambiguous decrease in with increasing pressure . This is in contrast to earlier results Alekseevskii52 . Initially, is suppressed with a rate of d/d K/GPa. Upon increasing the pressure, d/d nearly doubles and reaches a value of up to d/d-0.55 K/GPa at 2 GPa (see dashed lines).

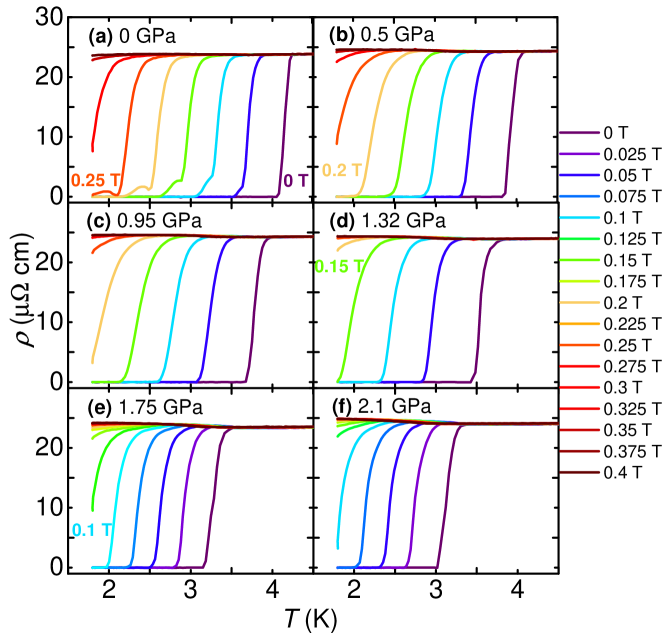
To provide a further characterization of the superconducting state under pressure, we studied the response of the superconducting transition to external fields, , to obtain the pressure dependence of the upper critical field . Figure 4 shows the behavior of at different fields between 0 T and 0.4 T at six representative applied pressure values. For all measurements shown, the field was applied perpendicular to the long needle axis of the crystal, i.e., perpendicular to the crystallographic axis. At ambient pressure, relatively small fields suppress until the zero-resistance state cannot be reached in a field of 0.25 T down to 1.8 K, the lowest temperature for these measurements. We stress that upon applying field the resistance feature remains fairly sharp. Only in a small field range 0.125 T T a small kink at the low-temperature side of the jump is observed. The origin of the kink is unknown at present. However, at higher pressures this kink is absent and we find only a small increase in broadening in small fields. Our data (see Fig. 5 (a)) show that is reduced (along with ) with increasing : A field of 0.1 T is sufficient at the highest pressure of 2.1 GPa to not observe zero resistance at K.
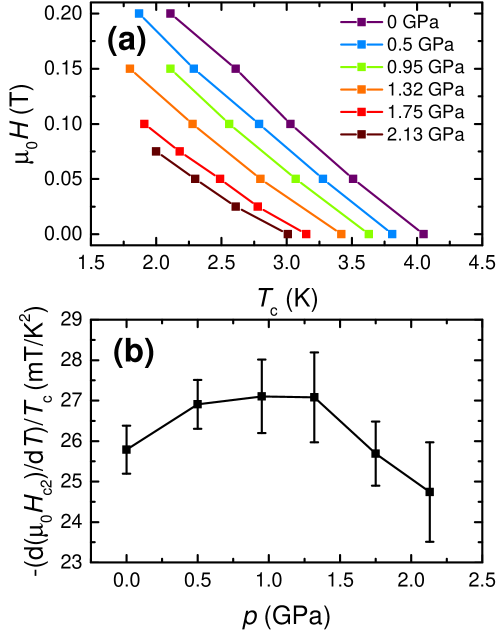
A quantitative analysis of the pressure dependence of is obtained by evaluating at different using the same criterion as defined above. The result of this analysis is presented in Fig. 5 (a). For all pressures, we find an almost linear dependence of with over the investigated temperature range 0.51. At ambient pressure the slope -(d/d) 105 mT/K. This linear dependence with similar slope (-(d/d) mT/K for field applied in the same direction as in the present study) was already reported in a previous ambient-pressure study of the superconducting properties of NiBi3 Fujimori00 . Upon increasing the pressure, the slope -(d/d) is reduced by 25 at GPa.
In general, the slope of normalized by , i.e., -(d/d)/, reveals information about the Fermi velocity, , and the superconducting gap structure Kogan12 ; Taufour14 . In a single-band model, in the clean limit, it was shown that
| (1) |
Even if such a single-band model likely represents a drastic simplification of the real band structure of the present material (see below for a detailed discussion of the band structure), changes in the normalized slope might be attributed to changes of the Fermi surface and/or the superconducting gap structure. This formalism was already successfully applied in various multi-band pnictide superconductors, such as KFe2As2 Taufour14 , where abrupt Fermi surface changes at some critical pressure are reported in literature, or FeSe Kaluarachchi16 . However, the normalized slope of as a function of in the present case of NiBi3, presented in Fig. 5 (b), reveals only a smooth and broad maximum without any clear signatures of an anomalous behavior. This small change of with might indicate minor changes of the Fermi surface under . These, in turn, might also be associated with the slight non-linearity in vs. , discussed earlier. Nevertheless, due to the absence of a sudden change in we infer that no significant, abrupt change of the Fermi surface and the superconducting gap structure occurs over the investigated range.
Next, we discuss our results on the normal-state properties of NiBi3, based on a study of the resistivity up to room temperature. Figure 6 shows at different constant pressures for 1.8 K K. Our ambient-pressure results are in agreement with previous literature results; we find a steep increase of above without indications for an extended regime in which holds. At K, d/d exhibits its maximum (see inset of Fig. 6). At even higher temperatures increases monotonically, however, d/d is reduced below 1 upon increasing . Thus, tends toward saturation at high temperature ( K). The residual resistivity ratio ( = ) for the present sample is and is thus as large as previously reported RRRs Fujimori00 ; Nedellec85 indicating a similar good quality of the single crystal used in the present study. Upon applying pressure, we find an overall reduction of at high temperatures whereas the low-temperature resistance is almost unaffected. However, the overall behavior of stays essentially the same. This includes the broad maximum in d/d occuring at lower and the resistance tending to saturate at higher . In particular, there is no evidence for any phase transition other than superconductivity occurring over investigated - range.
Earlier studies Fujimori00 ; Nedellec85 of the resistivity behavior of NiBi3 already pointed out the unusual -dependence of , i.e., the saturation of at high , which deviates from the behavior accounted for by the Bloch-Grüneisen model. The latter describes the -dependent contribution of electron-phonon scattering to . In previous reports, this discrepancy was explained by a reduction of the inelastic mean-free path at high . However, the origin of this reduction is not yet clarified. Nevertheless, the resistivity behavior at intermediate temperatures (K) is likely to be dominated by electron-phonon scattering. The contribution of electron-phonon-scattering, as described by the Grüneisen-Bloch model, typically gives rise to a maximum in d/d at . It indicates the crossover from the low-temperature for behavior to the in- linear behavior dominating at high . The size of is directly related to the size of the Debye temperature , i.e., as larger the larger is. Thus, the evolution of with pressure allows one to track the evolution of with pressure. We find that increases from K at ambient pressure to K at GPa. This corresponds to a d/d1.5 K/GPa. Thus, we infer an increase of with which is typical for various materials (see e.g. Kaluarachchi17 ) as the lattice usually hardens upon pressurization.
III.2 Theoretical DFT results
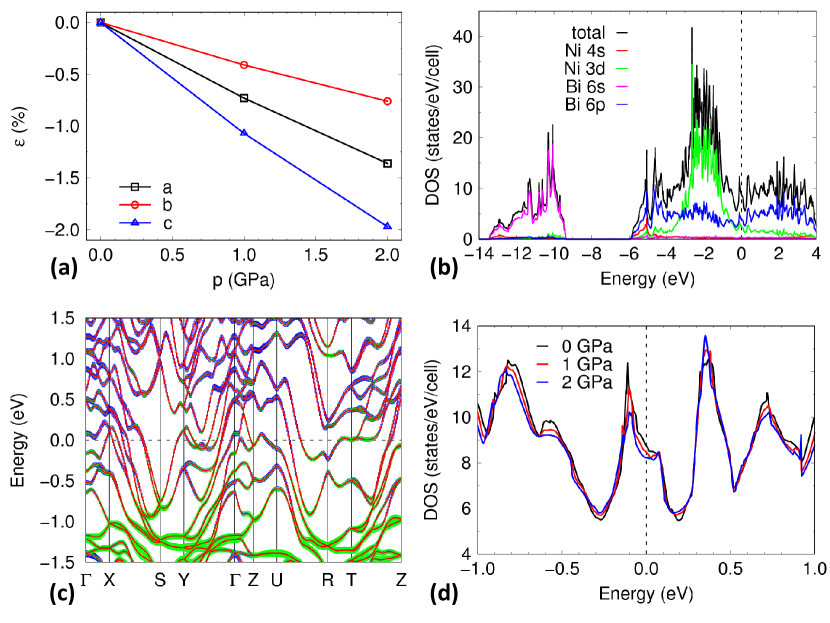
To study the effects of hydrostatic pressure on the properties of NiBi3, we have carried out DFT band structure calculations at different pressures. The SOC is included in the DFT calculations to account for the presence of heavy Bi. We chose PBEsol as the exchange-correlation functional because it reduces the overestimation of bond length, a well-known problem for regular PBE. For NiBi3 at zero pressure, the fully relaxed lattice constants with PBEsol+SOC are Å, Å and Å, which agree very well (within 1%) with the experimental values Ruck06 of 8.879 Å, 4.0998 Å and 11.483 Å, respectively. The calculated bulk modulus is 38.5 GPa. Figure 7(a) shows the relative change of the lattice constants with respect to zero pressure, or strain in each direction , under hydostratic pressures of and 2 GPa. The strains are almost linear functions of pressure. At 2 GPa, the strain along is the largest (−1.97%), followed by the strain along (−1.36%) and the strain along is the smallest (−0.76%). This results in a 4% reduction of the unit cell volume at GPa, compared to the ambient-pressure unit cell volume.
Figure 7 (b) plots the total DOS at zero applied pressure as well as the DOS projected on Ni 4s, Ni 3d, Bi 6s and Bi 6p orbitals with the Fermi energy () set at 0 eV. The bands in the low energy range of 14 to 9 eV are derived mostly from Bi 6s orbitals and are separated by a gap from rest of the bands. The bands derived from Ni 4s orbitals are mainly in the energy range of 6 to 5 eV. Most of the features in the broad energy range from 6 to +4 eV are derived from Ni 3d and Bi 6p orbitals, which have strong band overlap and hybridization, agreeing with the earlier study Kumar11 . The main features of Ni 3d bands are located in the energy range from 3 to 1 eV and are almost filled. In a distinct contrast, the Bi 6p bands spread out in the full energy range. Right at the , the contribution from Bi is 61%, substantially larger than that from Ni 39%. This result is different from an earlier study Kumar11 , where the projections on different Bi sites were not summed up. To confirm these orbital projection features, the band structure together with orbital projections around is shown in Fig. 7 (c). There are 6 bands crossing the as clearly seen in the X-S direction. The green (blue) vertical bars on the band structure give the relative magnitude of projection on the Ni 3d (Bi 6p) orbitals. At lower energy, the bands dominantly have Ni 3d orbital character. Moving toward , the orbital character of Bi 6p increases, while that of Ni 3d decreases. At the , the bands have more orbital character from Bi 6p than Ni 3d, agreeing with the projected DOS results in Fig. 7 (b).
Figure 7 (d) shows the total DOS at 0, 1 and 2 GPa zoomed in around . Under hydrostatic pressure, the unit cell volume is reduced, which increases the band overlap and hybridization. This means that the total energy range spanned by DOS increases, as also shown in Fig. 7 (d) by the shifting of the DOS peaks around 1 eV to lower energy and those around +1 eV to higher energy. As a result, the number of states at , , is reduced with pressure. Another way to understand this is that the increased slope in band dispersions due stronger hybridization results in fewer states per energy. The total is 8.8 state/eV/cell at GPa, and reduced to 8.5 at 1 GPa and 8.2 at 2 GPa. The calculated ambient-pressure value of is consistent with the value of states/eV/cell, extracted from an experimental determination of the Sommerfeld coefficient via specific heat measurements Fujimori00 .
IV Discussion
To gain further insight into the nature of superconductivity in NiBi3, we check in the following whether our results of the pressure dependence of can be described in the framework of the Bardeen-Cooper-Schrieffer (BCS) theory of superconductivity. Within this theory, the critical temperature is determined by the Debye temperature , the electron-phonon coupling potential and the density of states at the Fermi energy via
| (2) |
Note that this approach is very simplified, as it presents a theory for weak-coupling superconductors and neglects other effects, such as electron-electron interactions. Even though there are more sophisticated approaches to model available, such as the McMillan equation, we restrict ourselves to the discussion of the simpler BCS equation due to the smaller number of unknown parameters.
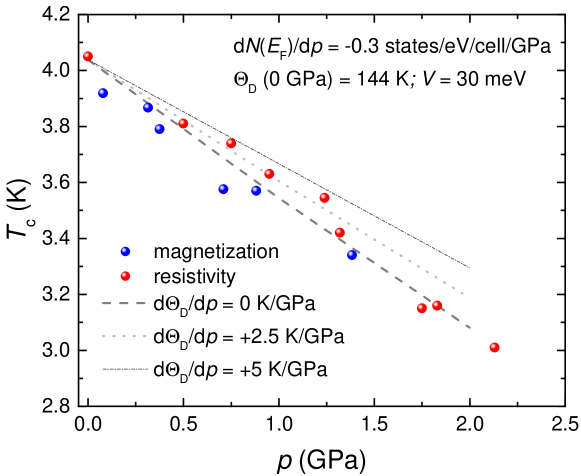
At ambient pressure, K was determined from an analysis of specific heat data Fujimori00 ; Kumar11 . By using GPa) determined in the present work and the ambient-pressure of 4.03 K, we infer an electron-phonon potential meV. This value is of the order of values determined for other BCS superconductors Knoener17 .
In order to evaluate the pressure dependence, we consider three cases: First, we consider the case in which the pressure dependence of is solely determined by the pressure dependence of . As outlined in Sec. III.2, the latter is given by d/d states/eV/cell/GPa. In the second and third case, we allow for a pressure dependence of . To this end, we assume that the pressure dependence of is of the same order of magnitude as the pressure dependence of . Therefore we chose two different pressure dependencies for our calculations (d/d = +2.5 K/GPa and d/d = +5 K/GPa). Note that d/d = +5 K/GPa most likely corresponds to the upper limit of the pressure dependence of . In all cases, we treat the electron-phonon potential as pressure-independent. The results of applying equation 2 for the three cases are shown as dashed, dotted and dashed-dotted lines in Fig. 8, together with the experimentally-determined data. We find a very good agreement of all three calculations to the measured experimental data. Importantly, all three scenarios yield a decrease of with , thus demonstrating, that the decrease of density of states at the Fermi edge with is responsible for the decrease in . Thus, while also taking into account our observation of an almost pressure-independent Fermi velocity , we summarize that superconductivity in NiBi3 can be described in the framework of BCS theory. Therefore, NiBi3 is most likely a conventional electron-phonon-mediated superconductor. Our conclusion is supported by a recent report of Andreev spectroscopy data Zhao18 which demonstrated singlet -wave superconductivity in NiBi3, as well as with analyses of the specific heat jump at Kumar11 .
V Summary
In conclusion, we studied the properties of the superconductor NiBi3 under pressure in a combined experimental and theoretical effort. Our results of resistivity and magnetization measurements under pressure indicate a moderate, slightly non-linear decrease of the superconducting critical temperature with pressure (d/d0.45 K/GPa). The slight non-linearity of is accompanied by a broad maximum in the normalized slope of the upper critical field, -(d()/d)/, indicating minor changes of the Fermi surface under pressure. The pressure dependence of can be described in the framework of BCS theory on a quantitative level indicating that the suppression of with can be attributed to a loss of density of states at the Fermi energy with . Thus, we infer that NiBi3 is a conventional electron-phonon mediated superconductor.
VI Acknowledgements
We thank Peter P. Orth for useful discussions. This work was carried out at Iowa State University and supported by Ames Laboratory, US DOE, under Contract No. DE-AC02-07CH11358. L. X. was supported, in part, by the W. M. Keck Foundation.
References
- [1] A. Isaeva, B. Rasche, and M. Ruck. Bismuth-based candidates for topological insulators: Chemistry beyond Bi2Te3. Physica Status Solidi (RRL) – Rapid Research Letters, 7(1‐2):39–49, 2013.
- [2] Y. Xia, D. Qian, D. Hsieh, L. Wray, A. Pal, H. Lin, A. Bansil, D. Grauer, Y. S. Hor, R. J. Cava, and M. Z. Hasan. Observation of a large-gap topological-insulator class with a single Dirac cone on the surface. Nature Physics, 5:398–402, 2009.
- [3] Y. L. Chen, J. G. Analytis, J.-H. Chu, Z. K. Liu, S.-K. Mo, X. L. Qi, H. J. Zhang, D. H. Lu, X. Dai, Z. Fang, S. C. Zhang, I. R. Fisher, Z. Hussain, and Z.-X. Shen. Experimental Realization of a Three-Dimensional Topological Insulator, Bi2Te3. Science, 325(5937):178–181, 2009.
- [4] D. F. Shao, X. Luo, W. J. Lu, L. Hu, X. D. Zhu, W. H. Song, X. B. Zhu, and Y. P. Sun. Spin-orbit coupling enhanced superconductivity in Bi-rich compounds ABi3 (A = Sr and Ba). Scientific Reports, 6(21484), 2016.
- [5] C. Nayak, S.H. Simon, A. Stern, M. Freedman, and S. Das Sarma. Non-Abelian anyons and topological quantum computation. Rev. Mod. Phys., 80:1083–1159, Sep 2008.
- [6] M. Sato and Y. Ando. Topological superconductors: a review. Reports on Progress in Physics, 80(7):076501, 2017.
- [7] S. Sasaki, M. Kriener, K. Segawa, K. Yada, Y. Tanaka, M. Sato, and Y. Ando. Topological Superconductivity in . Phys. Rev. Lett., 107:217001, Nov 2011.
- [8] N. E. Alekseevskii, N. B. Brandt, and T. I. Kostina. Superconductivity of binary alloys of bismuth. Izvestiya Akademii Nauk SSSR, Seriya Fizicheskaya, 16:233–263, 1952.
- [9] B. Lorenz and C. Chu. High Pressure Effects on Superconductivity in ”Frontiers in Superconducting Materials”. Springer, Berlin, Heidelberg, 2005.
- [10] P.C. Canfield and Z. Fisk. Growth of single crystals from metallic fluxes. Philosophical Magazine B, 65(6):1117–1123, 1992.
- [11] P.C. Canfield, T. Kong, U.S. Kaluarachchi, and N. Jo. Use of frit-disc crucibles for routine and exploratory solution growth of single crystalline samples. Philosophical Magazine, 96(1):84–92, 2016.
- [12] S.L. Bud’ko, A.N. Voronovskii, A.G. Gapotchenko, and E.S. ltskevich. The Fermi surface of cadmium at an electron-topological phase transition under pressure. Zh. Eksp. Teor. Fiz., 86(778), 1984.
- [13] J. D. Thompson. Low‐temperature pressure variations in a self‐clamping pressure cell. Review of Scientific Instruments, 55(2):231–234, 1984.
- [14] S. K. Kim, M. S. Torikachvili, E. Colombier, A. Thaler, S. L. Bud’ko, and P. C. Canfield. Combined effects of pressure and Ru substitution on BaFe2As2. Phys. Rev. B, 84:134525, Oct 2011.
- [15] B. Bireckoven and J. Wittig. A diamond anvil cell for the investigation of superconductivity under pressures of up to 50 GPa: Pb as a low temperature manometer. Journal of Physics E: Scientific Instruments, 21(9):841, 1988.
- [16] https://www.qdusa.com/sitedocs/productBrochures/High_Pressure_Cell_for_Magnetometry_Brochure.pdf.
- [17] K. Yokogawa, K. Murata, H. Yoshino, and S. Aoyama. Solidification of High-Pressure Medium Daphne 7373. Japanese Journal of Applied Physics, 46(6R):3636, 2007.
- [18] P. Hohenberg and W. Kohn. Inhomogeneous Electron Gas. Phys. Rev., 136:B864–B871, Nov 1964.
- [19] W. Kohn and L. J. Sham. Self-Consistent Equations Including Exchange and Correlation Effects. Phys. Rev., 140:A1133–A1138, Nov 1965.
- [20] G. Kresse and J. Furthmüller. Efficient iterative schemes for ab initio total-energy calculations using a plane-wave basis set. Phys. Rev. B, 54:11169–11186, Oct 1996.
- [21] G. Kresse and J. Furthmüller. Efficiency of ab-initio total energy calculations for metals and semiconductors using a plane-wave basis set. Computational Materials Science, 6(1):15 – 50, 1996.
- [22] P. E. Blöchl. Projector augmented-wave method. Phys. Rev. B, 50:17953–17979, Dec 1994.
- [23] H.J. Monkhorst and J.D. Pack. Special points for Brillouin-zone integrations. Phys. Rev. B, 13:5188–5192, Jun 1976.
- [24] B. Silva, R. F. Luccas, N. M. Nemes, J. Hanko, M. R. Osorio, P. Kulkarni, F. Mompean, M. García-Hernández, M. A. Ramos, S. Vieira, and H. Suderow. Superconductivity and magnetism on flux-grown single crystals of NiBi3. Phys. Rev. B, 88:184508, Nov 2013.
- [25] Y. Fujimori, S. Kan, B. Shinozaki, and T. Kawaguti. Superconducting and Normal State Properties of NiBi3. Journal of the Physical Society of Japan, 69(9):3017–3026, 2000.
- [26] V.G. Kogan and R. Prozorov. Orbital upper critical field and its anisotropy of clean one- and two-band superconductors. Reports on Progress in Physics, 75(11):114502, 2012.
- [27] V. Taufour, N. Foroozani, M.A. Tanatar, J. Lim, U. Kaluarachchi, S.K. Kim, Y. Liu, T.A. Lograsso, V.G. Kogan, R. Prozorov, S.L. Bud’ko, J.S. Schilling, and P.C. Canfield. Upper critical field of under pressure: A test for the change in the superconducting gap structure. Phys. Rev. B, 89:220509, Jun 2014.
- [28] U.S. Kaluarachchi, V. Taufour, A.E. Böhmer, M.A. Tanatar, S.L. Bud’ko, V.G. Kogan, R. Prozorov, and P.C. Canfield. Nonmonotonic pressure evolution of the upper critical field in superconducting FeSe. Phys. Rev. B, 93:064503, Feb 2016.
- [29] P. Nedellec, F.V. Creepy, L. Dumoulin, and J.P. Burger. Anomalous electrical resistivity of Bi3Ni. Physics Letters, 111A(1,2), 1985.
- [30] U.S. Kaluarachchi, Y. Deng, M.F. Besser, K. Sun, L. Zhou, M.C. Nguyen, Z. Yuan, C. Zhang, J.S. Schilling, M.J. Kramer, S. Jia, C. Wang, K. Ho, P.C. Canfield, and S.L. Bud’ko. Highly responsive ground state of PbTaSe2: Structural phase transition and evolution of superconductivity under pressure. Phys. Rev. B, 95:224508, Jun 2017.
- [31] M. Ruck and T Söhnel. Transmission-Optimized Single-Crystal Structure Determination and Electronic Structure of Bi3Ni. Zeitschrift für Naturforschung B, 61:785–791, 2006.
- [32] J. Kumar, A. Kumar, A. Vajpayee, B. Gahtori, D. Sharma, P.K. Ahluwalia, S. Auluck, and V.P.S. Awana. Physical property and electronic structure characterization of bulk superconducting Bi3Ni. Superconductor Science and Technology, 24(8):085002, 2011.
- [33] S. Knöner, E. Gati, B. Wolf, M. de Souza, A. Haghighirad, M. Kuhnt, W. Assmus, H.O. Jeschke, M. Tomić, R. Valentí, and M. Lang. Combined experimental and theoretical studies of pressure effects in La2Sb. physica status solidi (b), 254(1):1600168, 2017.
- [34] G.J. Zhao, X.X. Gong, P.C. Xu, B.C. Li, Z.Y. Huang, X.F. Jin, X.D. Zhu, and T.Y. Chen. Singlet superconductivity in single-crystal NiBi3 superconductor. arXiv: 1805.09811, Apr 2018.