Sensitivity study for the 12C()16O
astrophysical reaction rate
R. J. Holt1,2, B.W. Filippone2, and Steven C. Pieper1
1Physics Division, Argonne National Laboratory, Argonne, Illinois 60439
2Kellogg Radiation Laboratory, California Institute of Technology, Pasadena, California 91125
The 12C()16O reaction has a key role in nuclear astrophysics. A multilevel R-matrix analysis was used to make extrapolations of the astrophysical S factor for this reaction to the stellar energy of 300 keV. The statistical precision of the S-factor extrapolation was determined by performing multiple fits to existing randomized E1 and E2 ground state data, according to experimental errors. The impact of a future proposed experiment at Jefferson Laboratory (JLab) was assessed within this framework. The proposed JLab experiment will make use of a high-intensity low-energy bremsstrahlung beam that impinges on an oxygen-rich single-fluid bubble chamber in order to measure the total cross section for the inverse 16O()12C reaction. The importance of low energy data as well as high precision data was investigated.
PRESENTED AT
Thirteenth Conference on the Intersections of Particle and Nuclear Physics (CIPANP2018)
Palm Springs, California, USA, May 29-June 3, 2018Report No. CIPANP2018-Holt
1 Introduction
The 12C()16O reaction is believed to be one of the most important reactions in nuclear astrophysics. The purpose of this study is not to provide an improved R-matrix analysis of the data for this reaction, but rather to have a reasonable R-matrix fit that can be used as a basis for comparison to fits with and without projected JLab data in order to assess the possible role of the JLab data in reducing the overall uncertainty in the cross section. An excellent R-matrix analysis of this reaction and review of the subject is given in ref.[1]. In the present work, the R-matrix was used to calculate the total cross section, , for alpha-capture to the ground state. The cross section was then used to calculate the astrophysical factor given by
| (1) |
where is the energy in the center of mass and is the Sommerfeld parameter, and is the reduced mass of the carbon ion and alpha particle. Measurements of the factor as a function of energy are often reported in the literature. For the 12C()16O reaction, the value of at is typically quoted as this is the most probable energy for stellar helium burning. Of course, the cross section is so small at 300 keV that it cannot be directly measured. Thus, extrapolations to 300 keV must be performed to study the impact of data on the extrapolation.
2 R-matrix approach
According to the R-matrix theory, the nuclear wave function, , can be expanded in terms of a complete set of states, .
| (2) |
where is a Coulomb phase shift and is the matrix that relates the internal wave function and the observed resonances.
| (3) |
where is a level energy, is the Kronecker delta and is given in terms of the Coulomb shift factor, , the boundary condition constant, , and the Coulomb penetration factor, ,
| (4) |
where c refers to the available channels, in this case essentially the channel only, and are the reduced width amplitudes.
In this simple R-matrix analysis, we assume that only two channels are open: photon and alpha. The collision matrix for radiative capture of multipolarity to the ground state is given by
| (5) |
where and are the ground state and radiative widths, respectively. The cross section was then calculated from the collision matrix.
Only ground state transitions and excitations were taken into account in this analysis. Furthermore, only statistical errors were considered in this study. A channel radius of 5.43 fm was chosen to be consistent with a previous analysis[1]. Five E1 resonance levels and four E2 resonance levels were employed in the internal part of the the R-matrix analysis. This analysis is similar to that of ref[2], ref[3], and the details comport with Lane and Thomas[4]. In order to speed up the computations, the external part was turned off in the present analysis. This external contribution is most sensitive to the E2 part of the cross section since the E1 external part is greatly reduced by isospin symmetry. In fact, the external E1 part would vanish under perfect isospin conservation. The fit was performed for data less than 3 MeV where the external contribution is small for the E2 data. As a check, the external piece was turned on for several fits, but did not significantly change the results.
3 Fits and projections for SE1, SE2 and
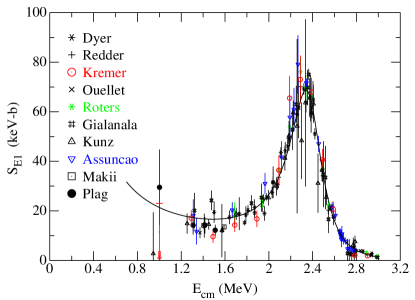
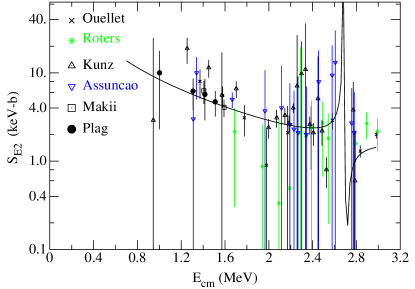
A SIMPLEX fitter was used for the present work. The best R-matrix fit of the existing E1 and E2 S-factor data, shown in Fig. 1, was taken as the most probable description of the S-factor data. In order to explore the statistical variation in the S-factor extrapolations, pseudo-data were then created by random variation according to a Gaussian probability distribution about the best fit S-factor values at the measured energies. In the random variations, the individual pseudo-data uncertainties were set equal to the measured uncertainties multiplied by the square root of the ratio of the original best fit values to the original measured values. For the subtheshold states the radiative widths were fixed at the measured values and the reduced alpha widths were allowed to vary. The reduced alpha and radiative width of the first excited E1 state were allowed to vary in the fit, while the radiative width of the fifth E1 state was allowed to vary. The radiative width of the fourth E2 R-matrix level was also allowed to vary. The first excited E2 state is very narrow and the parameters of this level were fixed at those of ref.[1]. All other parameters were fixed at those of ref.[1]. Also, following ref. [1], the fits were performed by maximizing rather than minimizing , where is given by
| (6) |
and is the usual quantity used in minimizations. Here is the function to be fitted to data, , with statistical error . The maximization has the feature that it reduces the impact of large error bar data on the fit and generally gives larger S-factor uncertainties in projected values of than that of a minimization.
The parameters of the bound levels are very important for the projection to 300 keV. The resonance energies were fixed, but the parameters, , depend on the reduced width of the levels. The reduced widths of the bound states were allowed to vary, so the varies. The R-matrix boundary condition constants were fixed to cancel out this effect for the second levels so that for these levels. For the third and higher levels, the reduced widths were not varied because alpha elastic scattering determined these widths and allowing them to vary did not make a significant difference.
The data sets used in the present fit are given in refs. [5, 6, 7, 8, 9, 10, 11, 12, 13, 14] and the E1 and E2 ground state data are shown in Fig.1. The parameters that were used in the R-matrix curve, shown in Fig. 1, are given in table 1.
| E1 | E2 | |||||
|---|---|---|---|---|---|---|
| Eλ (MeV) | (keV) | (eV) | Eλ (MeV) | (keV) | (eV) | |
| 1 | -0.335 | 132.1∗ | 0.055 | -0.448 | 89.9∗ | 0.097 |
| 2 | 2.416 | 409.4∗ | -0.0150∗ | 2.683 | 0.62 | -0.0057 |
| 3 | 5.298 | 99.2 | 5.6 | 4.407 | 83.0 | -0.65 |
| 4 | 5.835 | -29.9 | 42.0 | 6.092 | -349 | -1.02∗ |
| 5 | 10.07 | 500 | 0.604∗ | - | - | - |
The proposed JLab experiment[15] is expected to have several orders of magnitude improvement in luminosity over previous experiments and should provide data at the lowest practical values of energy. The best R-matrix fit of the E1 and E2 data was taken as the most probable description of the projected JLab data. These JLab pseudo data were then randomly varied based on their projected uncertainties according to a Gaussian probability distribution about the best fit S-factor values. In order to study the impact of proposed JLab data and low energy data in general, three fits were performed: a fit to existing E1 and E2 data (denoted by “all” in table 2), a fit to existing data and projected JLab data (denoted by “all J” in the table), and a fit to all data in Fig. 1 above 1.6 MeV (denoted by “E1.6” in the table). Since the projected JLab data will be below 1.6 MeV, the cutoff of data below 1.6 MeV will give an indication of the importance of the lower energy data. The S factors projected to 300 keV along with standard deviations, which represent the statistical fit uncertainty, are given in table 2 for the three cases. The reduced for the fit to the original data is also shown. As a test of the method, the error bars for the projected JLab data were arbitrarily reduced by an order of magnitude and the results are listed as “all J/10” in the table. Several observations can be made from the table. The first is that the standard deviation for the total projected S-factor with proposed JLab data is smaller than that without JLab data. Secondly, the total and E1 projections appear to be significantly larger for E1.6 MeV data than the fits to “all” data. Thirdly, as expected the standard deviations for the “all J/10” case are significantly smaller than that for the other cases. Finally, the S-factor projections for E2 appear to be about a third of those for E1.
| data | orig | S | SE1 | SE2 | |||
|---|---|---|---|---|---|---|---|
| all | 2.3 | 114.7 | 7.4 | 84.3 | 6.8 | 30.4 | 2.5 |
| all J | 2.3 | 117.4 | 5.7 | 84.1 | 5.6 | 33.7 | 2.3 |
| all J/10 | 2.5 | 119.9 | 2.1 | 83.3 | 2.7 | 36.5 | 1.1 |
| E1.6 | 2.6 | 132.8 | 4.2 | 100.6 | 3.6 | 32.2 | 2.5 |
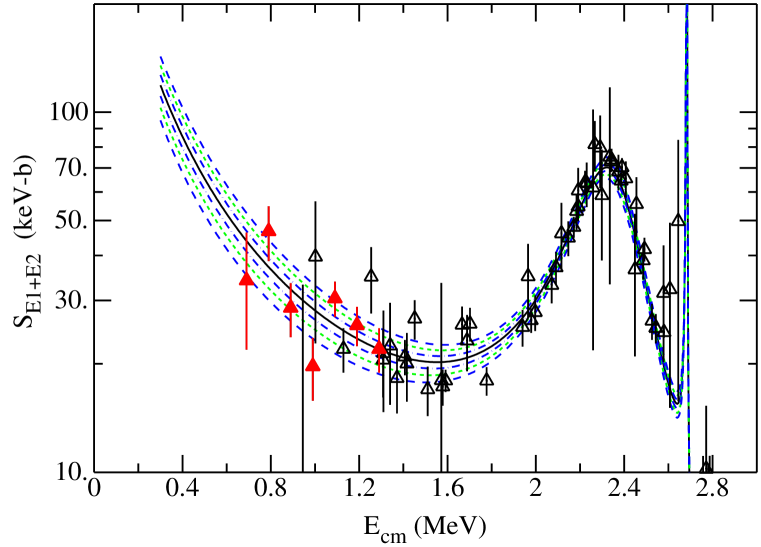
Fig. 2 shows curves that represent 1,2 and 3 standard deviation simultaneous fits to existing E1 and E2 data. The curves are generated by performing 500 fits to the data, generating 500 sets of parameters similar to those in table 1, and then using the parameter sets to determine the standard deviation at each value of energy. The two and three standard deviation curves were estimated by simply multiplying the one standard values by factors of two and three, respectively. The representative capture data, shown as open triangles, were taken as the sum of E1 and E2 results governed by where both E1 and E2 data exist. The projected JLab data are represented by red triangles in the figure. Given the statistical errors for the projected JLab data and the small number of values, one might not expect the projected JLab data to have a large impact on the statistical error. This figure illustrates the importance of providing new data with significantly smaller errors at lower energy.
4 Summary
The projected JLab data were taken to represent E1 + E2 data since only total cross sections to the ground state will be measured. The projected standard deviation for the 500 fits to the E1 and E2 data with the proposed JLab data is smaller than that without JLab data. The JLab data constrain the total E1 + E2 cross section in the fit. This leads to a smaller standard deviation than fitting E1 and E2 separately. Fitting only data above 1.6 MeV leads to a significant shift upward in the projected S-factor at 300 keV. This illustrates the importance of lower energy data in the extrapolation to 300 keV. Since the JLab experiment will provide new data below 1.6 MeV and even below existing data, we can infer that the proposed JLab data will have a significant impact on the value of the low energy extrapolation.
ACKNOWLEDGEMENTS
We thank O. Kirsebom for useful discussions. This work is supported by the U.S. National Science Foundation under grant 1506459. This work is supported by the U.S. Department of Energy (DOE), Office of Science, Office of Nuclear Physics, under contract No. DE-AC02-06CH11357.
References
- [1] R. J. deBoer et al. The 12C(α,γ)16O reaction and its implications for stellar helium burning. Rev. Mod. Phys., 89(3):035007, 2017.
- [2] R. E. Azuma et al. AZURE: An R-matrix code for nuclear astrophysics. Phys. Rev., C81:045805, 2010.
- [3] Roy J. Holt, Harold E. Jackson, Jr, R. M. Laszewski, J. E. Monahan, and J. R. Specht. Effects of channel and potential radiative transitions in the O-17 (gamma, n0) O-16 reaction. Phys. Rev., C18:1962–1972, 1978.
- [4] A. M. Lane and R. G. Thomas. R-Matrix Theory of Nuclear Reactions. Rev. Mod. Phys., 30:257–353, 1958.
- [5] P. Dyer and C. A. Barnes. The 12 C(alpha, gamma) 16 O reaction and stellar helium burning. Nucl. Phys., A233:495–520, 1974.
- [6] R. M. Kremer, C. A. Barnes, K. H. Chang, H. C. Evans, B. W. Filippone, K. H. Hahn, and L. W. Mitchell. Coincidence measurement of the C-12 (alpha, gamma) O-16 cross section at low energies. Phys. Rev. Lett., 60:1475–1478, 1988.
- [7] A. Redder, H. W. Becker, C. Rolfs, H. P. Trautvetter, T. R. Donoghue, T. C. Rinckel, J. W. Hammer, and K. Langanke. The 12 C(alpha, gamma) 16 O cross section at stellar energies. Nucl. Phys., A462:385–412, 1987.
- [8] J. M. L. Ouellet et al. C-12 (alpha, gamma) O-16 cross sections at stellar energies. Phys. Rev. Lett., 69:1896–1899, 1992.
- [9] G. Roters, C. Rolfs, F. Strieder, and H. Trautvetter. measurement of the C-12 (alpha, gamma) O-16 . Eur. Phys. J. A, 6:451–463, 1999.
- [10] L. Gialanella et al. A new measurement of the E1 amplitude in 12 C( alpha , gamma0 ) 16 O. Nucl. Phys., A688:254–258, 2001.
- [11] R. Kunz, M. Jaeger, A. Mayer, J. W. Hammer, G. Staudt, S. Harissopulos, and T. Paradellis. C-12 (alpha, gamma) O-16: The Key Reaction in Stellar Nucleosynthesis. Phys. Rev. Lett., 86:3244–3247, 2001.
- [12] M. Assuncao et al. E1 and E2S factors of C-12(alpha, gamma0) O-16 from gamma-ray angular distributions with a 4 pi-detector array. Phys. Rev., C73:055801, 2006.
- [13] H. Makii, Y. Nagai, T. Shima, M. Segawa, K. Mishima, H. Ueda, M. Igashira, and T. Ohsaki. E-1 and E-2 cross sections of the C-12 (alpha, gamma0) O-16 reaction using pulsed alpha beams. Phys. Rev., C80:065802, 2009.
- [14] R. Plag, R. Reifarth, M. Heil, F. Kappeler, G. Rupp, F. Voss, and K. Wisshak. C-12 (alpha, gamma) O-16 studied with the Karlsruhe 4pi Ba F-2 detector. Phys. Rev., C86:015805, 2012.
- [15] R. Suleiman et al. Measurement of 16O(,)12C with a bubble chamber and a bremsstrahlung beam. 2013. Jefferson Lab Proposal PR12-13-005.