Rabi oscillations of a quantum dot exciton coupled to acoustic phonons: coherence and population readout
Abstract
While the advanced coherent control of qubits is now routinely carried out in low frequency (GHz) systems like single spins, it is far more challenging to achieve for two-level systems in the optical domain. This is because the latter evolve typically in the THz range, calling for tools of ultrafast, coherent, nonlinear optics. Using four-wave mixing micro-spectroscopy, we here measure the optically driven dynamics of a single exciton quantum state confined in a semiconductor quantum dot. In a combined experimental and theoretical approach, we reveal the intrinsic Rabi oscillation dynamics by monitoring both central exciton quantities, i.e., its occupation and the microscopic coherence, as resolved by the four-wave mixing technique. In the frequency domain this oscillation generates the Autler-Townes splitting of the light-exciton dressed states, directly seen in the four-wave mixing spectra. We further demonstrate that the coupling to acoustic phonons strongly influences the FWM dynamics on the picosecond timescale, because it leads to transitions between the dressed states.
1 INTRODUCTION
The coherent control of individual spins and excitons in quantum dots (QDs) has been the scope of semiconductor quantum optics since many years. To unveil the potential lying in QDs and other single photon emitters for high-speed optical quantum technology, it is urgent to bring the manipulation schemes to perfection. This is nowadays approached using individual spins in electrically defined [1] and epitaxial [2, 3] QDs, as well as in color centers in diamond [4, 5], which is conditioned by setting up robust spin-photon interfacing. This difficulty can be mitigated using QD excitons: because of their direct coupling to light, the related coherent control protocols operate on the picosecond (ps) timescale [6]. The context of ultrafast control points to the subject of our work, focusing on optically driven coherent dynamics of the exciton state efficiently coupled to longitudinal acoustic (LA) phonons of the GaAs host matrix. Previous research has shown that by observing Ramsey fringes [7, 8] the quantum state of single localized excitons can be navigated on the Bloch sphere by varying the delay between two laser pulses with ps duration. It has also been demonstrated that by increasing the applied laser power the final exciton occupation after a single pulse can be adjusted [9, 10] by performing Rabi rotations. Excitations with chirped laser pulses have been used to realize robust state preparations via the so called rapid adiabatic passage effect [11, 12, 13, 14, 15, 16, 17]. A pump-probe experiment [18] and time-resolved resonance fluorescence [19] have been used to study the optically driven Rabi oscillation dynamics of the QD exciton occupation. Rabi oscillations have also been investigated in larger systems, i.e., in QD ensembles [20, 21, 22], quantum wells [23, 24] and quantum dash ensembles [25]. Note, that these Rabi oscillations have to be differentiated from Rabi rotations [9, 26, 27, 10, 28, 1, 30, 31]. The oscillations directly correspond to the dynamical aspect of the genuine Rabi problem [32]. Rabi rotations instead reflect the final exciton state and thus lack direct visibility of the temporal interplay between exciton and phonons.
We here propose and realize an original approach to monitor single exciton’s Rabi oscillations in the time domain. Namely, we use the delay dependence of four-wave mixing (FWM) signals to probe the dynamics of both central quantum mechanical quantities of a single QD exciton, i.e., its occupation and its microscopic coherence, which represent the entire quantum state or its Bloch vector. Note that combined with the time-dependence of the emitted signal, this delay dependence can be used to generate two-dimensional spectra. These provide a rich playground to study spectral features of coupled and uncoupled quantum systems [33, 34, 35, 36, 37, 38, 39]. Here, however, our focus is on the temporal evolution of the exciton quantum state. Our dual insight into Rabi oscillation dynamics of a single QD exciton represents a novel aspect and is enabled by the FWM methodology. In a combined experimental and theoretical study we investigate the dynamics of both quantities in FWM signals. When increasing the intensities of the exciting laser pulses, oscillations on the ps time scale build up during the optical driving. The measured oscillations directly reflect Rabi oscillations of the Bloch vector of an individual QD exciton. In exciton ensembles the isolation of a single Bloch vector has so far not been realized, because one always deals with a bunch of Bloch vectors undergoing different dynamics. Carrying out this study in the ultimate limit of a single QD exciton allows for an investigation of the fundamental interplay between the optically driven two-level system and its coupling to the host lattice via the exciton-phonon interaction.
2 EXPERIMENT AND THEORY
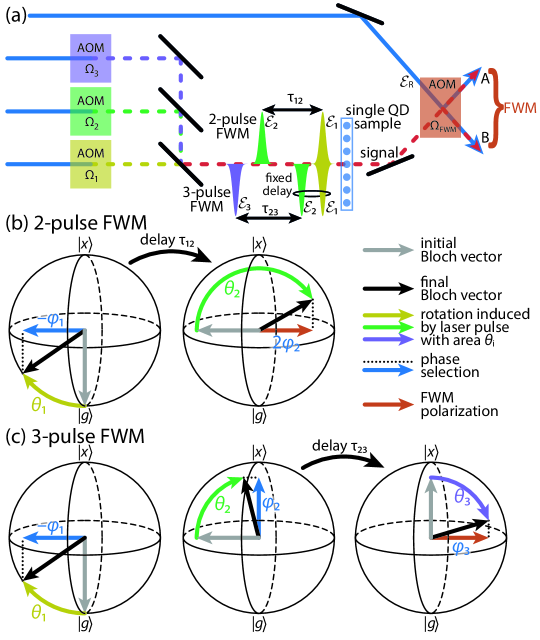
To measure FWM on individual QDs, we employ a three-beam heterodyne spectral interferometry setup optimized for the near-infrared spectral range [38] as schematically depicted in Fig. 1. The FWM is driven using a Ti:Sapphire femtosecond laser. The QD exciton is excited by Gaussian laser pulses, formed by a passive pulse shaper based on a diffraction grating. The pulse train is: i) split into three beams () and a reference beam , ii) the beams are individually phase-modulated using acousto-optic modulators (AOMs) operating at distinct radio-frequencies around 80 MHz, iii) the pulses are delayed with respect to one another by and , iv) their intensities , which are varied to scan the pulse areas , are controlled via fixed radio-frequency drivers. After steps i)–iv) propagate co-linearly and are focussed on the sample surface. The pulse shaper is also used to geometrically compensate the first-order chirp, attaining a focal spot close to the Fourier limit. FWM is retrieved in reflectance (note that, for the sake of readability, Fig. 1(a) shows a transmission configuration) by locking at the specific heterodyne frequency ( or ) and interfering it with the signal beam from the sample (red in Fig. 1(a)), which is phase-modulated with the same heterodyne frequency as . The FWM signal is retrieved by subtracting the intensities in channels A and B from each other, attaining the shot-noise limited detection. is also used to generate background free spectral interference on a CCD camera installed at the output of an imaging spectrometer.
In these experiments, the pulse durations, hereafter denoted as , arriving at the QD position are in a few hundred fs up to ten ps range. Therefore, the theoretical treatment of the optical excitation has to go beyond the computationally handy ultrashort-pulse limit, where analytic expressions for the FWM signals can be derived [40, 38]. To simulate the FWM signals of the optically driven QD we model the QD exciton as a two-level system coupled to LA phonons via the deformation potential mechanism [41]. The equations of motion for the occupation and the polarization are then obtained with the well established correlation-expansion approach [42]. The full set of equations of motion are given in Ref. [43]. Practically, to compute the FWM signal we drive the QD exciton with Gaussian laser pulses
in general with , the pulse areas , the dipole moment and the pulse duration at times . The central energy is , which is chosen to be in resonance with the exciton transition. We label each pulse with a phase with for two-pulse and with for three-pulse FWM. These phases correspond to the radio-frequency shifts in our experimental heterodyne detection scheme. The FWM signal is then isolated by filtering the resulting microscopic polarization with respect to the FWM phases or resulting in the FWM polarization . Here, denotes the ground state and the exciton state. Note that this filtering of the signal with respect to the phases directly mimics the heterodyne detection scheme. In particular, although both in experiment and in theory the lowest order contribution to the FWM signal is of the order , the signals are not limited to this order. Instead they include all nonlinear odd orders of the susceptibility . This allows us to directly resolve Rabi oscillations both in experiment and in theory. By varying the delay in two-pulse FWM and in three-pulse FWM we probe the coherence and population dynamics, respectively. This can be seen from the Bloch sphere (spanned by the real and imaginary part of and the exciton occupation ) schematics in Figs. 1(b, c). Due to the excitation with phase-modulated laser pulse train, for each repetition, the Bloch vector switches from its initial (grey) to its final state (black). The curved arrows represent the pulse areas of each driving pulse. The successive selection of the FWM phase after each pulse results in the final FWM polarization (orange arrow). In the experiment, optical heterodyning allows to probe a FWM representation of the Bloch vector dynamics in its rotating frame. Changing the delay () probes the dynamics of the polarization (population) in the case of two-pulse (three-pulse) FWM, as can be seen from the selected Bloch vector (dotted black line and blue arrow) directly before (). The simulations reaching delay times over 100 ps are computationally demanding, which makes finding appropriate system parameters like pulse areas, pulse duration and QD geometry quite challenging. Note, that we add a phenomenological long-time dephasing rate for the polarization and a spontaneous decay rate for the exciton occupation to the model when simulating dynamics in the 100 ps range.
3 RESULTS
We have recently shown that the pulse areas of the driving laser fields in FWM experiments have a strong influence on the system’s dynamics between the pulses. For instance, the visibility of quantum beats, arising due to the splittings in the excitonic level structure of a QD system, depends on the pulse area [38]. Furthermore, in a two-pulse FWM experiment the strength of the phonon-induced dephasing (PID) becomes more pronounced when increasing towards [1].
The pulse area dependence of the exciton quantum state is rather obvious, when considering the dynamics during the interaction with the laser field, i.e., Rabi oscillations take place. When keeping fixed and increasing and therefore , the exciton is excited and de-excited during the pulse more often. In the picture of the Bloch vector, it performs more rotations, which means that the rotation speed, i.e., the Rabi frequency , increases. Additionally, the coupling between exciton dynamics and phonons depends on the instantaneous Rabi frequency and the phonon spectral density . For the deformation potential coupling between the QD exciton and LA phonons scales like for small phonon frequencies [44]. For typical self-assembled InGaAs/GaAs QDs with sizes in the range of a few nm, the spectral density forms a broad maximum at in the range of a few ps-1, i.e., a few meV [45]. The upper cut-off frequency is roughly given by , where is the sound velocity and the localization length of the exciton. Therefore the strongest interaction between exciton and LA phonons lies in the range of .
In the limit of ultrafast laser pulse excitation, in the range of fs, we have shown that simulations in the delta-pulse limit yield a satisfactory agreement with experiments[38, 46]. In this limit, the properties of the excited phonons only depend on the final occupation of the exciton state [47]. Therefore, to sense the PID effects related with the variation of the pulse area, one needs to work with longer pulses. To this aim, we spectrally shape the initial laser beam, setting durations of fs. To enhance the influence of LA phonons, we set the temperature to K, increasing the phonon occupation of modes in the range of 7 meV by a factor of with respect to 4.2 K, while keeping sufficiently long dephasing of the zero-phonon line [48, 46]. K is also considered in the simulations. We first present the results obtained on a neutral exciton in an InAs QD embedded in a planar cavity, exhibiting a low quality factor , as recently employed in Refs. [6, 38, 1]. The layer of annealed and capped InAs QDs (density cm-2) is placed in the center of a GaAs spacer. The spectrum of the driving laser pulses is tuned to cover the ground state to exciton transition as shown in Fig. S1(a) in the Supplementary Material. Also the exciton to biexciton transition is slightly covered by the tail of the pulse spectrum, generating small signals for negative delays via the two-photon coherence (see Fig. S1(a)). A strong influence from the biexciton state would also lead to a beating for positive delays due to the biexciton binding energy [38]. Because the pulse spectrum has only little overlap with the exciton to biexciton transition, we do not resolve this beating for positive delays. Therefore, we conclude that the influence of the biexciton for the signals at positive delay times is negligible and neglect the biexciton state in our study, restricting it to a two-level system. In Figs. 2(a) and 2(b), we plot the two-pulse FWM amplitude as a function of . The FWM phase is given by , meaning that the first pulse creates a coherence and the second pulse converts this coherence into the FWM signal (see Fig. 1(b)). We show results for four different pulse areas at a fixed second pulse area of . Panel 2(a) presents the measurement and panel 2(b) the respective simulation results for small to large pulse areas from bottom to top. Note, that all curves are normalized to unity. The pulse areas in the calculations are listed in the plot next to the respective graph. For the geometry of the QD we choose slightly different parameters than in Ref. [1]. Here, the electron and hole localization lengths are nm and nm, respectively. These parameters give the best agreement between the measured data in Fig. 2(a) and the simulations in 2(b). Note, that the dimensions of the exciton and are a spherical representations of the exciton, which leads to the same physical results as a lens-shaped model [49]. Therefore, these sizes must not be seen as the real size of the exciton wave function.
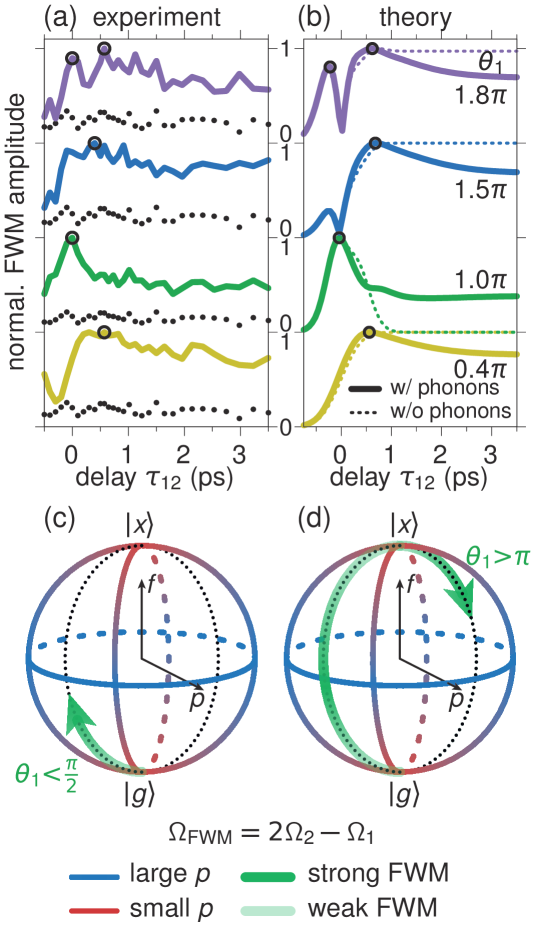
We start the discussion with the smallest measured pulse area at the bottom in Fig. 2(a) (yellow). The FWM amplitude builds up around and reaches a maximum at around 0.5 ps (marked by the circle). After that, the signal slightly decays within the next 3 ps. This behavior is well reproduced by the simulation in Fig. 2(b) including the coupling to LA phonons (solid) for . The drop of the signal within the first few ps results from the PID effect. Together, the phonons and the exciton in the QD form a new equilibrium state, the acoustic polaron. This polaron is accompanied by a static lattice displacement in the vicinity of the QD [50]. When the exciton, and therefore the polaron, is created faster than the typical timescale of the involved phonons, a phonon wave packet is emitted. This results in an irreversible loss of exciton coherence [51, 52, 46]. To emphasize that the signal drop results from the phonon coupling, we also provide simulations neglecting the exciton-phonon interaction, resulting in the dashed yellow curve in Fig. 2(b), visibly lacking the initial decay due to the PID effect.
Going over to the next larger pulse area in Fig. 2(a) (green), we clearly see that the drop of the measured FWM signal is significantly increased and reaches an almost stationary value within less than 1 ps. Additionally, the circle shows that the maximum of the signal shifts to shorter delays. These findings are consistent with the simulation for in panel (b) (solid green). However, the calculated FWM signal without the exciton-phonon coupling (dashed green) goes exactly to zero after ps. To explain this we take a look at the schematic Bloch sphere picture in Fig. 2(c), where the green arrow visualizes the movement of the Bloch vector during the first laser pulse excitation. When the first pulse area is small, i.e., , the microscopic polarization is maximal at the end of the pulse. Therefore, also the two-pulse FWM signal is maximal for small positive delays, i.e., after the first pulse. This is the case for the dashed yellow curve. However, for pulse areas the Bloch vector crosses the equator of the Bloch sphere, i.e., the state of maximum coherence, during the pulse. For the special case of a -pulse, the final polarization is zero, leading also to a vanishing FWM signal. Already here we see that the dynamics of the FWM signal resembles more involved movements of the Bloch vector during the action of the first laser pulse. The full model, including the coupling to LA phonons, is shown as solid green line in Fig. 2(b). We see that the stationary value of the curve strongly deviates from the dashed line. This mismatch is again a consequence of the PID effect. Going from a pulse to a -pulse excitation the dephasing influence of the phonon coupling should significantly increase because the final exciton occupation is approximately twice as large [53, 45]. Comparing the solid lines with the dashed lines of the same color (yellow and green), we see that this is clearly the case. A stronger excitation leads to a larger phonon wave packet and therefore to stronger dephasing.
When increasing the pulse area further, in the second curve from the top in Fig. 2(a) (blue), the signal drop decreases again and the maximum of the signal also goes back to longer ps as marked by the circle. We find the best agreement with the experiment for the simulation with in panel (b) (solid blue). The dynamics of the simulated signals, both with and without the exciton-phonon interaction, look very much like the case (yellow). The only significant difference of the blue curve is an additional minimum at ps. This is again a result of the Bloch vector dynamics. We are now dealing with the case, schematically shown in Fig. 2(d). The Bloch vector crosses the north pole of the sphere during the pulse, which leads to null polarization and in consequence to a vanishing FWM signal. After 1 ps the solid blue line in panel (b) is again governed by the PID drop of the signal. The additional minimum of the FWM signal around ps is obviously too unpronounced to be clearly resolved in the experiment in panel (a). When comparing the simulation with and without phonon coupling we find that the drop of the signal, i.e., the PID effect, gets weaker with respect to the pulse area discussed above. This is in line with the previous explanation of the strength of the PID effect. For this pulse area the final exciton occupation is smaller than for the -pulse, which leads to weaker dephasing.
When we move to the largest considered pulse area at the top (violet) a clear minimum shows up in the measured signal in Fig. 2(a). This is in excellent agreement with the simulation for in panel (b) (solid violet). Here, the signal minimum is significantly more pronounced than in the case considered before. This is an instructive demonstration of the optically driven Rabi oscillations of the exciton state. The PID drop after ps is of a comparable strength as for the case in blue.
From the pulse area series in Figs. 2(a) and 2(b) we find that the effect of the PID and therefore the influence of the exciton-phonon interaction changes measurably with the pulse area of the first driving laser pulse. For large positive delays, i.e. , pulse one arrives first, whilst for large negative delays pulse two arrives first. Therefore, around both pulses overlap. The additional dynamics evolving around happen during the presence of the first pulse. Because the -dependence of the two-pulse FWM signal represents the dynamics of the coherence, i.e., the microscopic polarization of the exciton , the resolved oscillations for the largest considered pulse area stem from optically driven Rabi oscillations in the time domain.
It was shown that the exciton-phonon interaction leads to more involved movements of the Bloch vector during optical driving. The phonon lead to i) dephasing, i.e., shrinking of the Bloch vector length and ii) a mixture of real and imaginary part of the polarization [54], i.e., a movement out of the Rabi oscillation plane of the Bloch vector. For simplicity, the illustrating pictures in Figs. 2(c) and 2(d) do not take these complexities into account. Instead, they capture well the origin of the Rabi oscillations observable in the FWM delay dynamics. Following this proof of principle demonstration, we now generalize this approach using a more suited photonic nanostructure.
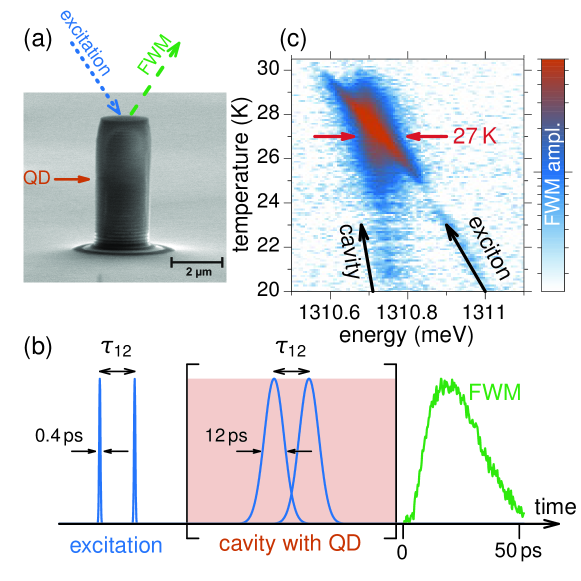
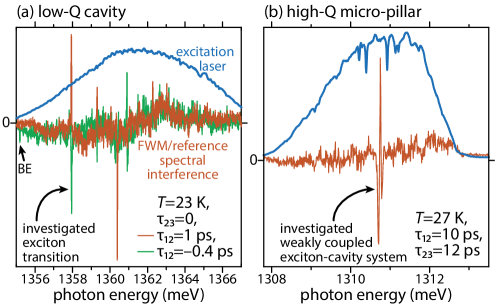
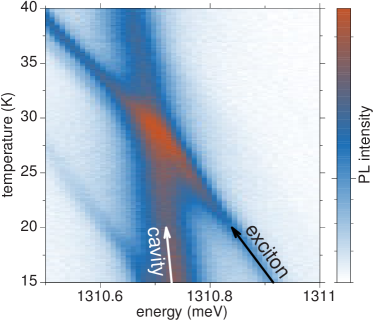
Shifting the focus from the PID phenomenon to the Rabi oscillations, we aim to drive the QD with laser pulses that are as long as possible, to stretch the dynamics in time. In parallel, we want to reach preferably large pulse areas, to generate as many Rabi periods as possible. Our FWM methodology relies on the detection of spectrally-resolved interference between the QD emission and the reference , requiring a bandwidth well beyond the spectrometer resolution, in practice over 0.1 meV. As such, the experiment is limited to pulse durations in the few ps range. To overcome this issue, we switch to a micro-pillar cavity [55, 56] with a diameter of 1.8 µm and a height around 10 µm, as depicted in Fig. 3(a), which yields a two orders of magnitude higher quality factor of . This structure, containing a layer of InAs QDs at the antinode of the cavity mode, allows us to access the photonic structure with sub-ps pulses (namely, ps). See Supplementary Material for spectra of spectral interference and laser pulses. We tightly focus them onto the top facet of the pillar and construct spectral interferences with , placed 12 µm apart at the auxiliary pillar [56]. Crucially, due to the high quality factor the optical field reaches the QD in the cavity in a retarded way. This stretches the pulses to durations of over 10 ps, as schematically shown in Fig. 3(b). Figure 3(c) shows a temperature scan of the FWM spectrum of the QD-cavity system (a corresponding scan of the photoluminescence intensity is shown in the Supplementary Material). The resonances of exciton and cavity are marked in the picture. Around K both resonances cross, which shows that the coupled QD-cavity system operates in the weak coupling regime [55, 57, 58]. The possibility of adjusting the detuning very precisely makes this system prototypical to demonstrate the Purcell effect [2, 3]. We do so by applying a three-pulse FWM measurement for different detunings between the cavity mode and the exciton transition. The results are shown in the Supplementary Material.
The enhancement of the intra-cavity field in the pillar structure allows for reaching larger with respect to the low Q-factor planar cavity explored in Fig. 2. In the following, we choose the temperature to K, setting the exciton transition to be approximately in resonance with the cavity mode as marked by the red arrows in Fig. 3(c). Working at these elevated temperatures results in a significant increase of the LA phonon influence than at 5 K [46]. In all simulations we choose the temperature to 25 K.
The results for the two-pulse FWM study are shown in Fig. 4 with the measurements in panel (a) and the simulations in panel (b). All curves are normalized to their respective maximum. We consider four different pulse areas, increasing from bottom to top. The second pulse area is fixed in the simulations to . The pulse duration and the long time dephasing rate are fitted to the smallest pulse area and we found the best agreement for ps and /ps. For the simulations we choose the same QD geometry as for the calculations shown in Fig. 2.
For the smallest considered pulse area the measured FWM signal in Fig. 4(a) just forms one maximum around ps and decays for longer delays single exponentially with . These dynamics are well reproduced by the simulation in Fig. 4(b). Additionally, there is nearly no difference between the calculation with and without exciton-phonon interaction (solid and dashed). This indicates that the optically driven dynamics are to slow to induce the PID drop of the signal. In other words, the polaron creation follows the exciton occupation adiabatically and no phonon wave packet is emitted [45]. We can instructively describe the optical excitation process using the laser-exciton dressed state picture [61]. These states then have an energy splitting , the so called Autler-Townes (AT) splitting [62], which is proportional to the instantaneous laser field amplitude. While in the exciton basis the LA phonons only couple to the exciton state, in the presence of a light field they lead to transitions between the dressed states. For small pulse areas, i.e. , is correspondingly small, in the µeV range, hence in the energy range where the phonon spectral density is negligible [1]. Therefore, the phonons do not lead to efficient transitions between the dressed states, which allows them to evolve adiabatically.
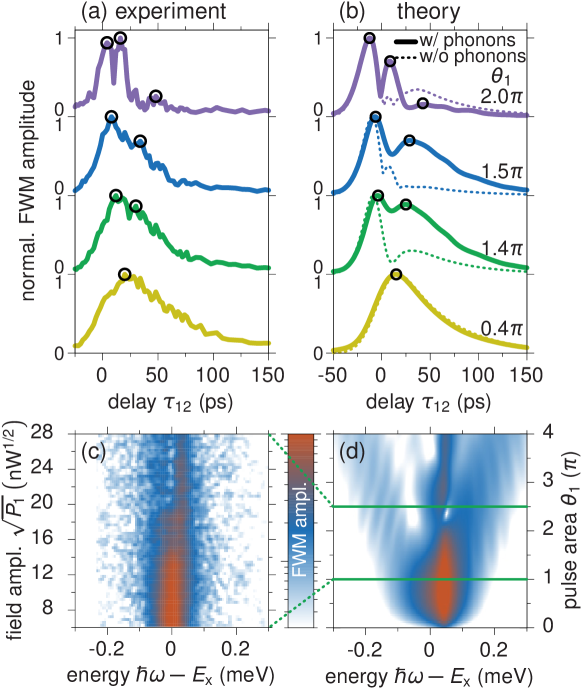
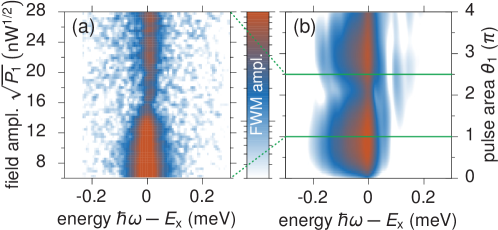
The appearance of a splitting between the dressed states with increasing field strength can be seen in Figs. 4(c) and 4(d). There, we show the FWM spectrum centered around the exciton transition energy . In the measurement in panel (c) it is plotted against , which is proportional to the field amplitude. The corresponding simulation is presented in panel (d) and shows a good agreement with the measurement. The spectra are taken for . While for small pulse areas the spectrum is dominated by a single line at the exciton energy, it splits according to the AT splitting of the dressed states reaching values of approximately 0.1 meV in panel (c). Note, that the AT splitting is time dependent for pulsed excitations. Therefore, we are seeing a time integrated version of the splitting between the dressed states in the FWM spectra. However, is the direct spectral domain translation of the Rabi oscillations in the FWM signal. In agreement between the dynamics depicted in Figs. 4(a) and 4(b) and the spectral behavior in Figs. 4(c) and 4(d), we find clear signatures of the Rabi oscillations from pulse areas of onward. We additionally find, that the line at positive detuning is stronger than the other one. This stems from a slight mismatch between the energies of the driving laser pulses and the exciton transition of meV, which was considered in the simulation in Fig. 4(d). This detuning agrees well with the separation between the exciton and cavity line in Fig. 3(b) at 27 K. Only for the case of exact resonance between the driving field and the transition energy the dressed states are equally occupied [61]. As we find here, already detunings in the few µeV range result in a significant mismatch of the two lines in the FWM signal. To check that the AT splitting is driven by the laser pulses we performed the same measurement and simulation as in Figs. 4(c) and 4(d) but with a large delay of ps to reduce the overlap of the pulses. Here, no AT splitting was found (see Supplementary Material).
Comparing the second pulse area in Fig. 4(a) (green) to the yellow curve, the maximum of the signal splits into two local maxima, with one moving to smaller and one moving to larger delays . The maxima are marked by the circles. In the simulation in Fig. 4(b) we find the best agreement for (solid green line) where we already find clear signatures of the Rabi oscillations during the interaction with the first laser pulse. Here two distinct maxima of almost equal height are formed. Compared to the simulation without the exciton-phonon interaction (dashed green line) we find a significant deviation for the second maximum already for this pulse area. Without the coupling to phonons, the FWM signal drops very rapidly and the second maximum is much smaller than the first one. There are two main effects enhancing the discrepancy between the two calculations: i) For these pulse areas we have shown that attains the 0.1 meV range. This allows for more efficient phonon assisted transitions between the dressed states and therefore to strong dephasing during the first laser pulse. ii) The exciton-phonon interaction leads to a renormalization of the pulse areas [26, 63, 64, 65]. This makes a direct comparison of the pulse areas with and without phonon coupling difficult.
Stepping to the next larger pulse area in Fig. 4(a), i.e., from the green to the blue curve, does not alter the dynamics of the FWM signal significantly. We basically find a slightly larger difference in the height of the two maxima in the signal. This is reproduced by the modeled signal in panel (b). Here the minimum between the two maxima is more pronounced as in the experiment, which we already found in a similar way for the shorter pulses in Fig. 2. The deviation between the simulation with and without phonon coupling remains remarkable because of the reasons pointed out earlier.
The most significant difference for the signal dynamics is found for the largest considered pulse area in the experiment, which is shown as violet curve in Fig. 4(a). It forms a double peak structure within the first 25 ps followed by a minor maximum around ps. After that the signal is basically null. The very same behavior is found in the simulation with in Fig. 4(b): Two strong and narrow peaks around ps are followed by a small maximum at ps. Together with the stunning agreement with the simulated curve in panel (b) (solid violet), this impressively shows that multiple Rabi oscillations are resolved in the coherence dynamics of the two-pulse FWM experiment. Without considering the coupling to phonons the model gives the dashed line in Fig. 4(b). Here also three maxima build up, but the relative heights of the second and third maximum do not agree with the measured curve in panel (a) at all. This shows that coupling to phonons has a strong impact on the optically driven dynamics of the exciton quantum state.
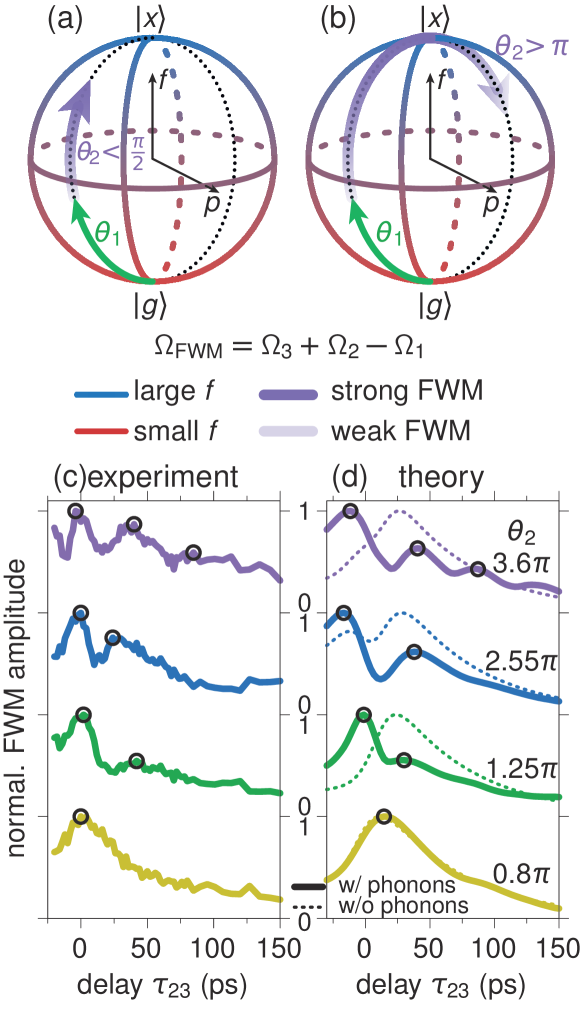
The FWM technique allows to use different pulse sequences that lead to different microscopic quantities determining the FWM signal. So far we have studied the exciton polarization by employing a two-pulse FWM experiment with . We now turn to a three-pulse excitation with where - in a two level system - the FWM signal carries information about the occupation of the exciton state . A schematic picture of the Bloch sphere for this experiment is shown in Figs. 5(a) and 5(b) (see also Fig. 1(c)). The first pulse drives a microscopic coherence. The second pulse converts this coherence into an occupation of the exciton, which is then turned into the FWM signal by the third pulse. A larger occupation of the exciton state will accordingly lead to a stronger FWM amplitude. The idea is to fix the first and third pulse area to small values and change the second area . This will then result in different occupations and therefore different signal strengths. For large pulse areas the three-pulse FWM signal will resolve the optically driven Rabi oscillations projected on the exciton occupation .
Figures 5(c) and 5(d) present the normalized experimental and theoretical results, respectively, for different pulse areas increasing from bottom to top. The FWM amplitude is plotted as a function of the delay to investigate the exciton population dynamics. The first delay is fixed to ps to enable the build up of the intra-cavity field. We see for the smallest pulse area at the bottom (yellow) that the dynamics of the three-pulse FWM amplitude forms a single broad maximum. For long delays the signal is dominated by the spontaneous decay. The decay rate was chosen to /ps to give the best fit to the measurement. We found the best agreement between measurement and simulation for . The other pulse areas are chosen to and in all simulations.
Comparing experiment and theory we find an excellent agreement for each considered . With increasing pulse strength, the first maximum shifts to shorter delays , whilst at longer additional maxima emerge, as marked by the circles. These dynamics now happen during the interaction with the second laser pulse. Therefore the signal is dominated by the Rabi oscillations of the exciton occupation . For the two largest pulse areas (blue and violet) up to three distinct maxima can be found in the signal. When comparing the simulations including the exciton-phonon coupling (solid) with those omitting it (dashed), we find clear qualitative differences. In the case (green) the maxima have a significant mismatch in their delay of approximately 25 ps. Another striking example is the largest pulse area at the top, where the full model including the phonon coupling develops multiple modulations, while the uncoupled calculation yields a single broad peak. One obvious reason for this stronger discrepancy between the model with and without phonons in Fig. 5(b) compared to the results in Fig. 4(b) is the fact that the former one includes three pulses, while the latter one only two. Therefore, the impact of dephasing and pulse area renormalization come into play for one more pulse, further enhancing their influence. Additionally, we reach higher pulse areas, which results in general in a more efficient exciton-phonon interaction.
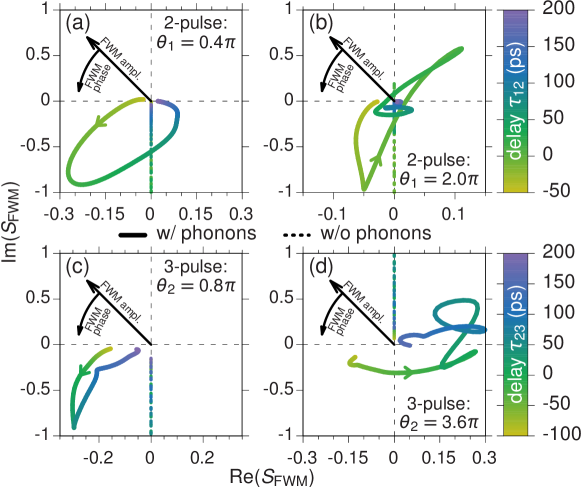
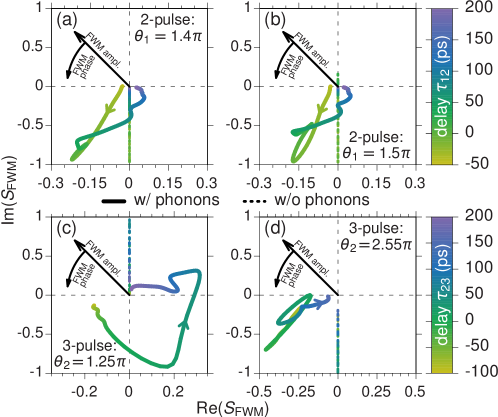
The FWM signal is a complex quantity with real and imaginary part or amplitude and phase. This feature has e.g. been used to distinguish between different coupling situations in few level systems [35]. We here use it to further illustrate the dynamics of the Rabi oscillations and especially the influence of the exciton-phonon coupling. In Fig. 6 we plot real and imaginary parts of the simulated FWM signals and color-code the delay to visualize the dynamics of the signals. The arrow heads indicate the direction of the time evolution. In principle, panels (a, b) and (c, d) are more sophisticated representations of the data shown in Figs. 4(b) and 5(d), respectively. In panels (a) and (b) we show the smallest and largest pulse area for the two-pulse FWM case and in panels (c) and (d) the smallest and largest pulse areas for the three-pulse FWM case. The remaining four considered pulse areas are given in the Supplementary Material. The simulations without exciton-phonon coupling are shown as dotted lines. These curves are restricted to the vertical axis, i.e., the FWM signal is purely imaginary. When the full model is considered (solid lines) real and imaginary parts of the FWM signals get mixed and the curves in Fig. 6 show very involved dynamics. While for the small pulse area examples in panels (a) and (c) the signals are governed by a single loop, in the high area cases in panels (b) and (d) the signals perform multiple loops. These loops represent the Rabi oscillations, which we also found in the dynamics of the FWM amplitudes in Figs. 4 and 5. This way of analyzing the FWM signals exploits the full potential of the method in an appealing fashion.
4 CONCLUSIONS
In summary, we have investigated the optically driven dynamics of the full quantum state of a single QD exciton in the presence of efficient coupling to acoustic phonons. By driving the system with sub- and super-ps laser pulses and applying two- and three-pulse FWM techniques, we could isolate the dynamics of the microscopic polarization and the exciton occupation, respectively. By this we showed that for large pulse areas involved dynamics of the Bloch vector in the form of Rabi oscillations take place. Especially, the coupling to LA phonons plays a decisive role for the optical control of the QD exciton: On the one hand, for short laser pulses ( ps) phonons lead to the loss of coherence after the first laser pulse, due to the emission of phonon wave packets. On the other hand, for ps the dephasing happens already during the first pulse and it therefore strongly depends on the applied pulse area. Only the accurate theoretical description of the exciton-phonon interaction allowed for a quantitative analysis and comprehension of the measured data. In the spectral domain, the observed Rabi oscillations represent the Autler-Townes splitting, which we clearly observed in the FWM spectra.
We thus find that FWM is a versatile technique to study optically driven dynamics in many different aspects not only in single QDs but also in any other potential isolated quantum systems like spins of QD trions [1, 2, 3] or single defect centers in insulators [4, 5]. However, the timescales of spins are by a factor of 10 – 100 slower than our optically active exciton transition, which renders the investigation in the optical range far more challenging.
We have demonstrated that FWM spectroscopy of single emitters can be used to study the optically driven dynamics of the quantum state and at the same time works in a regime where the coupling to phonons is rather strong. This makes this technique also promising to investigate optical transitions in localized excitons in atomically thin structures like transition metal dichalcogenides and hexagonal boron nitride or color centers in insulators. These systems stand out due to their functionality at elevated temperatures making them an up-and-coming platform for quantum applications.
5 ACKNOWLEDGEMENTS
We acknowledge the financial support by the European Research Council (ERC) Starting Grant PICSEN (grant no. 306387). We further thank Sebastian Lüker for support with the implementation of the phonon coupled model.
References
- [1] X. Mi, M. Benito, S. Putz, D. M. Zajac, J. M. Taylor, G. Burkard, and J. R. Petta, “A coherent spin-photon interface in silicon,” \JournalTitleNature 555, 599 (2018).
- [2] D. Press, T. Ladd, B. Zhang, and Y. Yamamoto, “Complete quantum control of a single quantum dot spin using ultrafast optical pulses,” \JournalTitleNature 456, 218 (2008).
- [3] K. De Greve, P. L. McMahon, D. Press, T. D. Ladd, D. Bisping, C. Schneider, M. Kamp, L. Worschech, S. Höfling, A. Forchel, and Y. Yamamoto, “Ultrafast coherent control and suppressed nuclear feedback of a single quantum dot hole qubit,” \JournalTitleNature Phys. 7, 872 (2011).
- [4] W. B. Gao, A. Imamoglu, H. Bernien, and R. Hanson, “Coherent manipulation, measurement and entanglement of individual solid-state spins using optical fields,” \JournalTitleNature Photon. 9, 363 (2015).
- [5] Y. Zhou, A. Rasmita, K. Li, Q. Xiong, I. Aharonovich, and W. Gao, “Coherent control of a strongly driven silicon vacancy optical transition in diamond,” \JournalTitleNature Comm. 8, 14451 (2017).
- [6] F. Fras, Q. Mermillod, G. Nogues, C. Hoarau, C. Schneider, M. Kamp, S. Höfling, W. Langbein, and J. Kasprzak, “Multi-wave coherent control of a solid state single emitter,” \JournalTitleNature Photon. 10, 155 (2016).
- [7] N. H. Bonadeo, J. Erland, D. Gammon, D. Park, D. S. Katzer, and D. G. Steel, “Coherent optical control of the quantum state of a single quantum dot,” \JournalTitleScience 282, 1473–1476 (1998).
- [8] S. Stufler, P. Ester, A. Zrenner, and M. Bichler, “Ramsey fringes in an electric-field-tunable quantum dot system,” \JournalTitlePhys. Rev. Lett. 96, 037402 (2006).
- [9] T. H. Stievater, X. Li, D. G. Steel, D. Gammon, D. S. Katzer, D. Park, C. Piermarocchi, and L. J. Sham, “Rabi oscillations of excitons in single quantum dots,” \JournalTitlePhys. Rev. Lett. 87, 133603 (2001).
- [10] A. J. Ramsay, A. V. Gopal, E. M. Gauger, A. Nazir, B. W. Lovett, A. M. Fox, and M. S. Skolnick, “Damping of exciton Rabi rotations by acoustic phonons in optically excited InGaAs/GaAs quantum dots,” \JournalTitlePhys. Rev. Lett. 104, 017402 (2010).
- [11] Y. Wu, I. M. Piper, M. Ediger, P. Brereton, E. R. Schmidgall, P. R. Eastham, M. Hugues, M. Hopkinson, and R. T. Phillips, “Population inversion in a single InGaAs quantum dot using the method of adiabatic rapid passage,” \JournalTitlePhys. Rev. Lett. 106, 067401 (2011).
- [12] C.-M. Simon, T. Belhadj, B. Chatel, T. Amand, P. Renucci, A. Lemaître, O. Krebs, P. A. Dalgarno, R. J. Warburton, X. Marie, and B. Urbaszek, “Robust quantum dot exciton generation via adiabatic passage with frequency-swept optical pulses,” \JournalTitlePhys. Rev. Lett. 106, 166801 (2011).
- [13] P.-L. Ardelt, L. Hanschke, K. A. Fischer, K. Müller, A. Kleinkauf, M. Koller, A. Bechtold, T. Simmet, J. Wierzbowski, H. Riedl, G. Abstreiter, and J. J. Finley, “Dissipative preparation of the exciton and biexciton in self-assembled quantum dots on picosecond time scales,” \JournalTitlePhys. Rev. B 90, 241404 (2014).
- [14] J. H. Quilter, A. J. Brash, F. Liu, M. Glässl, A. M. Barth, V. M. Axt, A. J. Ramsay, M. S. Skolnick, and A. M. Fox, “Phonon-assisted population inversion of a single InGaAs/GaAs quantum dot by pulsed laser excitation,” \JournalTitlePhys. Rev. Lett. 114, 137401 (2015).
- [15] S. Bounouar, M. Müller, A. M. Barth, M. Glässl, V. M. Axt, and P. Michler, “Phonon-assisted robust and deterministic two-photon biexciton preparation in a quantum dot,” \JournalTitlePhys. Rev. B 91, 161302 (2015).
- [16] T. Kaldewey, S. Lüker, A. V. Kuhlmann, S. R. Valentin, A. Ludwig, A. D. Wieck, D. E. Reiter, T. Kuhn, and R. J. Warburton, “Coherent and robust high-fidelity generation of a biexciton in a quantum dot by rapid adiabatic passage,” \JournalTitlePhys. Rev. B 95, 161302 (2017).
- [17] T. Kaldewey, S. Lüker, A. V. Kuhlmann, S. R. Valentin, J.-M. Chauveau, A. Ludwig, A. D. Wieck, D. E. Reiter, T. Kuhn, and R. J. Warburton, “Demonstrating the decoupling regime of the electron-phonon interaction in a quantum dot using chirped optical excitation,” \JournalTitlePhys. Rev. B 95, 241306 (2017).
- [18] S. J. Boyle, A. J. Ramsay, A. M. Fox, M. S. Skolnick, A. P. Heberle, and M. Hopkinson, “Beating of exciton-dressed states in a single semiconductor InGaAs/GaAs quantum dot,” \JournalTitlePhys. Rev. Lett. 102, 207401 (2009).
- [19] J. R. Schaibley, A. P. Burgers, G. A. McCracken, D. G. Steel, A. S. Bracker, D. Gammon, and L. J. Sham, “Direct detection of time-resolved Rabi oscillations in a single quantum dot via resonance fluorescence,” \JournalTitlePhys. Rev. B 87, 115311 (2013).
- [20] P. Borri, W. Langbein, J. M. Hvam, F. Heinrichsdorff, M.-H. Mao, and D. Bimberg, “Time-resolved four-wave mixing in InAs/InGaAs quantum-dot amplifiers under electrical injection,” \JournalTitleAppl. Phys. Lett. 76, 1380–1382 (2000).
- [21] M. Kolarczik, N. Owschimikow, J. Korn, B. Lingnau, Y. Kaptan, D. Bimberg, E. Schöll, K. Lüdge, and U. Woggon, “Quantum coherence induces pulse shape modification in a semiconductor optical amplifier at room temperature,” \JournalTitleNat. Commun. 4, 2953 (2013).
- [22] O. Karni, A. Capua, G. Eisenstein, V. Sichkovskyi, V. Ivanov, and J. P. Reithmaier, “Rabi oscillations and self-induced transparency in InAs/InP quantum dot semiconductor optical amplifier operating at room temperature,” \JournalTitleOpt. Express 21, 26786–26796 (2013).
- [23] S. T. Cundiff, A. Knorr, J. Feldmann, S. W. Koch, E. O. Göbel, and H. Nickel, “Rabi flopping in semiconductors,” \JournalTitlePhys. Rev. Lett. 73, 1178 (1994).
- [24] H. Choi, V.-M. Gkortsas, L. Diehl, D. Bour, S. Corzine, J. Zhu, G. Höfler, F. Capasso, F. X. Kärtner, and T. B. Norris, “Ultrafast Rabi flopping and coherent pulse propagation in a quantum cascade laser,” \JournalTitleNat. Photonics 4, 706 (2010).
- [25] A. Capua, O. Karni, G. Eisenstein, and J. P. Reithmaier, “Rabi oscillations in a room-temperature quantum dash semiconductor optical amplifier,” \JournalTitlePhys. Rev. B 90, 045305 (2014).
- [26] J. Förstner, C. Weber, J. Danckwerts, and A. Knorr, “Phonon-assisted damping of Rabi oscillations in semiconductor quantum dots,” \JournalTitlePhys. Rev. Lett. 91, 127401 (2003).
- [27] B. Patton, U. Woggon, and W. Langbein, “Coherent control and polarization readout of individual excitonic states,” \JournalTitlePhys. Rev. Lett. 95, 266401 (2005).
- [28] D. P. S. McCutcheon and A. Nazir, “Quantum dot Rabi rotations beyond the weak exciton–phonon coupling regime,” \JournalTitleNew J. Phys. 12, 113042 (2010).
- [29] D. Wigger, Q. Mermillod, T. Jakubczyk, F. Fras, S. Le-Denmat, D. E. Reiter, S. Höfling, M. Kamp, G. Nogues, C. Schneider, T. Kuhn, and J. Kapsrzak, “Exploring coherence of individual excitons in InAs quantum dots embedded in natural photonic defects: influence of the excitation intensity,” \JournalTitlePhys. Rev. B 96, 165311 (2017).
- [30] S. V. Poltavtsev, M. Reichelt, I. A. Akimov, G. Karczewski, M. Wiater, T. Wojtowicz, D. R. Yakovlev, T. Meier, and M. Bayer, “Damping of Rabi oscillations in intensity-dependent photon echoes from exciton complexes in a CdTe/(Cd, Mg) Te single quantum well,” \JournalTitlePhys. Rev. B 96, 075306 (2017).
- [31] T. Suzuki, R. Singh, M. Bayer, A. Ludwig, A. D. Wieck, and S. T. Cundiff, “Detuning dependence of Rabi oscillations in an InAs self-assembled quantum dot ensemble,” \JournalTitlePhys. Rev. B 97, 161301 (2018).
- [32] P. L. Knight and P. W. Milonni, “The Rabi frequency in optical spectra,” \JournalTitlePhys. Report 66, 21–107 (1980).
- [33] C. N. Borca, T. Zhang, X. Li, and S. T. Cundiff, “Optical two-dimensional Fourier transform spectroscopy of semiconductors,” \JournalTitleChem. Phys. Lett. 416, 311–315 (2005).
- [34] S. T. Cundiff, “Coherent spectroscopy of semiconductors,” \JournalTitleOpt. Express 16, 4639–4664 (2008).
- [35] J. Kasprzak, B. Patton, V. Savona, and W. Langbein, “Coherent coupling between distant excitons revealed by two-dimensional nonlinear hyperspectral imaging,” \JournalTitleNature Photon. 5, 57 (2011).
- [36] G. Moody, R. Singh, H. Li, I. A. Akimov, M. Bayer, D. Reuter, A. D. Wieck, A. S. Bracker, D. Gammon, and S. T. Cundiff, “Influence of confinement on biexciton binding in semiconductor quantum dot ensembles measured with two-dimensional spectroscopy,” \JournalTitlePhys. Rev. B 87, 041304 (2013).
- [37] S. T. Cundiff and S. Mukamel, “Optical multidimensional coherent spectroscopy,” \JournalTitlePhys. Today 66, 44 (2013).
- [38] Q. Mermillod, D. Wigger, V. Delmonte, D. E. Reiter, C. Schneider, M. Kamp, S. Höfling, W. Langbein, T. Kuhn, G. Nogues, and J. Kasprzak, “Dynamics of excitons in individual InAs quantum dots revealed in four-wave mixing spectroscopy,” \JournalTitleOptica 3, 377–384 (2016).
- [39] B. Lomsadze and S. T. Cundiff, “Frequency combs enable rapid and high-resolution multidimensional coherent spectroscopy,” \JournalTitleScience 357, 1389–1391 (2017).
- [40] J. Kasprzak, S. Portolan, A. Rastelli, L. Wang, J. D. Plumhof, O. G. Schmidt, and W. Langbein, “Vectorial nonlinear coherent response of a strongly confined exciton–biexciton system,” \JournalTitleNew J. Phys. 15, 055006 (2013).
- [41] B. Krummheuer, V. M. Axt, and T. Kuhn, “Theory of pure dephasing and the resulting absorption line shape in semiconductor quantum dots,” \JournalTitlePhys. Rev. B 65, 195313 (2002).
- [42] F. Rossi and T. Kuhn, “Theory of ultrafast phenomena in photoexcited semiconductors,” \JournalTitleRev. Mod. Phys. 74, 895 (2002).
- [43] A. Krügel, V. M. Axt, and T. Kuhn, “Back action of nonequilibrium phonons on the optically induced dynamics in semiconductor quantum dots,” \JournalTitlePhys. Rev. B 73, 035302 (2006).
- [44] U. Weiss, Quantum dissipative systems, vol. 13 (World scientific, 2012).
- [45] D. Wigger, S. Lüker, D. E. Reiter, V. M. Axt, P. Machnikowski, and T. Kuhn, “Energy transport and coherence properties of acoustic phonons generated by optical excitation of a quantum dot,” \JournalTitleJ. Phys. Condens. Matter 26, 355802 (2014).
- [46] T. Jakubczyk, V. Delmonte, S. Fischbach, D. Wigger, D. E. Reiter, Q. Mermillod, P. Schnauber, A. Kaganskiy, J.-H. Schulze, A. Strittmatter, S. Rodt, W. Langbein, T. Kuhn, S. Reitzenstein, and J. Kasprzak, “Impact of phonons on dephasing of individual excitons in deterministic quantum dot microlenses,” \JournalTitleACS Photonics 3, 2461–2466 (2016).
- [47] A. Vagov, V. M. Axt, and T. Kuhn, “Electron-phonon dynamics in optically excited quantum dots: Exact solution for multiple ultrashort laser pulses,” \JournalTitlePhys. Rev. B 66, 165312 (2002).
- [48] P. Borri, W. Langbein, U. Woggon, V. Stavarache, D. Reuter, and A. D. Wieck, “Exciton dephasing via phonon interactions in InAs quantum dots: Dependence on quantum confinement,” \JournalTitlePhys. Rev. B 71, 115328 (2005).
- [49] S. Lüker, T. Kuhn, and D. E. Reiter, “Phonon impact on optical control schemes of quantum dots: Role of quantum dot geometry and symmetry,” \JournalTitlePhys. Rev. B 96, 245306 (2017).
- [50] U. Hohenester, “Quantum control of polaron states in semiconductor quantum dots,” \JournalTitleJ. Phys. B 40, 11 (2007).
- [51] A. Vagov, V. M. Axt, and T. Kuhn, “Impact of pure dephasing on the nonlinear optical response of single quantum dots and dot ensembles,” \JournalTitlePhys. Rev. B 67, 115338 (2003).
- [52] A. Vagov, V. M. Axt, T. Kuhn, W. Langbein, P. Borri, and U. Woggon, “Nonmonotonous temperature dependence of the initial decoherence in quantum dots,” \JournalTitlePhys. Rev. B 70, 201305 (2004).
- [53] D. Wigger, D. E. Reiter, V. M. Axt, and T. Kuhn, “Fluctuation properties of acoustic phonons generated by ultrafast optical excitation of a quantum dot,” \JournalTitlePhys. Rev. B 87, 085301 (2013).
- [54] A. M. Barth, S. Lüker, A. Vagov, D. E. Reiter, T. Kuhn, and V. M. Axt, “Fast and selective phonon-assisted state preparation of a quantum dot by adiabatic undressing,” \JournalTitlePhys. Rev. B 94, 045306 (2016).
- [55] J. P. Reithmaier, G. Sek, A. Löffler, C. Hofmann, S. Kuhn, S. Reitzenstein, L. V. Keldysh, V. D. Kulakovskii, T. L. Reinecke, and A. Forchel, “Strong coupling in a single quantum dot–semiconductor microcavity system,” \JournalTitleNature 432, 197 (2004).
- [56] J. Kasprzak, S. Reitzenstein, E. A. Muljarov, C. Kistner, C. Schneider, M. Strauss, S. Höfling, A. Forchel, and W. Langbein, “Up on the Jaynes-Cummings ladder of a quantum-dot/microcavity system,” \JournalTitleNature Mat. 9, 304–308 (2010).
- [57] T. Yoshie, A. Scherer, J. Hendrickson, G. Khitrova, H. M. Gibbs, G. Rupper, C. Ell, O. B. Shchekin, and D. G. Deppe, “Vacuum Rabi splitting with a single quantum dot in a photonic crystal nanocavity,” \JournalTitleNature 432, 200 (2004).
- [58] E. Peter, P. Senellart, D. Martrou, A. Lemaître, J. Hours, J. M. Gérard, and J. Bloch, “Exciton-photon strong-coupling regime for a single quantum dot embedded in a microcavity,” \JournalTitlePhys. Rev. Lett. 95, 067401 (2005).
- [59] E. M. Purcell, “Spontaneous emission probabilities at radio frequencies,” \JournalTitlePhys. Rev. 69, 681 (1946).
- [60] J. M. Gerard and B. Gayral, “InAs quantum dots: artificial atoms for solid-state cavity-quantum electrodynamics,” \JournalTitlePhysica E Low Dimens Syst Nanostruct 9, 131–139 (2001).
- [61] D. J. Tannor, Introduction to quantum mechanics: a time-dependent perspective (University Science Books, 2007).
- [62] S. H. Autler and C. H. Townes, “Stark effect in rapidly varying fields,” \JournalTitlePhys. Rev. 100, 703 (1955).
- [63] A. Vagov, M. D. Croitoru, V. M. Axt, T. Kuhn, and F. M. Peeters, “Nonmonotonic field dependence of damping and reappearance of Rabi oscillations in quantum dots,” \JournalTitlePhys. Rev. Lett. 98, 227403 (2007).
- [64] A. J. Ramsay, T. M. Godden, S. J. Boyle, E. M. Gauger, A. Nazir, B. W. Lovett, A. M. Fox, and M. S. Skolnick, “Phonon-induced Rabi-frequency renormalization of optically driven single InGaAs/GaAs quantum dots,” \JournalTitlePhys. Rev. Lett. 105, 177402 (2010).
- [65] M. Glässl, M. D. Croitoru, A. Vagov, V. M. Axt, and T. Kuhn, “Influence of the pulse shape and the dot size on the decay and reappearance of Rabi rotations in laser driven quantum dots,” \JournalTitlePhys. Rev. B 84, 125304 (2011).
Supplemental Material
1. Pulse spectra
Figure S1 shows four wave mixing (FWM) spectral interferograms (orange and green) of the low-Q cavity system studied in the first part of the paper in (a) and the weakly coupled high-Q micro-pillar cavity system in (b), which is studied in the second part. Spectra of the respective reference pulses are shown in blue. The spectral width of the laser in (a) is matched to the cavity mode. Extra dips in the laser spectrum in (b) are caused by the strong water absorption within that spectral range. Spectral and temporal shapes of the excitation attaining the quantum dot layer in (b) is defined, not by the external excitation laser, but by the spectrally narrow cavity mode (around 50 µeV), governing the intracavity field and strongly spectrally filtering the impinging laser.
2. Photoluminescence spectra
Figure S2 shows photoluminescence (PL) spectra of the quantum dot micro-pillar cavity system considered in the main text for varying temperature. With this we confirm that the exciton and the cavity mode do not form an anticrossing around their resonance. This proves that we are operating the system in the weak coupling regime. A corresponding temperature scan of the FWM signal is given in Fig. 2(b) in the main text.
3. Autler-Townes splitting
In the main text in Figs. 3(c) and 3(d) we show two-pulse FWM spectra for different pulse areas at the pulse delay . There we show that for large pulse areas the exciton transition splits into the two dressed states separated by the Autler-Townes (AT) splitting. In Figs. S3(a) and S3(b) corresponding spectra are shown for a delay of ps. In this case the overlap of the two driving laser pulses is small and the spectra do not show the AT splitting any longer. The simulation in panel (b) is in good agreement with the measurement in panel (a). This proves that the dressed states can only be resolved during the interaction with the first laser pulse. Following the signal intensity from small pulse areas to large ones we see that it forms two maxima. These are Rabi coherence rotations as we have discussed them in Ref. [1].
4. Purcell effect
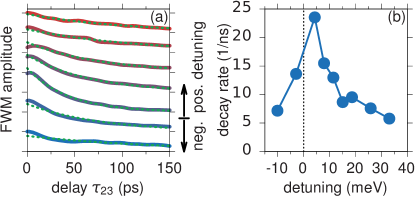
By measuring the three-pulse FWM signal in the micropillar-cavity system introduced in the main text, we can probe the radiative lifetime of the exciton state. In the main text we have shown that for small applied pulse areas the dynamics as a function of the delay is governed by the radiative decay of the excited state population. The signal can be fitted by a single exponential. In Fig. S4(a) we show the measured FWM signal dynamics as colored solid lines. The corresponding exponential fits are given as green dashed lines. The temperature of the system increases from bottom to top trespassing the crossing in Fig. S2. Together with the detuning curves in Fig. S2 we can transfer the temperature of the system into a detuning between the cavity mode and the exciton transition. The fitted decay rates from Fig. S4(a) are plotted against the detuning in panel (b). We find the strongest radiative decay rate in the vicinity of the resonance, i.e., for vanishing detuning. For increasing negative and positive detunings the decay rate decreases rapidly. The reason for this result is the Purcell effect[2, 3] which gives rise to a decreasing radiative lifetime when the emitter is coupled stronger to the optical mode due to an increased density of photon states.
5. Pulse area calibration
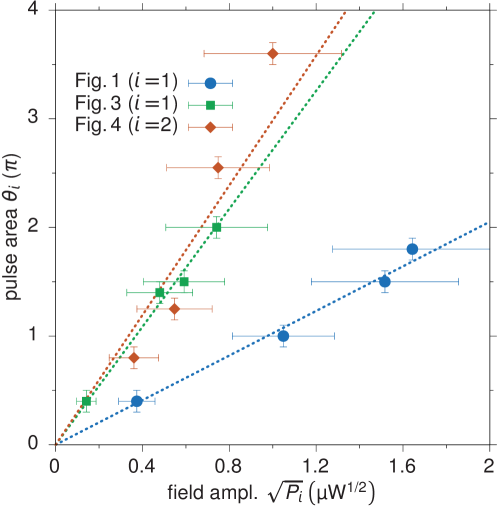
In the main text we compare the dynamics of measured FWM signals for specific laser pulse powers with simulations, where certain pulse areas are considered to produce the best agreement with the experiment. In Fig. S5 we plot the fitted pulse areas as a function of the square-root of the applied laser power , which is proportional to the field amplitude and therefore also to the pulse area in the experiment. Note, that for the results in Fig. 1 in the main text we used another QD sample than for the results in Figs. 4 and 5. For the uncertainties of the applied pulse power we assume 10% of for the data from the micro-pillar cavity (Figs. 4 and 5) and 5% of for the planar cavity (Fig. 1). The dotted lines in the plot are linear fits to the data points and serve as a guide to the eye. We find that the dependence between the field amplitudes in the experiment and the pulse areas in the theory follows the expected linear trend. The slope of the Fig. 4 and Fig. 5 data is similar, while one for Fig. 2 is flatter. This is in line with the smaller Q-factor of the planar cavity used for Fig. 2.
6. Complex FWM signal
Figure S6 shows the real and imaginary part of the FWM signals with the color coded delays and . In Fig. 6 in the main text we show the smallest and the largest considered pulse areas in the micropillar-cavity system. Fig. S6 completes the considered pulse areas as it shows the remaining intermediate pulse areas from Figs. 4(b) and 5(d) from the main text. We see that by increasing the pulse areas an increasing number of loops appears in the plots. These loops represent the Rabi oscillations of the Bloch vector during the interaction with the laser pulses.
References
- [1] D. Wigger, Q. Mermillod, T. Jakubczyk, F. Fras, S. Le-Denmat, D. E. Reiter, S. Höfling, M. Kamp, G. Nogues, C. Schneider, T. Kuhn, and J. Kapsrzak, “Exploring coherence of individual excitons in InAs quantum dots embedded in natural photonic defects: influence of the excitation intensity,” \JournalTitlePhys. Rev. B 96, 165311 (2017).
- [2] E. M. Purcell, “Spontaneous emission probabilities at radio frequencies,” \JournalTitlePhys. Rev. 69, 681 (1946).
- [3] J. M. Gerard and B. Gayral, “InAs quantum dots: artificial atoms for solid-state cavity-quantum electrodynamics,” \JournalTitlePhysica E Low Dimens Syst Nanostruct 9, 131–139 (2001).