Energy transfer from baryons to dark matter as a unified solution to small-scale structure issues of the CDM model
Abstract
Using a semianalytic code, we show how baryon physics in a CDM cosmology could solve the discrepancy between numerical predictions of dark matter haloes and observations, ranging from dwarf galaxies to clusters, without the need of nonstandard dark matter models as advocated, for example, by [Kaplinghat et al., Phys. Rev. Lett. 116, 041302, (2016)]. Combining well established results, we show, for the first time, how accounting for baryon physics, in particular dynamical friction mechanisms, leads to flat galaxy-cluster profiles and correlations in several of their properties, solves the so-called “diversity problem” and reproduces very well the challenging, extremely low-rising rotation curve of IC2574. We therefore suggest treating baryonic physics properly before introducing new exotic features, albeit legitimate, in the standard cosmological model.
I Introduction
The CDM model, while very successful (Spergel et al., 2003; Komatsu et al., 2011), presents some issues (e.g., Weinberg (1989); Astashenok and del Popolo (2012)). Particularly troublesome is the discrepancy between the flat density profiles of dark-matter (DM)-dominated dwarf galaxies, irregulars and low surface brightness galaxies (hereafter LSBs), high surface brightness spiral galaxies, in some cluster of galaxies, and the cuspy profile predicted by dissipationless N-body simulations (e.g., Navarro et al. (1996)), dubbed cusp/core problem (Moore, 1994; Flores and Primack, 1994; Cardone and Del Popolo, 2012). Better understood in terms of the excess of DM in the inner parts of the galaxies rather than of the inner slope, it connects to the too-big-to-fail (TBTF) problem (Boylan-Kolchin et al., 2011; Papastergis et al., 2015). We also mention the large diversity (hereafter dubbed “diversity problem” in analogy to other works) in the dwarf-galaxies rotation curves (RCs), which are at odds with hydrodynamic simulations111Note that the CDM model suffers from others drawbacks like the cosmological constant problem Weinberg (1989); Astashenok and del Popolo (2012), and the cosmic coincidence problem..
A possible solution to these problems is to assume that the DM component is not cold and this leads to a wealth of different models (e.g., self-interacting DM (SIDM) models Spergel and Steinhardt (2000)) recently used by Kaplinghat et al. (2016) to propose a unified solution (at all scales) to the small scale problems of the CDM model.
The study of Kaplinghat et al. (2016) claims the difficulty or impossibility for the CDM model to explain the rotation curve of IC2574 and several other issues, and, in an attempt to solve them, proposes the SIDM model as a possible alternative to the CDM model.
It is thus of fundamental importance to verify whether the CDM model can solve, at all scales, the problems discussed in Kaplinghat et al. (2016).
In the present paper we want to address the following question: does a unified solution exist to the “deficit problem in halos” in the CDM model without invoking a different physics? We will closely follow Kaplinghat et al. (2016) in showing how the “deficit problem in halos” is solved when baryonic physics is taken into account in the CDM model.
The plan of this work is as follows: we first present our semianalytical model in Sec. II. Differently from N-body and hydrodynamical simulations, the model presents the various physical contributions more clearly and allows to disentangle them more easily. We then show, in Sec. III, how it reproduces the clusters (e.g., A2537) presented in Newman et al. (2013a, b), how it explains the RCs of some peculiar galaxies (e.g., IC 2574, this one fitted by Creasey et al. (2017) using SIDM and baryon physics) in Sec. IV, and how it solves the diversity problem discussed by Oman et al. (2015) in Sec. V. Finally we conclude in Sec. VI discussing our results in comparison to those of Kaplinghat et al. (2016).
II Model
Here we recall the model used above. First introduced by Del Popolo (2009); Del Popolo and Kroupa (2009), many of its features were developed in Del Popolo and Hiotelis (2014); Del Popolo and Pace (2016); Del Popolo (2016), and allowed studies of the density profiles’ universality (Del Popolo, 2010, 2011), of the density profile of galaxies (Del Popolo, 2012a, 2014, 2013) and clusters (Del Popolo, 2012b, 2014), and of the inner surface-density of galaxies (Del Popolo et al., 2013a).
The model is a strong improvement of the original spherical collapse model (Gunn and Gott, 1972; Bertschinger, 1985; Hoffman and Shaham, 1985; Ryden and Gunn, 1987; Ascasibar et al., 2004; Williams et al., 2004), and includes the effects of random angular momentum due to random motions arising in the collapse phase (e.g., (Ryden and Gunn, 1987; Williams et al., 2004)) and ordered angular momentum (e.g., (Ryden, 1988; Del Popolo and Gambera, 1997, 2000)) from tidal torques, dark energy (Del Popolo et al., 2013b, c, d; Pace et al., 2014), dynamical friction arising from the interaction between baryons and DM (El-Zant et al., 2001, 2004; Ma and Boylan-Kolchin, 2004; Romano-Díaz et al., 2008, 2009; Del Popolo, 2009; Cole et al., 2011; Inoue and Saitoh, 2011; Nipoti and Binney, 2015), adiabatic contraction (e.g., (Blumenthal et al., 1986; Gnedin et al., 2004; Klypin et al., 2002; Gustafsson et al., 2006)), gas cooling, star formation, photoionization, supernovae and AGN feedback (De Lucia and Helmi, 2008; Li et al., 2010; Martizzi et al., 2012a).
At this stage we want to stress that the main mechanism of the model resides in the dynamical friction and as described in point 5 (see the following), the other mechanisms (e.g. SN feedback) are only contributing at the percent level.
The main evolutionary phases present in the model are listed as follows:
-
1.
In the linear phase the DM and the diffuse gas proto-structure expand to a maximum radius, then DM re-collapses, forming the potential well for baryons to fall into.
-
2.
Baryons are subject to radiative processes and form stars, condense forming clumps which collapse in the centre of the halo.
-
3.
While baryons are compressed during the collapse phase and make the DM profile more cuspy, the formed clumps interact with the DM component and stars via dynamical friction (DF) and transfer energy and angular momentum (AM) (Read and Gilmore, 2005; Pontzen and Governato, 2012; Teyssier et al., 2013) with the result of having DM particles moving away from the centre leading to a net reduction of the central density (El-Zant et al., 2001, 2004). This process leads to the formation of cores in dwarf spheroidals and spirals, while giant galaxies keep a steeper profile due to their deeper potential wells.
-
4.
The effect of DF is amplified by tidal torques and random AM.
-
5.
Finally, in a later phase, supernovae explosions expel gas lowering the stellar density and disrupting smallest gas clumps after their partial conversion into stars (see Nipoti and Binney (2015)). The expulsion of gas has the additional effect of enlarging the core (this is quantified in a few percent effect).
II.1 Density profile
The spherical density perturbation model follows the perturbation evolution from the expansion due to the Hubble flow till the turn-around and then into collapse (Gunn, 1977; Fillmore and Goldreich, 1984). The final profile of the perturbation is given by
| (1) |
where is the initial radius, the collapse factor, the turn-around density and the turn-around radius, which can be written as
| (2) |
In the above expression, represents the matter density parameter and the average overdensity inside a shell of DM and baryons. Initially, in the gas phase, the “universal baryon fraction” is set to (0.167 in Komatsu et al. (2011, 2009)) and evolves, due to star formation processes, as follows.
Using the tidal torque theory (TTT), one can evaluate the “ordered angular momentum” induced by tidal torques exerted by large scale structures on smaller scales (Hoyle, 1953; Peebles, 1969; White, 1984; Ryden, 1988; Eisenstein and Loeb, 1995; Hiotelis and del Popolo, 2013). At the same time, the “random angular momentum” depends on the eccentricity (Avila-Reese et al., 1998), being the apocentric radius, and the pericentric radius. One needs to correct the eccentricity for the effects of the dynamical state of the system found by Ascasibar et al. (2004):
| (3) |
for , being the spherically averaged turn-around radius.
II.2 Baryons, discs, and clumps
Baryons are initially modelled in a gas phase and settle into a rotationally supported stable disk for spiral galaxies. The disc sizes and masses obtained from the model have been shown to solve the angular momentum catastrophe (AMC) (Sect. 3.2, Figs. 3, and 4 of Del Popolo (2014)), producing discs with sizes and masses similar to those of real galaxies.
However, denser discs are unstable, as known from the Jeans’ criterion, despite the shear force stabilisation. Toomre Toomre (1964) gave the disc instability and clump formation condition
| (4) |
with the 1-D velocity dispersion,222In most galaxies hosting clumps km/s. the angular velocity, the surface density, the adiabatic sound speed, and the epicyclic frequency. The fastest growing mode derives from the perturbation dispersion relation when , and is the solution of , giving (see Binney and Tremaine (1987); Nipoti and Binney (2015)). We used that condition to obtain the clumps radii for our galaxy (Krumholz and Dekel, 2010)
| (5) |
Marginally unstable discs () with maximal velocity dispersion have a total mass three times larger than that of the cold disc, form clumps with mass (Dekel et al., 2009), where is the mass of the disk.
Objects of masses few times , and found in haloes at , stay in a marginally unstable phase for Gyr. In general we found that the main properties of clumps are similar to those found by Ceverino et al. (2012).
In agreement with Ma and Boylan-Kolchin (2004); Nipoti et al. (2004); Romano-Díaz et al. (2008, 2009); Del Popolo (2009); Cole et al. (2011); Inoue and Saitoh (2011); Del Popolo and Le Delliou (2014); Nipoti and Binney (2015), energy and AM transfer from clumps to DM flatten the profile more efficiently in smaller haloes.
II.2.1 Clumps lifetime
The clumps discussed above have been observed both in simulations (e.g., Ceverino et al. (2010); Perez et al. (2013); Bournaud et al. (2014); Ceverino et al. (2014); Perret et al. (2014); Ceverino et al. (2015); Behrendt et al. (2016)) and observations.
Clumpy structures, dubbed chain galaxies, and clump clusters are observed in high-redshift galaxies (Elmegreen et al., 2004, 2009; Genzel et al., 2011), while massive star-forming clumps (Guo et al., 2012; Wuyts et al., 2013) were found in HST Ultra Deep Field observations, in a large number of star-forming galaxies (Guo et al., 2015), and even in deeper fields up to Elmegreen et al. (2007).
Very gas-rich disc experiencing radiative cooling in the dense accreting gas induces self-gravity instability that should form those clumpy structures (e.g., (Noguchi, 1998, 1999; Aumer et al., 2010; Ceverino et al., 2010, 2012)).
The clump’s lifetime is crucial in the processes described above: they should transform the cusp into a core, before disruption by stellar feedback, by sinking to the galaxy centre. The mass fraction lost by stellar feedback, , and that transformed into stars , assess the capacity of the clump to form a bound stellar system. According to simulations and analytic models Baumgardt and Kroupa (2007), for , most of the stellar mass will remain bound. Estimation by (Krumholz and Dekel, 2010) of the expulsion fraction , with , , and , can be obtained using the dimensionless star-formation rate efficiency , i.e. the free-fall to depletion time ratio, with stellar mass . For a broad range of densities, size scales and environments, (Krumholz and Tan, 2007). For a typical clump with , and one finds and . Thus clumps mass loss is small before they reach the galactic centre. The previous argument and the relation are valid for smaller clumps, which are however more compact and the corresponding galaxies smaller, with the final result that clumps reach the centre before being destroyed.
An alternative assessment of clumps disruption compares its lifetime to its central migration time. Dynamical friction and tidal torques are responsible for a migration time of Myrs for a mass clump, (Genzel et al., 2011; Nipoti and Binney, 2015).
For clumps similar to those discussed above, the Sedov-Taylor solution ((Genzel et al., 2011), Eqs. 8,9) yields an expansion timescale similar to the migration time.
Ceverino et al. (Ceverino et al., 2010) found that in their hydro-dynamical simulations clumps are in Jeans’ equilibrium and rotationally supported and therefore a long lifetime ( Myr) can be inferred. These findings are in agreement with (Krumholz and Dekel, 2010) who found that clumps survive if only few percent of the gas is converted into stars, in agreement with the Kennicutt-Schmidt law. All these results confirm previous simulations by Elmegreen et al. (2008).
While (Bournaud et al., 2014; Ceverino et al., 2014; Perret et al., 2014) found long-living clumps reaching the centre when properly taking into account stellar feedback, radiative and non-thermal feedback, Perez et al. (2013) obtained long-lived objects for any reasonable amount of feedback.
Strong observational evidence of long-lived clumps derives from the estimation of clump ages through gas expulsion, metal enrichment and expansion time scales (respectively 170-1600 Myrs, Myrs and Myrs) by Genzel et al. (2011).
II.3 Star formation and feedback
The model treatment of gas cooling, star formation, reionisation and supernovae feedback follows the lines of argument of (De Lucia and Helmi, 2008; Li et al., 2010).
Reionisation occurs in the redshift range 11.5-15, changing the baryon fraction as (Li et al., 2010)
| (6) |
with the virial mass and the “filtering mass” (see Kravtsov et al. (2004)), while a cooling flow models the gas cooling (e.g., (White and Frenk, 1991; Li et al., 2010), see Sect. 2.2.2).
Star formation occurs after gas settles in a disk, at a rate given by
| (7) |
resulting in the gas mass conversion into stars
| (8) |
Here, we denote with the gas mass above the density threshold (fixed as in Di Cintio et al. (2014)), and we use the time-step for a disc dynamical time (see De Lucia and Helmi (2008), for more details).
Following Croton et al. (2006), supernovae feedback (SNF) injects energy for SN explosions as
| (9) |
modelling, for a Chabrier IMF Chabrier (2003), the number of supernovae per solar mass as , the disc gas reheating energy efficiency , and the typical SN explosion energy release as erg.
The resulting gas reheating depends on the stars formed
| (10) |
The thermal energy change caused by the reheated gas
| (11) |
induces, if , ejection of
| (12) |
hot gas from the halo, with .
A fundamental difference between the SNF model by Di Cintio et al. (2014) and ours resides in our cusp flattening starting before star formation, and its energy source being gravitational.
Stellar and supernovae feedback start to take place only after DF formed the core, disrupting the core gas clouds (similarly to Nipoti and Binney (2015)).
AGN quenching becomes significant for masses (Cattaneo et al., 2006). The prescription of Martizzi et al. (2012a, b) leads to our account for AGN feedback: when stellar density exceeds , gas density reaches 10 times that, and the 3D velocity dispersion exceeds 100 km/s, a Super-Massive-Black-Hole (SMBH) is formed, seeded at . Hence, a modification of the model by Booth and Schaye (2009), as in Martizzi et al. (2012a), yields SMBH mass accretion and AGN feedback.
Our model demonstrated its robustness in several ways:
-
a.
The cusp flattening from DM heating by collapsing baryonic clumps predicted for galaxies and clusters is in agreement with following studies (El-Zant et al., 2001, 2004; Romano-Díaz et al., 2008, 2009; Cole et al., 2011; Inoue and Saitoh, 2011; Nipoti and Binney, 2015); (Del Popolo, 2011), in Fig. 4, shows a comparison of our model with the SPH simulations of Governato et al. (2010).
-
b.
The correct shape of galaxies density profiles (Del Popolo, 2009; Del Popolo and Kroupa, 2009) was predicted before the SPH simulations by Governato et al. (2010, 2012), and correct clusters density profiles (Del Popolo, 2012b) before Martizzi et al. (2013), although the latter use different dominant mechanisms than the former.
-
c.
The inner slope dependence on halo mass (Del Popolo (2010), Fig. 2a solid line)was predicted before almost the same result was shown in Fig. 6 (the non-extrapolated part of the plot) of Di Cintio et al. (2014), in terms of (which is (Klypin et al., 2011)).
We also found that the inner slope depends on the total baryonic content to total mass ratio Del Popolo (2012b), as seen later in Di Cintio et al. (2014).
(Del Popolo and Pace, 2016; Del Popolo, 2016) show a comparison of the change of the inner slope with mass with the simulations of (Di Cintio et al., 2014). Moreover Figs. 4 and 5 in (Del Popolo and Pace, 2016; Del Popolo, 2016), show a comparison of the Tully-Fisher, Faber-Jackson, relationships with simulations.
III Clusters
The cusp-core problem extends to the scales of cluster of galaxies: combining weak and strong lensing and stellar kinematics, the total inner density profile was shown as well described by dissipationless N-body simulations at radii kpc, while DM profiles are flatter than those obtained in the simulations (Newman et al., 2013a, b), within a radius of kpc, typical of the Brightest Cluster Galaxy (BCG) radius. The DM profile is characterised by a variation of the slope, , from cluster to cluster which correlates with the BCG properties.
The total and the DM density profiles of MS2137, A963, A383, A611, A2537, A1667 and A2390, were determined in the aforementioned works. In Newman et al. (2013a, b), improved data allowed the determination of the stellar mass scale, allowing to produce a more physically consistent analysis, reducing the degeneracy among stellar and dark mass, and taking into account the BCGs homogeneity.
Two different approaches are available to compare the result of our model to the density profiles in Newman et al. (2013a). While the density profile depends on the virial halo mass, , on the baryon fraction, , and on the random AM, as shown in Del Popolo (2012b), one can adjust the value of , so that reproduces the observed clusters profiles. Here we rather prefer the possibility to “simulate” the formation and evolution of clusters with similar characteristics to those of Newman et al. (2013a): final halo mass,333We use as in Newman et al. (2013a) , core radius, etc., 444 By “simulate” we mean that, as in hydrodynamic simulations, we fix the initial conditions and follow the evolution of galaxies, or clusters, from the linear to the non-linear phase, until the object formation, and its subsequent evolution due to the physical effects previously described. by targeting not only the total halo and baryonic masses but also the observed radial density distribution (in the case of Fig. 1) and rotation curve (in the case of Fig. 3).
To obtain reasonable agreement between ours’ and observed clusters, we run simulations till the final halo and baryonic masses and corresponding radial density distributions differ by at most 10% from the observed clusters. To get this results the clusters were resimulated 50 times. To be precise, we iterated the model for each cluster 50 times until the produced clusters exhibited one with DM halo, gas, and stars masses and radial density profiles within 10% of the observed target.
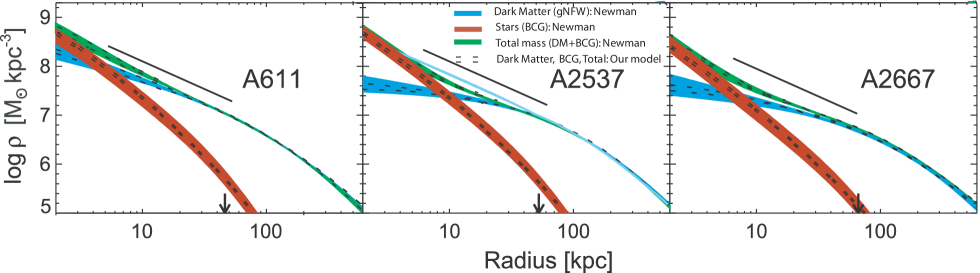
Of all the seven cited clusters, in Fig. 1, we plot the spherically-averaged density profile of A2537 (studied by Kaplinghat et al. (2016)), A611, and A2667 for the DM halo, BCG stars and their sum (total mass). The bottom blue band (upper green band) represents the DM (total mass) density profile determined by Newman et al. (2013a) for the clusters A611, A2537 (studied by Kaplinghat et al. (2016)), and A2667, fitting the profile with a generalized Navarro-Frenk-White (gNFW) profile. The band in black dotted lines is the DM density profile obtained with the model of this paper. The band width represents the 1- uncertainty. The bottom arrow, in each panel, is the three-dimensional half-light radius of the BCG. The segment with slope spans the radial range . The light blue line in the middle panel represents the NFW profile.
The plot shows a good agreement between the observations and the model: an inner DM profile with almost flat slopes in the case of A2537, and much more cuspy as in A611. However, in all the sample the inner slope has an average of , flatter than the NFW profile; a total mass profile close to a NFW profile and baryons dominate the profile in the inner kpc.
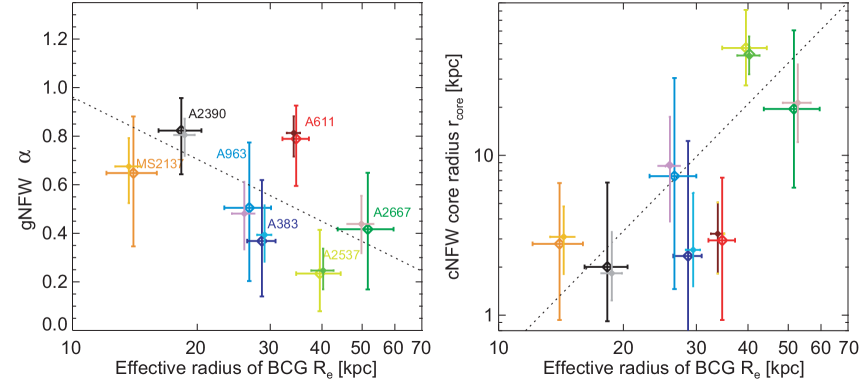
In the left and right panels of Fig. 2, we show some correlations found by (Newman et al., 2013b). The points with error-bars in the middle panel show the value of the inner slope vs the effective radius, , of the BCG for the clusters indicated, obtained fitting their profiles with the generalized Navarro-Frenk-White profile (gNFW). The larger error bars represents the result by Newman et al. (2013b), the smaller ones, our results. The right panel represents the core radii, , vs for the same clusters, obtained fitting the density profiles with a cored NFW model (cNFW) Newman et al. (2013b). Dotted lines are the least-square fits. We point out that while the correlations observed by (Newman et al., 2013b) are re-obtained in our model, simulations, usually reaching mass scales of , do not. Even the simulations by (Martizzi et al., 2012a, 2013) observe a flattening of the inner profile but do not study the correlations.
IV Dwarf and LSBs galaxies
We use our model to simulate 100 galaxies in a CDM cosmology with similar characteristics to the SPARC sample Lelli et al. (2016), a collection of nearby galaxies high-quality RCs. The stellar mass of the simulated sample is in the range . Of the galaxies used by Kaplinghat et al. (2016), IC 2574, NGC 2366, DDO 154, UGC 4325, F563-V2, F563-1, F568-3, UGC 5750, F583-4, F583-1 are included in our larger sample.
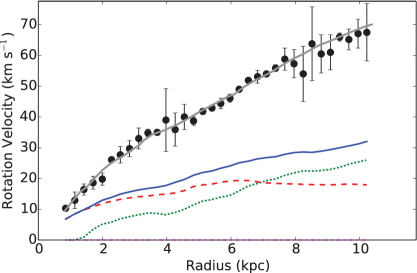
The simulated objects produce a fair sample within the CDM paradigm. The mass distribution follows the halo mass function. In particular we used Del Popolo et al. (2017). The size distribution is a log-normal, as in (Shen et al. (2003), Eq. (12)), and comes from the log-normal distribution of the spin parameter. The observed RCs were compared to the most similar simulated galaxies (e.g., with same halo and baryonic mass). Of particular interest, IC2574 can be mistaken as an outlier if the error bars, of , are not taken into account. However it lies in the outskirts of the distribution and we re-simulated it as we did previously for the clusters of our model to obtain an appropriately similar galaxy, within some percent, of the mass distributions of IC2574. Note that no further tuning was required. As an example, in Fig. 3, we show the RC of IC2574, the same reproduced by SIDM in Kaplinghat et al. (2016).
Similarly to the case of clusters, we run several simulations for this galaxy until the final halo and baryonic masses555Also, here, we refer not only to the total halo and baryonic masses but also the observed radial density distribution (RC). differ by at most 10% from the observational data. The plot shows the observational RC (dots with error-bars), while the model prediction for the RC, the contribution to the RC given by gas, stars, and the total baryonic mass, are represented by the grey continuous line, red dashed line, green dotted line, and blue continuous line, respectively.
As can be seen here, the RC of IC2574 (advocated to be problematic for the scenario of core formation Oman et al. (2015)) is very well described by the simulated galaxy, as well as the baryonic mass, as seen comparing with (Blais-Ouellette et al., 2001) or with the SPARC mass models Oh et al. (2008). We want to stress that the differences between the IC2574 RC’s baryon contribution (gas, stars) in Kaplinghat et al. (2016) from that of SPARC or (Blais-Ouellette et al., 2001) arise from the different DM properties. The halo mass of the simulated galaxy host is . We obtained the virial mass from the stellar mass using Moster et al. (2013). The stellar mass is . The galaxy effective radius is .
Recently Santos-Santos et al. (2017) showed how the RC of IC2574 can be naturally obtained taking into account SN feedback, with a similar approach to ours.
V Diversity
Despite the fact that the RCs of dwarf galaxies are on average cored, individual fits to galaxy RCs show inner slopes ranging from to cusps, while for cored profiles, the central densities can differ by a factor of 10 for galaxies inhabiting similar halos Kuzio de Naray et al. (2010) and the situation becomes more complicated at higher masses. For many objects, Simon et al. (2005) found cored and cuspy profiles in dwarfs which are similar while de Blok et al. (2008) observed a tendency to flatter profiles in less massive galaxies.
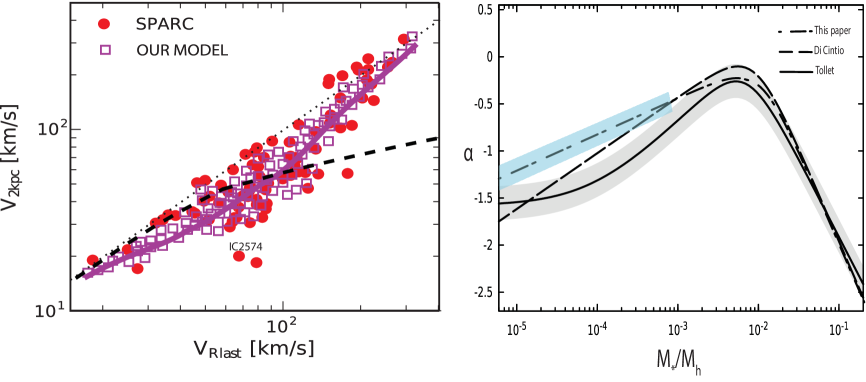
Such diversity was quantified by Oman et al. (2015) comparing the circular velocity at 2 kpc, , with a fixed value of the maximum of circular velocity (). For there is a scatter of a few in . Creasey et al. (2017) studied the problem in the SIDM scenario, and found that SIDM alone cannot explain the scatter, since the resolution requires baryonic physics must also be taken into account.
In Fig. 3, we plot (left panel) versus the outermost measured circular velocity . The dashed line is the expectation for a NFW density profile. The dots are the observed values from Lelli et al. (2016) and the open squares are the prediction of our model. The violet thick line represents the mean trend line. The sample obtained by Lelli et al. (2016) contains galaxies with stellar mass in the range corresponding to circular velocities in the range . In order to compare their results with our model, we chose simulated galaxies with stellar mass in the range of Lelli et al. (2016) and we calculated and . 666 for simulated galaxies is given from the linear fit to the SPARC galaxies distributed in the plane .
As the dots show, at fixed , the scatter in can be as large as a factor of four. Such scatter cannot be explained by the CDM model, as it produces cuspy and self-similar halo density profiles, with a single parameter (concentration parameter or halo mass), in contrast to the cores displayed by many dwarfs. In the CDM model, the much larger amount of DM in the halo cusp than the baryons “freezes” the scatter in , produced, conversely, by the spread in the baryon distribution. Baryon physics heats DM and enlarge the galaxies, reducing the inner DM content. As shown in Del Popolo (2010, 2016), the inner slope of the halo density profile is mass dependent. Milky Way-sized galaxies tend to have cuspy profiles while dwarf-sized galaxies cored profiles. Ultrafaint dwarf galaxies tend to be more cuspy than dwarfs. Therefore, the scatter seen in Fig. 3 originates from the mass dependence of the core formation process and the effects of environment, as described in Del Popolo (2012a).
Our model successfully recovers the scatter and distribution of the RCs shapes because baryon physics gives rise to different responses in the halo of simulated galaxies. The right panel of Fig. 4 represents the inner slope of the DM halo obtained in (Di Cintio et al., 2014), dashed line, in the present paper, dot-dashed line, and in (Tollet et al., 2016), solid line. All the curves were obtained as in (Di Cintio et al., 2014) by fitting the DM profile with a power law in the radial range , being the virial radius. The shaded blue and grey region represents the 1- scatter in our result and (Tollet et al., 2016).
The plot shows that the core formation mechanism and are strongly dependent on 777The correlation between and can be expressed in terms of , using for example the relation inMoster et al. (2013). with a minimum value of at masses corresponding to (Di Cintio et al., 2014; Tollet et al., 2016; Del Popolo and Pace, 2016) due to the maximum effects of baryon physics. For smaller masses the profile steepens because of the relative decrease of stars (ratio ). Since the profile tends to steepen for and is proportional to , we should expect a self-similar behaviour, similar to the NFW RCs, as observed in Fig. 4, left panel. For , the increase in stellar masses gives rise to a deepening of the potential well and a reduction of the effects of baryon physics, with a consequent steepening of the profile. Notice that, because we account for star formation modification by AGN feedback which counters baryon cooling, our trend line agrees with SPARC at . Moreover, hydrodynamics simulations usually examine isolated galaxies while in our model the account of tidal interactions makes it more environment dependent.
VI Conclusions
The CDM model exhibits some problems at small scales, and in particular predicts an excess of DM in the central parts of galaxies and clusters. In this paper, we showed that a unified solution to the problem can be obtained within the CDM framework without introducing different forms of DM (as done in Kaplinghat et al., 2016, instead). With a semi-analytic model whose main mechanism is based on dynamical friction, we simulated the clusters studied by (Newman et al., 2013b) and compared the density profiles with those they obtained: those profiles were re-obtained correctly by our model.
We displayed one of those density profiles (Fig. 1).
We then simulated a sample of galaxies similar to the SPARC compilation, also containing the galaxies studied by (Kaplinghat et al., 2016), finding again a good agreement with data, as shown in the case of one of the most complicated galaxy RCs to reproduce, namely that of IC2574 (Fig. 3).
We want to stress that to match observations we re-simulated the object studied by targeting not only the total halo and baryonic masses but also the observed radial density distribution (in the case of Fig. 1) and rotation curve (in the case of Fig. 3).
Finally, we studied the “diversity” problem using the simulated galaxies, and comparing their , for given values of with the compilation in (Lelli et al., 2016). We show that baryon physics gives rise to RCs very different from each other, due to the dependence of the RC from their total and stellar mass, together with environment. This explains the scatter in the - plane.
Acknowledgements
F.P. acknowledges support from STFC grant ST/P000649/1. A.D.P. was supported by the Chinese Academy of Sciences and by the President’s International Fellowship Initiative, Grant No. 2017 VMA0044. The authors thank an anonymous referee whose comments helped to improve the scientific content of this work.
References
- Spergel et al. (2003) D. N. Spergel, L. Verde, H. V. Peiris, E. Komatsu, M. R. Nolta, C. L. Bennett, M. Halpern, G. Hinshaw, N. Jarosik, A. Kogut, M. Limon, S. S. Meyer, L. Page, G. S. Tucker, J. L. Weiland, E. Wollack, and E. L. Wright, ApJS 148, 175 (2003), astro-ph/0302209 .
- Komatsu et al. (2011) E. Komatsu, K. M. Smith, J. Dunkley, and et al., ApJS 192, 18 (2011), arXiv:1001.4538 [astro-ph.CO] .
- Weinberg (1989) S. Weinberg, Reviews of Modern Physics 61, 1 (1989).
- Astashenok and del Popolo (2012) A. V. Astashenok and A. del Popolo, Classical and Quantum Gravity 29, 085014 (2012), arXiv:1203.2290 [gr-qc] .
- Navarro et al. (1996) J. F. Navarro, C. S. Frenk, and S. D. M. White, ApJ 462, 563 (1996), astro-ph/9508025 .
- Moore (1994) B. Moore, Nature (London) 370, 629 (1994).
- Flores and Primack (1994) R. A. Flores and J. R. Primack, ApJL 427, L1 (1994), astro-ph/9402004 .
- Cardone and Del Popolo (2012) V. F. Cardone and A. Del Popolo, MNRAS 427, 3176 (2012), arXiv:1209.1524 [astro-ph.CO] .
- Boylan-Kolchin et al. (2011) M. Boylan-Kolchin, J. S. Bullock, and M. Kaplinghat, MNRAS 415, L40 (2011), arXiv:1103.0007 [astro-ph.CO] .
- Papastergis et al. (2015) E. Papastergis, R. Giovanelli, M. P. Haynes, and F. Shankar, A&A 574, A113 (2015), arXiv:1407.4665 .
- Spergel and Steinhardt (2000) D. N. Spergel and P. J. Steinhardt, Physical Review Letters 84, 3760 (2000), astro-ph/9909386 .
- Kaplinghat et al. (2016) M. Kaplinghat, S. Tulin, and H.-B. Yu, Physical Review Letters 116, 041302 (2016), arXiv:1508.03339 .
- Newman et al. (2013a) A. B. Newman, T. Treu, R. S. Ellis, D. J. Sand, C. Nipoti, J. Richard, and E. Jullo, ApJ 765, 24 (2013a), arXiv:1209.1391 [astro-ph.CO] .
- Newman et al. (2013b) A. B. Newman, T. Treu, R. S. Ellis, and D. J. Sand, ApJ 765, 25 (2013b), arXiv:1209.1392 [astro-ph.CO] .
- Creasey et al. (2017) P. Creasey, O. Sameie, L. V. Sales, H.-B. Yu, M. Vogelsberger, and J. Zavala, MNRAS 468, 2283 (2017), arXiv:1612.03903 .
- Oman et al. (2015) K. A. Oman, J. F. Navarro, A. Fattahi, C. S. Frenk, T. Sawala, S. D. M. White, R. Bower, R. A. Crain, M. Furlong, M. Schaller, J. Schaye, and T. Theuns, MNRAS 452, 3650 (2015), arXiv:1504.01437 .
- Del Popolo (2009) A. Del Popolo, ApJ 698, 2093 (2009), arXiv:0906.4447 [astro-ph.CO] .
- Del Popolo and Kroupa (2009) A. Del Popolo and P. Kroupa, A&A 502, 733 (2009), arXiv:0906.1146 [astro-ph.CO] .
- Del Popolo and Hiotelis (2014) A. Del Popolo and N. Hiotelis, JCAP 1, 047 (2014), arXiv:1401.6577 [astro-ph.GA] .
- Del Popolo and Pace (2016) A. Del Popolo and F. Pace, Astrophysics and Space Science 361, 162 (2016), arXiv:1502.01947 .
- Del Popolo (2016) A. Del Popolo, Astrophysics and Space Science 361, 222 (2016), arXiv:1607.07408 .
- Del Popolo (2010) A. Del Popolo, MNRAS 408, 1808 (2010), arXiv:1012.4322 [astro-ph.CO] .
- Del Popolo (2011) A. Del Popolo, JCAP 7, 014 (2011), arXiv:1112.4185 [astro-ph.CO] .
- Del Popolo (2012a) A. Del Popolo, MNRAS 419, 971 (2012a), arXiv:1105.0090 [astro-ph.CO] .
- Del Popolo (2014) A. Del Popolo, International Journal of Modern Physics D 23, 1430005 (2014), arXiv:1305.0456 [astro-ph.CO] .
- Del Popolo (2013) A. Del Popolo, in AIP Conf. Proc., Vol. 1548 (2013) pp. 2–63.
- Del Popolo (2012b) A. Del Popolo, MNRAS 424, 38 (2012b), arXiv:1204.4439 [astro-ph.CO] .
- Del Popolo et al. (2013a) A. Del Popolo, V. F. Cardone, and G. Belvedere, MNRAS 429, 1080 (2013a), arXiv:1212.6797 [astro-ph.CO] .
- Gunn and Gott (1972) J. E. Gunn and J. R. Gott, III, ApJ 176, 1 (1972).
- Bertschinger (1985) E. Bertschinger, ApJS 58, 39 (1985).
- Hoffman and Shaham (1985) Y. Hoffman and J. Shaham, ApJ 297, 16 (1985).
- Ryden and Gunn (1987) B. S. Ryden and J. E. Gunn, ApJ 318, 15 (1987).
- Ascasibar et al. (2004) Y. Ascasibar, G. Yepes, S. Gottlöber, and V. Müller, MNRAS 352, 1109 (2004), arXiv:astro-ph/0312221 .
- Williams et al. (2004) L. L. R. Williams, A. Babul, and J. J. Dalcanton, ApJ 604, 18 (2004), arXiv:astro-ph/0312002 .
- Ryden (1988) B. S. Ryden, ApJ 329, 589 (1988).
- Del Popolo and Gambera (1997) A. Del Popolo and M. Gambera, A&A 321, 691 (1997), astro-ph/9610052 .
- Del Popolo and Gambera (2000) A. Del Popolo and M. Gambera, A&A 357, 809 (2000), astro-ph/9909156 .
- Del Popolo et al. (2013b) A. Del Popolo, F. Pace, and J. A. S. Lima, International Journal of Modern Physics D 22, 1350038 (2013b), arXiv:1207.5789 [astro-ph.CO] .
- Del Popolo et al. (2013c) A. Del Popolo, F. Pace, and J. A. S. Lima, MNRAS 430, 628 (2013c), arXiv:1212.5092 [astro-ph.CO] .
- Del Popolo et al. (2013d) A. Del Popolo, F. Pace, S. P. Maydanyuk, J. A. S. Lima, and J. F. Jesus, Phys. Rev. D 87, 043527 (2013d), arXiv:1303.3628 [astro-ph.CO] .
- Pace et al. (2014) F. Pace, R. C. Batista, and A. Del Popolo, MNRAS 445, 648 (2014), arXiv:1406.1448 .
- El-Zant et al. (2001) A. El-Zant, I. Shlosman, and Y. Hoffman, ApJ 560, 636 (2001), astro-ph/0103386 .
- El-Zant et al. (2004) A. A. El-Zant, Y. Hoffman, J. Primack, F. Combes, and I. Shlosman, ApJL 607, L75 (2004), astro-ph/0309412 .
- Ma and Boylan-Kolchin (2004) C.-P. Ma and M. Boylan-Kolchin, Physical Review Letters 93, 021301 (2004), astro-ph/0403102 .
- Romano-Díaz et al. (2008) E. Romano-Díaz, I. Shlosman, Y. Hoffman, and C. Heller, ApJL 685, L105 (2008), arXiv:0808.0195 .
- Romano-Díaz et al. (2009) E. Romano-Díaz, I. Shlosman, C. Heller, and Y. Hoffman, ApJ 702, 1250 (2009), arXiv:0901.1317 [astro-ph.CO] .
- Cole et al. (2011) D. R. Cole, W. Dehnen, and M. I. Wilkinson, MNRAS 416, 1118 (2011), arXiv:1105.4050 [astro-ph.CO] .
- Inoue and Saitoh (2011) S. Inoue and T. R. Saitoh, MNRAS 418, 2527 (2011), arXiv:1108.0906 [astro-ph.CO] .
- Nipoti and Binney (2015) C. Nipoti and J. Binney, MNRAS 446, 1820 (2015), arXiv:1410.6169 .
- Blumenthal et al. (1986) G. R. Blumenthal, S. M. Faber, R. Flores, and J. R. Primack, ApJ 301, 27 (1986).
- Gnedin et al. (2004) O. Y. Gnedin, A. V. Kravtsov, A. A. Klypin, and D. Nagai, ApJ 616, 16 (2004), astro-ph/0406247 .
- Klypin et al. (2002) A. Klypin, H. Zhao, and R. S. Somerville, ApJ 573, 597 (2002), astro-ph/0110390 .
- Gustafsson et al. (2006) M. Gustafsson, M. Fairbairn, and J. Sommer-Larsen, Phys. Rev. D 74, 123522 (2006), astro-ph/0608634 .
- De Lucia and Helmi (2008) G. De Lucia and A. Helmi, MNRAS 391, 14 (2008), arXiv:0804.2465 .
- Li et al. (2010) Y.-S. Li, G. De Lucia, and A. Helmi, MNRAS 401, 2036 (2010), arXiv:0909.1291 [astro-ph.GA] .
- Martizzi et al. (2012a) D. Martizzi, R. Teyssier, B. Moore, and T. Wentz, MNRAS 422, 3081 (2012a), arXiv:1112.2752 [astro-ph.CO] .
- Read and Gilmore (2005) J. I. Read and G. Gilmore, MNRAS 356, 107 (2005), astro-ph/0409565 .
- Pontzen and Governato (2012) A. Pontzen and F. Governato, MNRAS 421, 3464 (2012), arXiv:1106.0499 [astro-ph.CO] .
- Teyssier et al. (2013) R. Teyssier, A. Pontzen, Y. Dubois, and J. I. Read, MNRAS 429, 3068 (2013), arXiv:1206.4895 [astro-ph.CO] .
- Gunn (1977) J. E. Gunn, ApJ 218, 592 (1977).
- Fillmore and Goldreich (1984) J. A. Fillmore and P. Goldreich, ApJ 281, 1 (1984).
- Komatsu et al. (2009) E. Komatsu, J. Dunkley, M. R. Nolta, and et al., ApJS 180, 330 (2009), arXiv:0803.0547 .
- Hoyle (1953) F. Hoyle, ApJ 118, 513 (1953).
- Peebles (1969) P. J. E. Peebles, ApJ 155, 393 (1969).
- White (1984) S. D. M. White, ApJ 286, 38 (1984).
- Eisenstein and Loeb (1995) D. J. Eisenstein and A. Loeb, ApJ 439, 520 (1995), arXiv:astro-ph/9405012 .
- Hiotelis and del Popolo (2013) N. Hiotelis and A. del Popolo, MNRAS 436, 163 (2013).
- Avila-Reese et al. (1998) V. Avila-Reese, C. Firmani, and X. Hernández, ApJ 505, 37 (1998), astro-ph/9710201 .
- Spedicato et al. (2003) E. Spedicato, E. Bodon, A. D. Popolo, and N. Mahdavi-Amiri, Quarterly Journal of the Belgian, French and Italian Operations Research Societies 1, 51 (2003).
- Toomre (1964) A. Toomre, ApJ 139, 1217 (1964).
- Binney and Tremaine (1987) J. Binney and S. Tremaine, Princeton, NJ, Princeton University Press, 1987, 747 p. (1987).
- Krumholz and Dekel (2010) M. R. Krumholz and A. Dekel, MNRAS 406, 112 (2010), arXiv:1001.0765 .
- Dekel et al. (2009) A. Dekel, R. Sari, and D. Ceverino, ApJ 703, 785 (2009), arXiv:0901.2458 [astro-ph.GA] .
- Ceverino et al. (2012) D. Ceverino, A. Dekel, N. Mandelker, F. Bournaud, A. Burkert, R. Genzel, and J. Primack, MNRAS 420, 3490 (2012), arXiv:1106.5587 .
- Nipoti et al. (2004) C. Nipoti, T. Treu, L. Ciotti, and M. Stiavelli, MNRAS 355, 1119 (2004), astro-ph/0404127 .
- Del Popolo and Le Delliou (2014) A. Del Popolo and M. Le Delliou, JCAP 12, 051 (2014), arXiv:1408.4893 .
- Ceverino et al. (2010) D. Ceverino, A. Dekel, and F. Bournaud, MNRAS 404, 2151 (2010), arXiv:0907.3271 [astro-ph.CO] .
- Perez et al. (2013) J. Perez, O. Valenzuela, P. B. Tissera, and L. Michel-Dansac, MNRAS 436, 259 (2013), arXiv:1308.4396 .
- Bournaud et al. (2014) F. Bournaud, V. Perret, F. Renaud, A. Dekel, B. G. Elmegreen, D. M. Elmegreen, R. Teyssier, P. Amram, E. Daddi, P.-A. Duc, D. Elbaz, B. Epinat, J. M. Gabor, S. Juneau, K. Kraljic, and E. Le Floch’, ApJ 780, 57 (2014), arXiv:1307.7136 [astro-ph.CO] .
- Ceverino et al. (2014) D. Ceverino, A. Klypin, E. S. Klimek, S. Trujillo-Gomez, C. W. Churchill, J. Primack, and A. Dekel, MNRAS 442, 1545 (2014), arXiv:1307.0943 .
- Perret et al. (2014) V. Perret, F. Renaud, B. Epinat, P. Amram, F. Bournaud, T. Contini, R. Teyssier, and J.-C. Lambert, A&A 562, A1 (2014), arXiv:1307.7130 .
- Ceverino et al. (2015) D. Ceverino, A. Dekel, D. Tweed, and J. Primack, MNRAS 447, 3291 (2015), arXiv:1409.2622 .
- Behrendt et al. (2016) M. Behrendt, A. Burkert, and M. Schartmann, ApJL 819, L2 (2016), arXiv:1512.03430 .
- Elmegreen et al. (2004) D. M. Elmegreen, B. G. Elmegreen, and A. C. Hirst, ApJL 604, L21 (2004), astro-ph/0402477 .
- Elmegreen et al. (2009) D. M. Elmegreen, B. G. Elmegreen, M. T. Marcus, K. Shahinyan, A. Yau, and M. Petersen, ApJ 701, 306 (2009), arXiv:0906.2660 [astro-ph.CO] .
- Genzel et al. (2011) R. Genzel, S. Newman, T. Jones, N. M. Förster Schreiber, K. Shapiro, S. Genel, S. J. Lilly, and et al., ApJ 733, 101 (2011), arXiv:1011.5360 [astro-ph.CO] .
- Guo et al. (2012) Y. Guo, M. Giavalisco, H. C. Ferguson, P. Cassata, and A. M. Koekemoer, ApJ 757, 120 (2012), arXiv:1110.3800 .
- Wuyts et al. (2013) S. Wuyts, N. M. Förster Schreiber, E. J. Nelson, P. G. van Dokkum, G. Brammer, Y.-Y. Chang, S. M. Faber, H. C. Ferguson, M. Franx, M. Fumagalli, R. Genzel, N. A. Grogin, D. D. Kocevski, A. M. Koekemoer, B. Lundgren, D. Lutz, E. J. McGrath, I. Momcheva, D. Rosario, R. E. Skelton, L. J. Tacconi, A. van der Wel, and K. E. Whitaker, ApJ 779, 135 (2013), arXiv:1310.5702 .
- Guo et al. (2015) Y. Guo, H. C. Ferguson, E. F. Bell, D. C. Koo, C. J. Conselice, M. Giavalisco, S. Kassin, Y. Lu, R. Lucas, N. Mandelker, D. M. McIntosh, J. R. Primack, S. Ravindranath, G. Barro, D. Ceverino, A. Dekel, S. M. Faber, J. J. Fang, A. M. Koekemoer, K. Noeske, M. Rafelski, and A. Straughn, ApJ 800, 39 (2015), arXiv:1410.7398 .
- Elmegreen et al. (2007) D. M. Elmegreen, B. G. Elmegreen, S. Ravindranath, and D. A. Coe, ApJ 658, 763 (2007), astro-ph/0701121 .
- Noguchi (1998) M. Noguchi, Nature (London) 392, 253 (1998).
- Noguchi (1999) M. Noguchi, ApJ 514, 77 (1999), astro-ph/9806355 .
- Aumer et al. (2010) M. Aumer, A. Burkert, P. H. Johansson, and R. Genzel, ApJ 719, 1230 (2010), arXiv:1007.0169 .
- Baumgardt and Kroupa (2007) H. Baumgardt and P. Kroupa, MNRAS 380, 1589 (2007), arXiv:0707.1944 .
- Krumholz and Tan (2007) M. R. Krumholz and J. C. Tan, ApJ 654, 304 (2007), astro-ph/0606277 .
- Elmegreen et al. (2008) B. G. Elmegreen, F. Bournaud, and D. M. Elmegreen, ApJ 688, 67 (2008), arXiv:0808.0716 .
- Elmegreen et al. (2013) B. G. Elmegreen, D. M. Elmegreen, J. Sánchez Almeida, C. Muñoz-Tuñón, J. Dewberry, J. Putko, Y. Teich, and M. Popinchalk, ApJ 774, 86 (2013), arXiv:1308.0306 .
- Garland et al. (2015) C. A. Garland, D. J. Pisano, M.-M. Mac Low, K. Kreckel, K. Rabidoux, and R. Guzmán, ApJ 807, 134 (2015), arXiv:1506.04649 .
- Mandelker et al. (2017) N. Mandelker, A. Dekel, D. Ceverino, C. DeGraf, Y. Guo, and J. Primack, MNRAS 464, 635 (2017), arXiv:1512.08791 .
- Kravtsov et al. (2004) A. V. Kravtsov, O. Y. Gnedin, and A. A. Klypin, ApJ 609, 482 (2004), astro-ph/0401088 .
- White and Frenk (1991) S. D. M. White and C. S. Frenk, ApJ 379, 52 (1991).
- Di Cintio et al. (2014) A. Di Cintio, C. B. Brook, A. V. Macciò, G. S. Stinson, A. Knebe, A. A. Dutton, and J. Wadsley, MNRAS 437, 415 (2014), arXiv:1306.0898 [astro-ph.CO] .
- Croton et al. (2006) D. J. Croton, V. Springel, S. D. M. White, G. De Lucia, C. S. Frenk, L. Gao, A. Jenkins, G. Kauffmann, J. F. Navarro, and N. Yoshida, MNRAS 365, 11 (2006), astro-ph/0508046 .
- Chabrier (2003) G. Chabrier, PASP 115, 763 (2003), astro-ph/0304382 .
- Cattaneo et al. (2006) A. Cattaneo, A. Dekel, J. Devriendt, B. Guiderdoni, and J. Blaizot, MNRAS 370, 1651 (2006), astro-ph/0601295 .
- Martizzi et al. (2012b) D. Martizzi, R. Teyssier, and B. Moore, MNRAS 420, 2859 (2012b), arXiv:1106.5371 [astro-ph.CO] .
- Booth and Schaye (2009) C. M. Booth and J. Schaye, MNRAS 398, 53 (2009), arXiv:0904.2572 .
- Governato et al. (2010) F. Governato, C. Brook, L. Mayer, A. Brooks, G. Rhee, J. Wadsley, P. Jonsson, B. Willman, G. Stinson, T. Quinn, and P. Madau, Nature (London) 463, 203 (2010), arXiv:0911.2237 [astro-ph.CO] .
- Governato et al. (2012) F. Governato, A. Zolotov, A. Pontzen, C. Christensen, S. H. Oh, A. M. Brooks, T. Quinn, S. Shen, and J. Wadsley, MNRAS 422, 1231 (2012), arXiv:1202.0554 [astro-ph.CO] .
- Martizzi et al. (2013) D. Martizzi, R. Teyssier, and B. Moore, MNRAS 432, 1947 (2013), arXiv:1211.2648 .
- Klypin et al. (2011) A. A. Klypin, S. Trujillo-Gomez, and J. Primack, ApJ 740, 102 (2011), arXiv:1002.3660 .
- Lelli et al. (2016) F. Lelli, S. S. McGaugh, and J. M. Schombert, AJ 152, 157 (2016), arXiv:1606.09251 .
- Del Popolo et al. (2017) A. Del Popolo, F. Pace, and M. Le Delliou, JCAP 3, 032 (2017), arXiv:1703.06918 .
- Shen et al. (2003) S. Shen, H. J. Mo, S. D. M. White, M. R. Blanton, G. Kauffmann, W. Voges, J. Brinkmann, and I. Csabai, MNRAS 343, 978 (2003), astro-ph/0301527 .
- Blais-Ouellette et al. (2001) S. Blais-Ouellette, P. Amram, and C. Carignan, AJ 121, 1952 (2001), astro-ph/0006449 .
- Oh et al. (2008) S.-H. Oh, W. J. G. de Blok, F. Walter, E. Brinks, and R. C. Kennicutt, Jr., AJ 136, 2761 (2008), arXiv:0810.2119 .
- Moster et al. (2013) B. P. Moster, T. Naab, and S. D. M. White, MNRAS 428, 3121 (2013), arXiv:1205.5807 [astro-ph.CO] .
- Santos-Santos et al. (2017) I. M. Santos-Santos, A. Di Cintio, C. B. Brook, A. Macciò, A. Dutton, and R. Domínguez-Tenreiro, ArXiv e-prints (2017), arXiv:1706.04202 .
- Tollet et al. (2016) E. Tollet, A. V. Macciò, A. A. Dutton, G. S. Stinson, L. Wang, C. Penzo, T. A. Gutcke, T. Buck, X. Kang, C. Brook, A. Di Cintio, B. W. Keller, and J. Wadsley, MNRAS 456, 3542 (2016), arXiv:1507.03590 .
- Kuzio de Naray et al. (2010) R. Kuzio de Naray, G. D. Martinez, J. S. Bullock, and M. Kaplinghat, ApJL 710, L161 (2010), arXiv:0912.3518 .
- Simon et al. (2005) J. D. Simon, A. D. Bolatto, A. Leroy, L. Blitz, and E. L. Gates, ApJ 621, 757 (2005), astro-ph/0412035 .
- de Blok et al. (2008) W. J. G. de Blok, F. Walter, E. Brinks, C. Trachternach, S.-H. Oh, and R. C. Kennicutt, Jr., AJ 136, 2648 (2008), arXiv:0810.2100 .