Limits on Electroweak Instanton-Induced Processes
with Multiple Boson Production
Abstract:
Recently, the CMS collaboration has reported their search for electroweak instanton-like processes with anomalous violation assuming multi-fermion but zero-boson final states. On the other hand, many theoretical studies suggest that anomalous processes may have an observably large production rate only if their final state contains a large number of electroweak gauge bosons. In this paper, we review the state-of-the-art of the predictions of electroweak instanton-induced processes and compare collider signatures of zero- and multi-boson events of anomalous violation at the LHC. An upper limit on the cross-section for the multi-boson process is derived by recasting the CMS analysis.
DESY 18-169
1 Introduction
The discovery of the Higgs boson at the LHC has marked the completion of the Standard Model (SM) of electroweak and strong interactions. Moreover, so far, no compelling evidence for physics beyond the SM has been observed at the LHC. In fact, the perturbative SM predictions for hard, short distance dominated scattering processes are all verified experimentally to a remarkable precision.
Theory predicts, however, that there are also hard scattering processes in the SM whose amplitudes are fundamentally non-perturbative. Their existence follows from axial anomalies [1, 2, 3] in the SM, resulting in an anomalous violation of baryon plus lepton number, , in electroweak interactions [4, 5]. They are induced by topological fluctuations of the non-Abelian SU(2)L gauge fields, notably electroweak instantons [6, 7]. Anomalous violating processes are believed to be very important in the high temperature primordial plasma after the big bang [8, 9, 10] and to have therefore a crucial impact on the evolution of the baryon and lepton asymmetries of the universe (see Ref. [11] for a review).
A very interesting, albeit unsolved question is whether manifestations of such topological fluctuations might be directly observable in high-energy scattering at present or future colliders. This question has been raised originally in the late eighties in [12, 13], but, despite a lot of effort, the actual size of the cross-sections in the relevant, tens of TeV energy regime could not be determined.
Nevertheless, it has been established (for reviews, see Refs. [11, 14, 15]) that the inclusive cross-section for electroweak -violating processes,
| (1) |
can be written in the form
| (2) |
where
| (3) |
is the quark-quark centre-of-mass energy in terms of the scale
| (4) |
which is parametrically similar to the energy of the sphaleron, TeV – the static energy of a classically unstable saddle-point solution of the static bosonic field equations of the electroweak theory, corresponding to the minimal barrier height between inequivalent vacua with different values of the Chern-Simons topological index [16, 17]. The ‘holy grail function’ in the exponent is known in terms of an expansion in , whose first few terms are given by [18, 19, 20, 21, 22]
| (5) |
while the pre-exponential factor reads [19, 23]111 The difference in the energy dependence (i.e. the powers of ) between Eq. (6) and the formula in Ref. [19] is due to the different number of fermions assumed. For the general case involving fermions, .
| (6) |
where .
Obviously, in the energy region , the inclusive cross-section for ()-violation is unobservably small, due to the tremendous exponential suppression factor, , typical for a quantum tunneling process. Nevertheless, it is exponentially growing in this energy region. Intriguingly, the characteristic scale for the exponential growth is and thus of the order of the sphaleron energy. One may interpret this as a hint that the process proceeds via an intermediate virtual sphaleron-like field configuration. This interpretation is also backed-up by the fact that the inclusive cross-section (2) is dominated by a semi-classically large number of and Higgs bosons [24],
| (7) |
and
| (8) |
in line with the expectation from the decay of a sphaleron-like intermediate state [25]. Unfortunately, however, the perturbative expansion of the holy-grail function in powers of breaks down around and therefore it is not possible to infer the size of the cross-section at centre-of-mass energies relevant for the LHC.
The multi-boson events such as Eq. (1) lead to spectacular collider signatures. According to Eq. (7), one expects electroweak bosons in an event on average.222 The number of Higgs bosons is only a few according to Eq. (8). To study collider signatures of Eq. (1), the event generator HERBVI [26] was developed, and the first thorough phenomenological study was carried out in Ref. [27].
After the end of the SSC project in the early nineties, the motivation for theorists to decide this question immediately dropped considerably and the research in this direction essentially stopped.333Instead, then the theory [28, 29], phenomenology [30] and experimental searches [31, 32, 33] for the analogous instanton-induced processes in QCD were developed. However, a recent paper by Tye and Wong [34], presenting qualitative arguments in favour of observable rates for electroweak ()-violation, revived the interest in it and motivated phenomenological [35, 36, 37, 38, 39, 40, 41] and experimental studies. In particular, the CMS collaboration has recently reported their results of searching for signatures of electroweak instanton-induced processes at the LHC [42].
There is, however, a remarkable difference between the processes considered in the CMS analysis and the virtual sphaleron-like processes discussed in the literature and briefly summarised above. Following earlier studies [35] and for simplicity, CMS postulated the zero-boson process
| (9) |
where , 9 or 11, and represent quark/lepton or anti-quark/anti-lepton depending on how the fermion lines are contracted with an effective vertex in the instanton background with topological charge . In the CMS analysis, the event generator BaryoGEN [43] was used to simulate the process in Eq. (9).
In this paper we investigate the difference in collider signatures between multi- and zero-boson process (i.e. Eq. (1) and Eq. (9)) using the HERBVI and BaryoGEN event generators, respectively. After comparing various distributions in section 3, we recast the original CMS analysis and derive the cross-section upper limit on the sphaleron-like multi-boson process in section 4. Section 5 is devoted to conclusions.
2 Event simulation
It has been suggested that the steeply-rising event rate of sphaleron-like processes can be modelled by a sharp threshold behaviour as a function of the partonic centre-of-mass energy, [44]. We therefore postulate the following partonic cross-section:
| (10) |
where is the Heaviside theta function; for and 0 otherwise, and is the partonic threshold energy. We take TeV as the default value for our simulation (later varying it by TeV), motivated by the fact that the sphaleron barrier height with GeV is given by TeV [16]. In Eq. (10), the cross-section is normalised by up to the dimensionless parameter , which controls the overall cross-section. The same parametrisation is used in the CMS analysis [42].
The event samples for zero- and multi-boson final states are generated by BaryoGEN [43] and HERBVI [26], respectively, for collisions at centre-of-mass energy TeV. Since BaryoGEN only generates partonic final states from the hard process, the sample is passed to Pythia 8 [45] to simulate the parton shower and hadronization. HERBVI is a hard process generator interfaced to the Fortran HERWIG generator [46]. For this study we use the last Fortran version HERWIG 6.521 [47].
The above hadronic samples are then passed to Delphes [48] to simulate the detector response. We tune the parameters in Delphes in such a way that it emulates the CMS analysis [42] as accurately as possible. Jets are reconstructed using the anti- algorithm with cone size 0.4. Leptons (electrons and muons) and photons are required to be isolated from neighbouring energy activity within (muons) or 0.3 (electrons and photons). We require the scalar sum of the transverse momenta of the particles within this cone (excluding the targeted object itself (lepton or photon)) to be less than 15% (muons), 10% (electrons) or 12% (photons) of the of the targeted object. We demand GeV for all objects (jets, leptons and photons) and (jets), (muons) and (electrons and photons).
3 Zero vs high boson multiplicity events
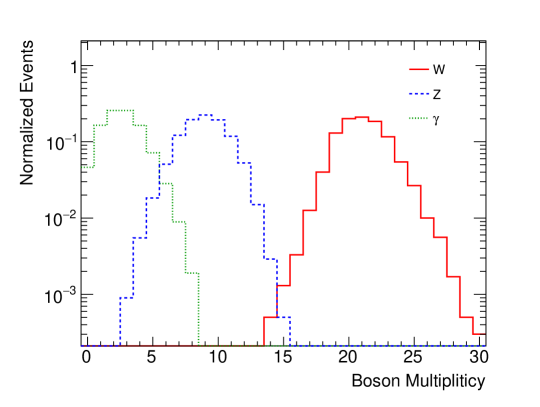
We begin this section by showing the boson multiplicity distributions obtained by HERBVI in Fig. 1. The distributions are obtained as follows. First, the gauge boson multiplicity distribution has been calculated in the symmetric phase using the leading-order matrix element formula given in [12, 13, 27]. The distributions of and are obtained by transforming the neutral bosons into and with probabilities and , respectively. One can see in the figure that the boson multiplicity peaks around 20. One the other hand, the central value of the multiplicity is about a factor of 2 smaller. The number of photons per event is rather modest but 2 or 3 photons are expected on average. We do not show the Higgs boson multiplicity distribution because it is negligible compared to that of gauge bosons.
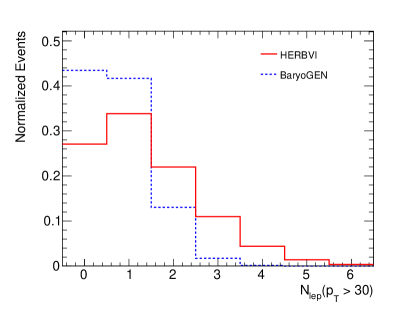
We now compare various distributions obtained for the events with zero- (BaryoGEN) and multi- (HERBVI) boson final states in Fig. 2. In this and the rest of the figures, the blue-dashed and red-solid histograms correspond to the distributions for the zero- and multi-boson final state events, respectively.

The top panel shows the jet multiplicity distributions. As expected, the distribution for zero-boson final states peaks around , since 7, 9 or 11 quarks are present in the final states coming from the hard interaction, although some extra jets can arise from initial- and final-state QCD radiation. On the other hand, peaks around 22 in the multi-boson case. The extra jets are coming mainly from the decay of heavy electroweak bosons. It is interesting that % of the multi-boson events have . In such a high jet multiplicity region the Standard Model background is extremely low.
The lepton multiplicities are compared in the bottom left panel of Fig. 2. As can be seen, the number of leptons in an event is much larger for the multi-boson process, since the extra leptons are produced in the decay of the heavy bosons. While only % of the zero-boson events have , this rate is % for the multi-boson events.
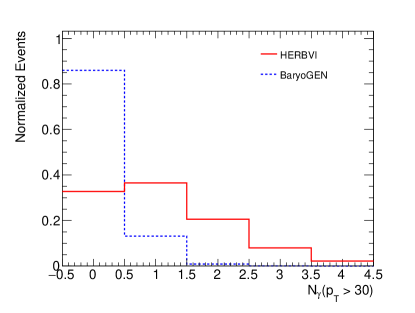
A large difference is also found in the photon multiplicity distributions, shown in the bottom right panel of Fig. 2. For the zero-boson events, photons are produced only from QED radiation or decays of hadrons, while for the multi-boson process, high- photons may be produced also from the primary hard interaction. For the zero-boson case, of events do not have any such photons and the probability of having more than one photon is extremely small (). On the other hand, the photon multiplicity distribution peaks around for the multi-boson case and has a tail towards the higher multiplicity region, . For example, the rate of having three high- photons is as large as .
4 Limits on sphaleron process
The CMS collaboration has recently carried out an analysis searching for mini black holes and sphalerons that could be produced by the 13 TeV proton-proton collisions at the LHC [42]. The dataset used was collected in 2016 and corresponds to an integrated luminosity of 35.9 fb-1. The events are recorded if they pass the trigger requirement of or 900 GeV, depending on the period when the data was collected, where is defined as the scalar sum of the of all jets reconstructed at the stage of the High Level Trigger.
The CMS analysis adopts a simple cut-and-count method. The cuts are imposed on the two variables, and , where is the number of all reconstructed objects (jets, leptons and photons) with GeV and is the scalar sum of the transverse momenta of all reconstructed objects with GeV including the missing transverse energy; , ( jets, leptons, photons and ).
The signal regions are labelled by (, ), where the events are counted if the conditions and are both satisfied. The following ranges were used for signal regions; and .
CMS performed a careful estimation of the Standard Model background. The dominant background comes from QCD multi-jets, followed by , and production. By comparing the number of observed events with the expected background contribution in each signal region, CMS estimated a model-independent 95% CL upper limit on the extra contribution to the signal region. We refer to this bound as , where labels the signal region in question. CMS also estimated the “expected” upper limit, , by assuming that exactly the same (fractional) number of events predicted by the background was observed.
Our procedure for setting limits is as follows. First, we estimate the contribution from sphaleron events to the signal region , , using the BaryoGEN or HERBVI Monte Carlo simulation. These signal contributions are then compared with the corresponding expected upper limits to identify the “most sensitive” signal region, , that gives the largest value for , i.e. . We then compare the signal contribution with the observed upper limit only at the most sensitive signal region. We exclude the signal hypothesis if .
| [TeV] | 8 | 8.5 | 9 | 9.5 | 10 | |
|---|---|---|---|---|---|---|
| (11, 4.2) | (11, 4.2) | (11, 4.2) | (11, 4.2) | (11, 4.2) | ||
| multi-boson | [%] | 94.8 | 97.5 | 99.2 | 99.6 | 99.9 |
| 3.0 | 3.0 | 3.0 | 3.0 | 3.0 | ||
| (9, 5.4) | (9, 5.6) | (9, 5.6) | (8, 6.2) | (8, 6.2) | ||
| Zero Boson | [%] | 37.7 | 40.5 | 45.3 | 50.5 | 57.5 |
| 6.9 | 5.8 | 5.8 | 3.0 | 3.0 | ||
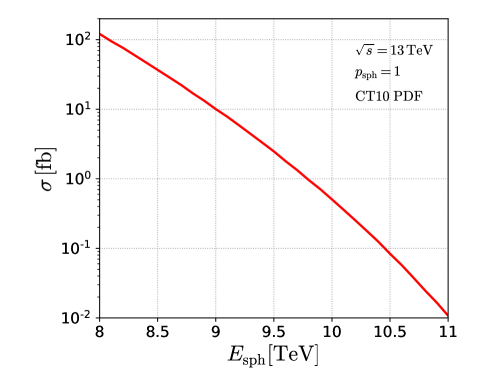
In Table 1, we show the most sensitive signal region (), the signal efficiency () at signal region , and the observed upper limit for signal region () for different values of the partonic threshold energy . The signal efficiency is defined as the fraction of events that satisfy the condition employed by the signal region. In particular, it satisfies the relation , where is the integrated luminosity and is the inclusive hadronic cross-section obtained by convoluting the partonic cross-section in Eq. (10) with the parton distribution functions (PDFs). In Fig. 3 we show the inclusive hadronic cross-section with in Eq. (10), where the CT10 LO PDF set [49] was used following the CMS analysis [42].
In Table 1, we see that , TeV is selected for the most sensitive signal region throughout the range of for the multi-boson case, whilst and are chosen for the most sensitive signal regions depending on for the zero-boson case. The tendency is clear that the multi-boson process favours the high multiplicity and small regions, while the zero-boson process prefers the low multiplicity and large regions in comparison.
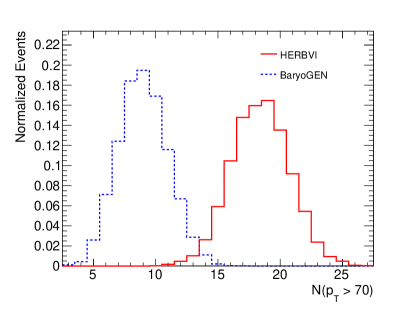
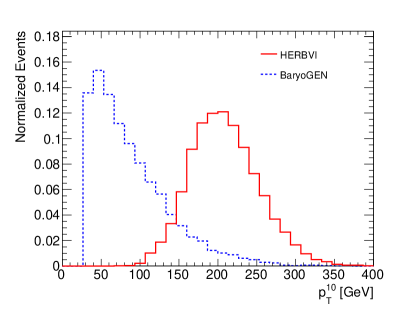
To understand this, we first look at the distributions shown in the left panel of Fig. 4. One can see that for the zero-boson case peaks around 8, which is significantly lower than the typical multiplicity of the primary partons, , produced from the hard interaction. In fact, only half of the events have . The reason for this may be understood as follows. Since the primary partons from the zero-boson process are only quarks and leptons, should be interpreted as the maximum of the distribution rather than the average. In fact, among partons at most three of them may be neutrinos, which will of course not be counted in . Furthermore, the threshold of 70 GeV may have a large impact on the lower objects. To see this we show the distributions of the 10th hardest object in the event in the right panel of Fig. 4. We see from this plot that the distribution for the zero-boson case peaks near the lowest bin, and only of the 10th hardest objects have GeV. This is not surprising because large differences in are expected between the hardest and softest primary objects. For the multi-boson case, this effect is much smaller because the event typically contains many more than 10 primary objects, and the difference in between the hardest and 10th hardest objects is milder.
As seen in the left panel of Fig. 4, the lower tail of barely reaches 11 for the multi-boson case. This means the the multi-boson signal need not pay any price for the condition , since CMS varies only up to 11 in their signal regions. In fact, the multi-boson signal efficiencies are always in the most sensitive signal region . The larger the , the lower the Standard Model background, and is therefore selected throughout in the most sensitive signal region for the multi-boson case.
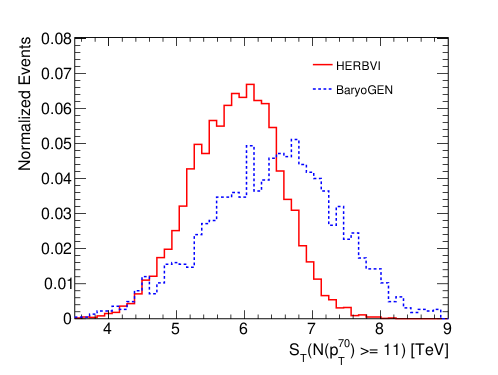
We now look at the distributions in Fig. 5 with . We see that the values of are generally quite high. The distribution peaks around 6 TeV for the multi-boson process and 7 TeV for the zero-boson one. This is expected because the variable is designed to reflect the total energy of the event, TeV. One can also see that is generally lower in the multi-boson case compared to the zero boson case. This is because more objects are rejected by the GeV cut. For the multi-boson process, the number of primary partons (including those produced from heavy boson decays) may be estimated as assuming and each boson decays into two partons. Therefore, the total event energy is distributed among partons, yielding a large chance for each one to be rejected by the GeV cut. However, the impact of this on is not very large. More than of the events are accepted by TeV for both zero- and multi-boson samples.
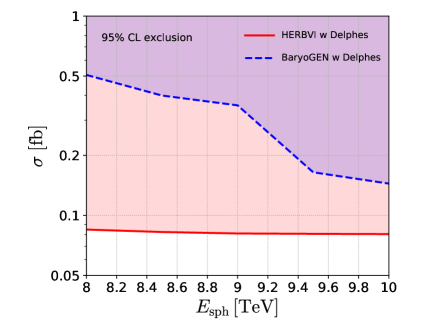
The left panel of Fig. 6 shows the CL exclusion limits in the ( vs ) plane. The limit, , is obtained from with fb-1. One can see that a stronger limit is placed on the multi-boson signal than on the zero-boson, although CMS targets the latter in their analysis. As discussed above, this is because the multi-boson processes give rise to larger multiplicity events, enabling one to go to a large region, where the Standard Model background is extremely small, without losing signal. The cross-section limit is given by fb throughout the range of in the plot for the multi-boson case. This can be seen also in Table 1, since the signal efficiency, , and the observed upper limit, , are almost independent of for this case. Since and are close to their highest and lowest values, respectively, there may be no room to further improve the limit for the multi-boson case, except by increasing the integrated luminosity or the collider energy.
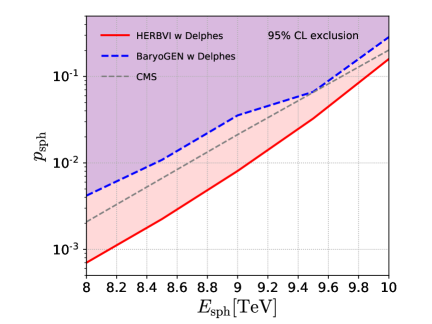
In the case of the zero-boson final state, the cross-section limit is stronger for larger , since the larger the , the higher the on average. On the other hand, the hadronic cross-section decreases rapidly upon increasing the partonic threshold energy, due to the PDF suppression for fixed . We show in the right panel of Fig. 6 the CL excluded regions in the ( vs ) plane. As expected the limit on is weaker for larger . We superimpose in this plot the limit shown in the CMS analysis [42]. This should be compared to the zero-boson limit obtained from our recasting of the analysis based on the fast detector simulation with Delphes. One can see that our limit is on the conservative side and reasonably close to the CMS limit.
5 Summary and conclusions
In this paper we compared various kinematical and multiplicity distributions between the anomalous violating processes with zero- and multi-boson final states. The former final state was assumed in the recent CMS analysis [42] on searching for instanton-induced processes at the LHC, whilst many theoretical studies suggest that the latter is more realistic.
We showed that there is a significant difference in jet multiplicity distributions; the peak positions are around 10 for zero-boson and 22 for multi-boson final states, for jets with GeV. We also found that a multi-boson event contains at least one lepton and photon with more than 50 % probability. On the other hand, the variable tends to be smaller for the multi-boson final state because a large number of jets are rejected by the somewhat harsh cut ( GeV) employed by the CMS analysis.
By applying the same event selection used in the CMS analysis [42], we have derived a cross-section upper limit, fb, on the multi-boson processes within the region we considered, . We found that unlike the zero-boson case, the most sensitive signal region is identified as the one with the highest jet multiplicity bins (), in which the SM background is extremely low and less than 1 event for the current integrated luminosity, 35.9 fb-1, while the signal efficiency is very close to 100%. Therefore, this signal region almost maximizes the analysis efficiency in terms of and further improvement cannot be expected within the current dataset. On the other hand, by employing even larger jet multiplicity bins, e.g. , one can expect some improvement on the analysis searching for the sphaleron-like process with multi-boson final states, for different energy or luminosity options.
Acknowledgments.
We thank Greg Landsberg for helpful comments. The work of KS is partially supported by the National Science Centre, Poland, under research grants 2017/26/E/ST2/00135 and DEC-2016/23/G/ST2/04301. The work of BRW is partially supported by U.K. STFC consolidated grant ST/P000681/1. KS and BRW are grateful for the hospitality of Kavli IPMU and the 4th Kavli IPMU-Durham IPPP-KEK-KIAS workshop “Beyond the BSM”, while part of this work was performed. Kavli IPMU is supported by the World Premier International Research Center Initiative (WPI Initiative), MEXT, Japan.References
- [1] S. L. Adler, Axial vector vertex in spinor electrodynamics, Phys. Rev. 177 (1969) 2426–2438.
- [2] J. S. Bell and R. Jackiw, A PCAC puzzle: in the model, Nuovo Cim. A60 (1969) 47–61.
- [3] W. A. Bardeen, Anomalous Ward identities in spinor field theories, Phys. Rev. 184 (1969) 1848–1857.
- [4] G. ’t Hooft, Symmetry Breaking Through Bell-Jackiw Anomalies, Phys. Rev. Lett. 37 (1976) 8–11.
- [5] G. ’t Hooft, Computation of the Quantum Effects Due to a Four-Dimensional Pseudoparticle, Phys. Rev. D14 (1976) 3432–3450.
- [6] A. A. Belavin, A. M. Polyakov, A. S. Schwartz and Yu. S. Tyupkin, Pseudoparticle Solutions of the Yang-Mills Equations, Phys. Lett. B59 (1975) 85–87.
- [7] I. Affleck, On Constrained Instantons, Nucl. Phys. B191 (1981) 429.
- [8] V. A. Kuzmin, V. A. Rubakov and M. E. Shaposhnikov, On the Anomalous Electroweak Baryon Number Nonconservation in the Early Universe, Phys. Lett. 155B (1985) 36.
- [9] P. B. Arnold and L. D. McLerran, Sphalerons, Small Fluctuations and Baryon Number Violation in Electroweak Theory, Phys. Rev. D36 (1987) 581.
- [10] A. Ringwald, Rate of Anomalous Baryon and Lepton Number Violation at Finite Temperature in Standard Electroweak Theory, Phys. Lett. B201 (1988) 510–516.
- [11] V. A. Rubakov and M. E. Shaposhnikov, Electroweak baryon number nonconservation in the early universe and in high-energy collisions, Usp. Fiz. Nauk 166 (1996) 493–537, [hep-ph/9603208].
- [12] A. Ringwald, High-Energy Breakdown of Perturbation Theory in the Electroweak Instanton Sector, Nucl. Phys. B330 (1990) 1–18.
- [13] O. Espinosa, High-Energy Behavior of Baryon and Lepton Number Violating Scattering Amplitudes and Breakdown of Unitarity in the Standard Model, Nucl. Phys. B343 (1990) 310–340.
- [14] M. P. Mattis, The Riddle of high-energy baryon number violation, Phys. Rept. 214 (1992) 159–221.
- [15] P. G. Tinyakov, Instanton like transitions in high-energy collisions, Int. J. Mod. Phys. A8 (1993) 1823–1886.
- [16] N. S. Manton, Topology in the Weinberg-Salam Theory, Phys. Rev. D28 (1983) 2019.
- [17] F. R. Klinkhamer and N. S. Manton, A Saddle Point Solution in the Weinberg-Salam Theory, Phys. Rev. D30 (1984) 2212.
- [18] S. Yu. Khlebnikov, V. A. Rubakov and P. G. Tinyakov, Instanton induced cross-sections below the sphaleron, Nucl. Phys. B350 (1991) 441–473.
- [19] V. V. Khoze and A. Ringwald, Total cross-section for anomalous fermion number violation via dispersion relation, Nucl. Phys. B355 (1991) 351–368.
- [20] A. H. Mueller, On higher order semiclassical corrections to high-energy cross-sections in the one instanton sector, Nucl. Phys. B364 (1991) 109–126.
- [21] D. Diakonov and M. V. Polyakov, Baryon number nonconservation at high-energies and instanton interactions, Nucl. Phys. B389 (1993) 109–132.
- [22] I. Balitsky and A. Schafer, Valley method versus instanton induced effective Lagrangian up to (E / E(sphaleron))**8/3, Nucl. Phys. B404 (1993) 639–683, [hep-ph/9304261].
- [23] A. Ringwald, Electroweak instantons / sphalerons at VLHC?, Phys. Lett. B555 (2003) 227–237, [hep-ph/0212099].
- [24] V. I. Zakharov, Classical corrections to instanton induced interactions, Nucl. Phys. B371 (1992) 637–658.
- [25] H. Aoyama and H. Goldberg, Anomalous Baryon Number Nonconservation in p p Collisions at 40-TeV, Phys. Lett. B188 (1987) 506–510.
- [26] M. J. Gibbs and B. R. Webber, HERBVI: A Program for simulation of baryon and lepton number violating processes, Comput. Phys. Commun. 90 (1995) 369–380, [hep-ph/9504232].
- [27] M. J. Gibbs, A. Ringwald, B. R. Webber and J. T. Zadrozny, Monte Carlo simulation of baryon and lepton number violating processes at high-energies, Z. Phys. C66 (1995) 285–302, [hep-ph/9406266].
- [28] S. Moch, A. Ringwald and F. Schrempp, Instantons in deep inelastic scattering: The Simplest process, Nucl. Phys. B507 (1997) 134–156, [hep-ph/9609445].
- [29] A. Ringwald and F. Schrempp, Instanton induced cross-sections in deep inelastic scattering, Phys. Lett. B438 (1998) 217–228, [hep-ph/9806528].
- [30] A. Ringwald and F. Schrempp, QCDINS 2.0: A Monte Carlo generator for instanton induced processes in deep inelastic scattering, Comput. Phys. Commun. 132 (2000) 267–305, [hep-ph/9911516].
- [31] H1 collaboration, C. Adloff et al., Search for QCD instanton induced processes in deep inelastic scattering at HERA, Eur. Phys. J. C25 (2002) 495–509, [hep-ex/0205078].
- [32] ZEUS collaboration, S. Chekanov et al., Search for QCD instanton induced events in deep inelastic ep scattering at HERA, Eur. Phys. J. C34 (2004) 255–265, [hep-ex/0312048].
- [33] H1 collaboration, V. Andreev et al., Search for QCD instanton-induced processes at HERA in the high- domain, Eur. Phys. J. C76 (2016) 381, [1603.05567].
- [34] S. H. H. Tye and S. S. C. Wong, Bloch Wave Function for the Periodic Sphaleron Potential and Unsuppressed Baryon and Lepton Number Violating Processes, Phys. Rev. D92 (2015) 045005, [1505.03690].
- [35] J. Ellis and K. Sakurai, Search for Sphalerons in Proton-Proton Collisions, JHEP 04 (2016) 086, [1601.03654].
- [36] G. Brooijmans, P. Schichtel and M. Spannowsky, Cosmic ray air showers from sphalerons, Phys. Lett. B761 (2016) 213–218, [1602.00647].
- [37] J. Ellis, K. Sakurai and M. Spannowsky, Search for Sphalerons: IceCube vs. LHC, JHEP 05 (2016) 085, [1603.06573].
- [38] M. Spannowsky and C. Tamarit, Sphalerons in composite and non-standard Higgs models, Phys. Rev. D95 (2017) 015006, [1611.05466].
- [39] K. Funakubo, K. Fuyuto and E. Senaha, Does a band structure affect sphaleron processes?, 1612.05431.
- [40] D. G. Cerdeño, P. Reimitz, K. Sakurai and C. Tamarit, violation at colliders and new physics, JHEP 04 (2018) 076, [1801.03492].
- [41] Y. Jho and S. C. Park, Constraining New Physics with High Multiplicity : I. Ultra-High Energy Cosmic Rays on air-shower detector arrays, 1806.03063.
- [42] CMS collaboration, A. M. Sirunyan et al., Search for black holes and sphalerons in high-multiplicity final states in proton-proton collisions at 13 TeV, 1805.06013.
- [43] C. Bravo and J. Hauser, BaryoGEN, a Monte Carlo Generator for Sphaleron-Like Transitions in Proton-Proton Collisions, 1805.02786.
- [44] A. Ringwald, F. Schrempp and C. Wetterich, Phenomenology of geometrical flavor interactions at TeV energies, Nucl. Phys. B365 (1991) 3–23.
- [45] T. Sjöstrand, S. Ask, J. R. Christiansen, R. Corke, N. Desai, P. Ilten et al., An Introduction to PYTHIA 8.2, Comput. Phys. Commun. 191 (2015) 159–177, [1410.3012].
- [46] G. Corcella, I. G. Knowles, G. Marchesini, S. Moretti, K. Odagiri, P. Richardson et al., HERWIG 6: An Event generator for hadron emission reactions with interfering gluons (including supersymmetric processes), JHEP 01 (2001) 010, [hep-ph/0011363].
- [47] G. Corcella, I. G. Knowles, G. Marchesini, S. Moretti, K. Odagiri, P. Richardson et al., HERWIG 6.5 release note, hep-ph/0210213.
- [48] DELPHES 3 collaboration, J. de Favereau, C. Delaere, P. Demin, A. Giammanco, V. Lemaître, A. Mertens et al., DELPHES 3, A modular framework for fast simulation of a generic collider experiment, JHEP 02 (2014) 057, [1307.6346].
- [49] H.-L. Lai, M. Guzzi, J. Huston, Z. Li, P. M. Nadolsky, J. Pumplin et al., New parton distributions for collider physics, Phys. Rev. D82 (2010) 074024, [1007.2241].