Evolved stars in the Local Group galaxies - III. AGB and RSG stars in Sextans A
Abstract
We study the evolved stellar population of the galaxy Sextans A. This galaxy is one of the lowest metallicity dwarfs in which variable asymptotic giant branch stars have been detected, suggesting that little metal enrichment took place during the past history. The analysis consists in the characterization of a sample of evolved stars, based on evolutionary tracks of asymptotic giant branch and red super giant stars, which include the description of dust formation in their winds. Use of mid-infrared and near-infrared data allowed us to identify carbon-rich sources, stars undergoing hot bottom burning and red super giants. The dust production rate, estimated as yr, is dominated by carbon stars, with a small contribution of higher mass M-stars, of the order of yr. The importance of this study to understand how dust production works in metal-poor environments is also evaluated.
keywords:
Stars: abundances – Stars: AGB and post-AGB1 Introduction
The research focused on the evolutionary properties of evolved stars have recently received a renewed interest to inspect their impact on the life cycle of their host galaxy. The DUSTiNGS survey (Boyer et al., 2015a) represents a crucial tool for this scope. Specifically designed to identify stars evolving through the Asymptotic Giant Branch (AGB) and massive stars in the core helium-burning phase, this survey provided [3.6] and [4.5] magnitudes data collected with the IRAC camera mounted onboard of the Spitzer Space Telescope, for thousands of stars distributed among 50 dwarf galaxies within 1.5 Mpc.
The analysis of these data will allow to extend to the galaxies in the Local Group (LG) the studies aimed at the interpretation of IR observations of stellar populations, so far limited to the Magellanic Clouds (MC). This will allow testing our understanding of the late evolutionary phases to different environments, given the diversity in terms of structural properties and star formation histories which characterizes LG galaxies.
An important issue regarding the feedback from these stars on the host system is the dust formed in the circumstellar envelope and ejected into the interstellar medium. This is crucial to study the dust evolution in galaxies of the LG (Dwek, 1998; Calura et al., 2008; Schneider et al., 2014) and for a series of still open points in modern Astrophysics, such as the interpretation of the spectral energy distribution (SED) of high-redshift quasars (Bertoldi, 2003; Wang et al., 2013) and the possible explanations of the presence of dust at early epochs (Valiante et al., 2011; Pipino et al., 2011). On this regard, the key quantity is the evolution of the dust production rate (DPR) of the stars during their life, i.e. the mass of dust produced per unit time in a given evolutionary stage.
The studies aimed at understanding the dust formation process in the winds of AGB stars have made significant steps forward in the recent years, when the codes used to model the AGB evolution were complemented with the equations governing the formation and growth of dust particles (Ventura et al., 2012a, b, 2014; Nanni et al., 2013, 2014).
This allowed the study of the evolved stellar populations of the MCs, characterizing the individual sources observed in terms of mass, chemical composition, formation epoch and DPR (Dell’Agli et al., 2014, 2015a, 2015b; Nanni et al., 2016, 2018). To this purpose, the Spitzer mid-IR data were compared with the results from stellar evolution + dust formation modelling. The same approach was recently extended to IC 1613 (Dell’Agli et al., 2016) and IC 10 (Dell’Agli et al., 2018). The latter studies showed that the lack of , and data in the DUSTiNGS survey can be partly compensated by considering at the same time the and fluxes with near infrared (NIR) observations, providing J-H-K photometry.
The introduction of this new methodology to investigate the evolutionary properties and the mechanisms of dust production by stars evolving through the final stages is of paramount importance, as it represents an alternative and complementary approach to the studies which interpret the IR data with synthetic spectra (see e.g. Srinivasan et al., 2009, 2010, 2011; Boyer et al., 2011; Sargent et al., 2011; McDonald et al., 2012; Boyer et al., 2015c; Kraemer et al., 2017; McDonald et al., 2017). The comparison among the results obtained with the two different methods offers a valuable opportunity to understand the robustness and the weakness of either approaches, and to a more reliable characterization of the stellar populations investigated.
In this paper we study the evolved stellar population of Sextans A, following the same approach that we adopted for IC 1613 and IC10 by Dell’Agli et al. (2016, 2018). Sextans A is a very peculiar, metal-poor dwarf galaxy (, Dolphin et al. 2003), with a main stellar component, formed between 1 and 2.5 Gyr ago (Weisz et al., 2014), and a younger population, formed during the burst in the star formation history, which occurred over the past 60 Myr (Camacho et al., 2016). This galaxy is extremely interesting, because it was exposed to little (or no) metal enrichment during the last 10 Gyr: it is one of the lowest metallicity objects harbouring variable AGB stars (Boyer et al., 2015c; McQuinn et al., 2017). The study is of paramount importance to understand how dust production works in metal-poor environments and, more generally, to clarify whether stars of intermediate mass might play any role in the production of the large amounts of dust observed at high redshift (Gobat et al., 2018).
This work is extremely timely, considering that the mid-IR data of Sextans A stars obtained by DUSTiNGS have been recently completed by near-IR observations by Jones et al. (2018), who present a wide exploration of the stellar population of this galaxy, with the determination of the individual and global DPR. The study of this galaxy proves extremely important to test the dust formation theories in metal-poor stars and, on a more general side, to assess the reliability of the classification of evolved stars based on a multiwavelength approach and the DPR estimates based on SED fitting.
The paper is structured as follows: the sample of Sextans A stars used in the present work is described in section 2; the codes used to model the evolution of AGB and RSG stars and the dust formation process are described in section 3; in section 4 we discuss the main evolutionary and chemical properties of the evolved stars of Sextans A; section 5 is devoted to the characterization of the sources in the Jones et al. (2018) sample, whereas in section 6 we discuss the DPR of the individual stars and the global DPR of the galaxy; the effects of a possible metallicity spread of the evolved stars are discussed in section 7; the conclusions are given in section 8.
2 IR observations of Sextans A
To describe the evolved stellar populations of Sextans A we compare results from stellar evolution computations with the near IR observations presented recently by Jones et al. (2018). The Jones et al. (2018) sample is made up of 492 stars, for which JHK photometry was obtained during two observing runs, using the WIYN High-resolution Infrared Camera mounted on the m WIYN telescope, at the Kitt Peak National Observatory. The selected objects are located in the inner region of Sextans A. This sample is particularly suitable to the main goal of the present work, because most of the sources with poor signal-to-noise ratio were excluded via a cut on the error. In addition, for a source to be maintained in the catalogue, it was required that it was detected in two bands (299 objects) or at two epochs with high confidence. In general, if a source was detected over multiple epochs, the catalogue reports the mean flux for the combined epoch. The completeness of the sample is limited by the distance to Sextans A and the weather conditions when the observations were taken. In the band the hystogram of the number of sources becomes zero at magnitudes fainter than , about half magnitude brigther the tip of RGB.
In order to fully investigate the nature of the dusty sources, the WHIRC near-IR catalogue was matched with the DUSTING catalogue (Boyer et al., 2015a), adopting a matching distance of ; we found 272 objects, 9 out of which were identified as AGB variable stars by Boyer et al. (2015b). Stars were classified as O- or C-rich stars according to the colors cut criteria used by Cioni et al. (2006) and Boyer et al. (2011) in the versus CMD. They also identified dusty AGB stars as those with mag or mag (Blum et al., 2006; Boyer et al., 2011). To determine the dust production rate (hereafter DPR), they fit the broadband spectral energy distribution with the grid of GRAMS radiative-transfer models (Sargent et al., 2011; Srinivasan et al., 2011).
3 AGB and RSG modelling
Considering the low metallicity of stars in Sextans A (Dolphin et al., 2003), we mostly base our analysis on models of stars with mass in the range and metallicity , calculated with the ATON code for stellar evolution (Ventura et al., 1998)111 corresponds to with the enhancement used here, namely . The evolutionary sequences were started from the pre-main sequence and followed until the final AGB stages, when the convective envelope was almost entirely consumed.
An exhaustive discussion of the numerical structure of the code ATON, with all the micro-physics input used, can be found in Ventura et al. (1998); the latest updates are given in Ventura & D’Antona (2009). The choices regarding the macro-physics adopted, particularly for what attains the description of the convective instability, are given in Dell’Agli et al. (2016).
Regarding the description of mass loss, for oxygen-rich stars we use the Blöcker (1995) treatment, according to which ; the parameter entering the Blöcker (1995)’s recipe is set to , following the calibration given in Ventura et al. (2000). For carbon stars we used the description of mass loss from the Berlin group (Wachter et al., 2002, 2008).
To describe dust production for these stars, we apply the description of the wind of AGB stars proposed by the Heidelberg group (Ferrarotti & Gail, 2006), which allows to determine the size of the solid particles formed in the circumstellar envelope, for the various dust species considered: based on thermal stability arguments, we consider formation of silicates and alumina dust in the case of M stars, whereas we assume that solid carbon and silicon carbide are the main species produced in the wind of carbon stars.
| (Myr) | (kyr) | NTP | X(C) | X(O) | |||||
|---|---|---|---|---|---|---|---|---|---|
| 0.9 | 8000 | 1100 | 3 | 3.0 | 0.51 | 7.9e-5 | 5.7e-4 | - | 0.0 |
| 1.0 | 5500 | 1750 | 5 | 4.6 | 0.52 | 5.6e-4 | 6.0e-4 | 7.09 | 0.011 |
| 1.1 | 3900 | 1560 | 6 | 5.4 | 0.52 | 3.8e-3 | 8.7e-4 | 8.54 | 0.058 |
| 1.25 | 2500 | 1570 | 8 | 6.0 | 0.53 | 3.7e-3 | 1.0e-3 | 8.51 | 0.065 |
| 1.3 | 2200 | 1590 | 8 | 6.5 | 0.53 | 6.6e-3 | 1.3e-3 | 8.79 | 0.096 |
| 1.5 | 1450 | 1600 | 9 | 8.0 | 0.54 | 1.5e-2 | 2.2e-3 | 9.17 | 0.15 |
| 1.75 | 980 | 1350 | 11 | 10 | 0.56 | 1.6e-2 | 4.2e-3 | 9.15 | 0.26 |
| 2.0 | 700 | 2000 | 17 | 11 | 0.56 | 2.5e-2 | 2.5e-3 | 9.41 | 0.54 |
| 2.25 | 530 | 1380 | 18 | 13 | 0.60 | 2.1e-2 | 1.0e-2 | 9.18 | 0.55 |
| 2.5 | 410 | 860 | 18 | 15 | 0.66 | 1.6e-2 | 4.2e-3 | 9.15 | 0.56 |
| 3.0 | 270 | 330 | 25 | 25 | 0.79 | 2.6e-3 | 1.6e-3 | 8.19 | 0.43 |
| 3.5 | 197 | 300 | 29 | 31 | 0.81 | 3.8e-4 | 9.2e-4 | - | 0.37 |
| 4.0 | 142 | 230 | 36 | 40 | 0.85 | 2.1e-4 | 3.9e-4 | - | 0.56 |
| 4.5 | 112 | 170 | 38 | 48 | 0.88 | 1.0e-4 | 2.2e-4 | - | 0.59 |
| 5.0 | 90 | 126 | 42 | 57 | 0.92 | 1.0e-4 | 3.7e-4 | - | 0.64 |
| 5.5 | 74 | 59 | 31 | 70 | 0.97 | 2.0e-5 | 1.5e-5 | - | 1.3 |
| 6.0 | 62 | 45 | 38 | 89 | 1.02 | 1.6e-5 | 1.1e-5 | - | 1.68 |
| 6.5 | 53 | 40 | 31 | 107 | 1.12 | 1.9e-5 | 2.7e-5 | - | 1.69 |
| 7.0 | 47 | 17 | 28 | 121 | 1.19 | 2.0e-5 | 4.1e-5 | - | 1.695 |
| 7.5 | 41 | 11 | 21 | 150 | 1.28 | 2.4e-5 | 1.6e-4 | - | 1.71 |
To calculate the dust produced by the stars during their life, we consider several points selected during the AGB phase and we model dust formation on the basis of the corresponding values of mass, mass loss rate, luminosity, effective temperature and the surface chemical composition. This is the method which we used in a series of papers (Ventura et al., 2012a, b, 2014), to calculate the dust expected from AGB stars.
Finally, the knowledge of the aforementioned physical quantities and of the kind and size of the dust particles formed allow the calculation of the synthetic spectra and the determination of the IR fluxes; for the latter step we use the code DUSTY (Nenkova et al., 1999).
Consistently with the previous works on this argument, we will quantify the degree of obscuration of the stars by the optical depth at m, , which is determined by the radial distribution of the dust particles in the surroundings of the star (see Section 2.3 in Dell’Agli et al. 2015a).
The interpretation of the observations in the colour-magnitude diagrams must consider the presence of RSG stars, evolving through the core helium-burning phase. For the stars with mass we considered the models discussed above, calculated with the ATON code. For higher mass stars we considered stellar models of metallicity , calculated by means of the rotating version of the FRANEC code222Note that the FRANEC models are available for , , , (the interested reader is referred to Chieffi & Limongi (2013) for more details).
4 Stars evolving in Sextans A: physical and chemical properties
The vast majority of the evolved stellar population of Sextans A is composed by stars evolving through the AGB phase, the progeny of stars with mass in the range . Stars with mass above undergo core collapse, thus they do not experience the AGB phase. We will not consider stars of mass below , because, independently of the description of mass loss during the red giant branch (RGB) phase, these stars will never evolve at luminosities above the tip of the RGB and will not produce any kind of dust. For the reasons discussed in the previous sections, we focus on a metal-poor chemical composition, with metallicity , though a little spread in cannot be excluded. We will explore this possibility in section 7.
The properties of AGB stars are described in excellent reviews on the argument. The interested reader is addressed to the works by Busso et al. (1999), Herwig (2005), Karakas & Lattanzio (2014) for a thorough discussion of the main physical mechanisms affecting the AGB evolution, the processes able to alter the internal and the surface chemical composition and the most relevant uncertainties in the micro- and macro-physics input adopted.
Tab. LABEL:tabmod reports the main properties of the models used here. The luminosity experienced during the AGB phase, reported in col. 5, increases with the initial mass of the star, because the higher the mass the higher the core mass at the beginning of the AGB phase (see col. 6). This is the reason why the overall duration of the AGB phase, reported in col. 3, gets shorter for larger values of the initial mass. The number of thermal pulses (TP) experienced first increases with the initial mass, because higher mass stars loose the envelope after a higher number of TP; this trend is reversed for stars of mass above , because in this mass domain the rate of mass loss becomes so large to favour a fast loss of the envelope, with a smaller number of TP.
4.1 The surface chemical composition
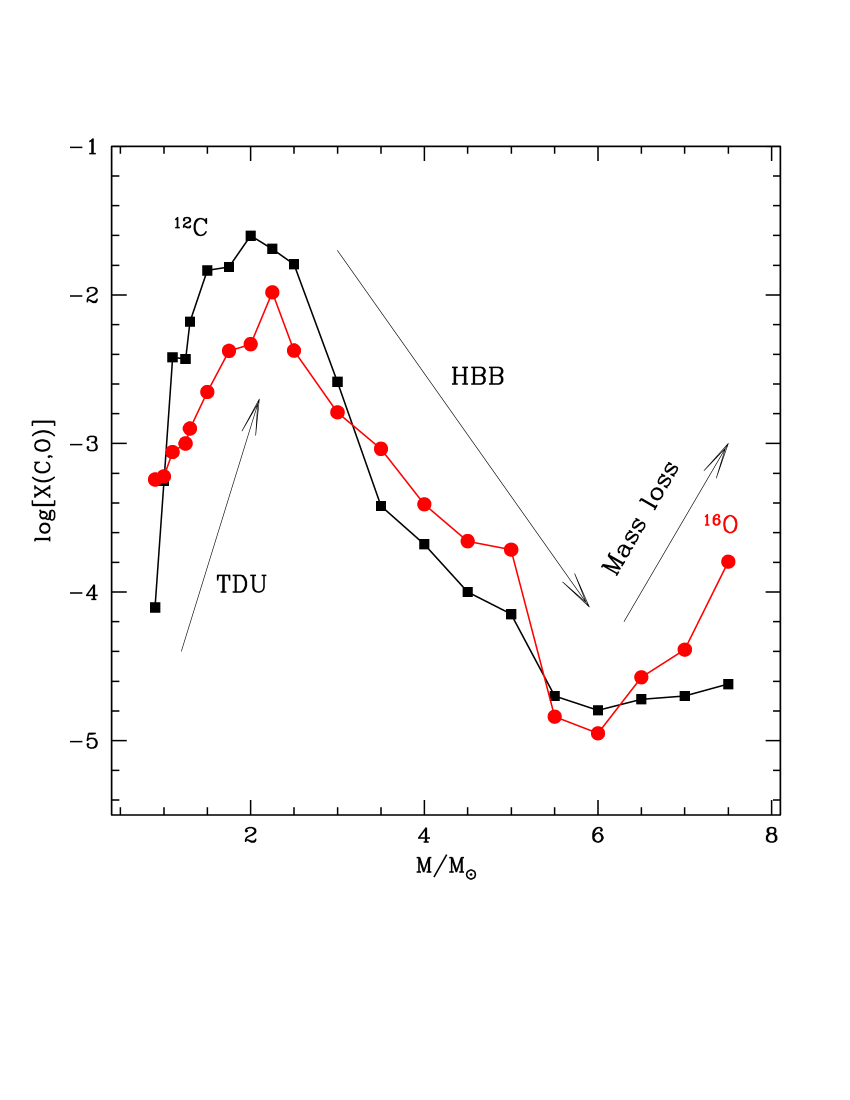
An important point for the present work is the modification of the surface chemical composition as the stars evolve through the AGB. The left panel of Fig. 1 shows the surface abundances of carbon and oxygen at the end of the AGB phase, as a function of the initial mass. It is clear in the figure the different behaviour followed by stars of different mass:
-
1.
For stars of mass below the only mechanism active in changing the surface chemical composition is third dregde-up (hereafter TDU), which favours a significant enrichment in the surface carbon and a small increase in the oxygen content; eventually carbon replaces oxygen as the dominant species in the envelope, making the star to become a carbon star. Fig. 1 shows that the carbon enhancement increases with the stellar mass in this mass domain, because the higher the initial mass the higher the number of TDU episodes experienced (see col. 4 in Tab. LABEL:tabmod). This trend changes when the mass approaches the upper limit of the stars which attain the C-star stage.
-
2.
The stars of mass experience hot bottom burning (HBB) during the AGB phase (Renzini & Voli, 1981; Blöcker & Schönberner, 1991). The base of the convective envelope is exposed to severe p-capture nucleosynthesis, which destroys the surface carbon and, in metal poor environments, also the oxygen nuclei. The final carbon and oxygen mass fractions shown in Fig. 1 decrease with the initial mass of the star, because models of higher mass evolve on more massive cores and suffer a stronger HBB nucleosynthesis (Ventura & D’Antona, 2009). The final oxygen in the models of mass above is higher than in their lower mass counterparts, because mass loss is so fast that the envelope is lost before a very advanced degree of nucleosynthesis is reached (Ventura & D’Antona, 2011).

4.2 Dust production
Understanding the surface chemistry variation of AGB stars proves important for the dust formed in their circumstellar envelope and ejected into their surroundings. The results shown in the left panel of Fig. 1 allow us to deduce the main dust species formed for stars of different mass. The main argument here is that the CO molecule is extremely stable: in C-rich environments no dust species which include oxygen particles can be formed, whereas in oxygen-rich envelopes there are no C-bearing molecules to form carbonaceous grains (Ferrarotti & Gail, 2006). Therefore, we find that low-mass stars produces mainly carbon dust, whereas the stars experiencing HBB form only silicates and alumina dust. The behaviour of the dust formed with the initial mass of the stars is thoroughly discussed in Ventura et al. (2014).
The right panel of Fig. 1 shows the quantit of dust produced by the AGB models used in the present investigation; the quantity reported on the y-axis is the maximum optical depth (at m) reached during the AGB phase, which is sensitive to the radial distribution and the size of the dust grains present in the circumstellar envelope.
In the low-mass domain () increases with the initial mass of the star. This is not surprising, based on the behaviour of the surface carbon, shown in the left panel of Fig. 1: models of higher mass accumulate a larger amount of carbon in the surface regions, which favours a faster growth of the newly formed solid carbon particles, hence higher values of . The largest are reached during the very final AGB phases, when the surface carbon is largest (Dell’Agli et al., 2015a; Ventura et al., 2016b). The contribution of SiC to the overall dust produced can be neglected: for this metallicity the fraction of silicon in the envelope is so small that the amount of SiC is a factor of 10 or more smaller than solid carbon (Ventura et al., 2014).
For the stars experiencing HBB (), the dust formed is under the form of silicates and alumina dust (Al2O3). The latter species is very stable and forms in a more internal region of the circumstellar envelope ( stellar radii form the surface) compared to silicates ( stellar radii). On the other hand, the amount of aluminium in the star is much smaller than silicon and Al2O3 is extremely transparent to the electromagnetic radiation: therefore, we may safely assume that the reprocessing of the radiation is exclusively due to silicate particles (Dell’Agli et al., 2014).
These stars attain extremely large luminosities and experience high rates of mass loss: these conditions prove extremely favourable to the formation and growth of dust particles, because large mass loss rates favour the formation of extremely dense winds, with a larger availability of gas molecules to form dust. Fig. 1 shows that increases with the mass of the star, because stars of higher mass evolve at larger luminosities (see Tab. LABEL:tabmod) and suffer very strong mass loss, with rates above yr.
Before discussing how dust production affects the colours of evolved M-star in the observational planes, we believe important to stress here that the above results, concerning the formation of silicates, are based on the simplified model for the growth of dust particles, described in section 3. This model assumes that the wind is stationary and, more important, the rate of mass loss is assumed a priori, thus independent of dust formation. This is the only possible approach within the current modelling of dust from AGB stars, if coupling with an evolutionary description is required. Detailed hydrodynamical simulations showed that silicate particles formed at the distances from the surface of the star found in the present work can hardly drive a wind (Höfner, 2008; Bladh & Höfner, 2012). These results refer to solar mass stars though, thus the extension to the case of the massive AGB stars discussed here, evolving at mach higher luminosities, is not straightforward. In the present analysis we find that the radiative push exceeds the gravitational pull and is sufficient to accelerate the wind, up to velocities in the range Km/s. However, the incoming hydrodynamical models, with mass in the range of interest here, will definitely clarify whether the conditions to radiatively drive a wind are shared by the present models.
4.3 Evolutionary tracks in the observational planes
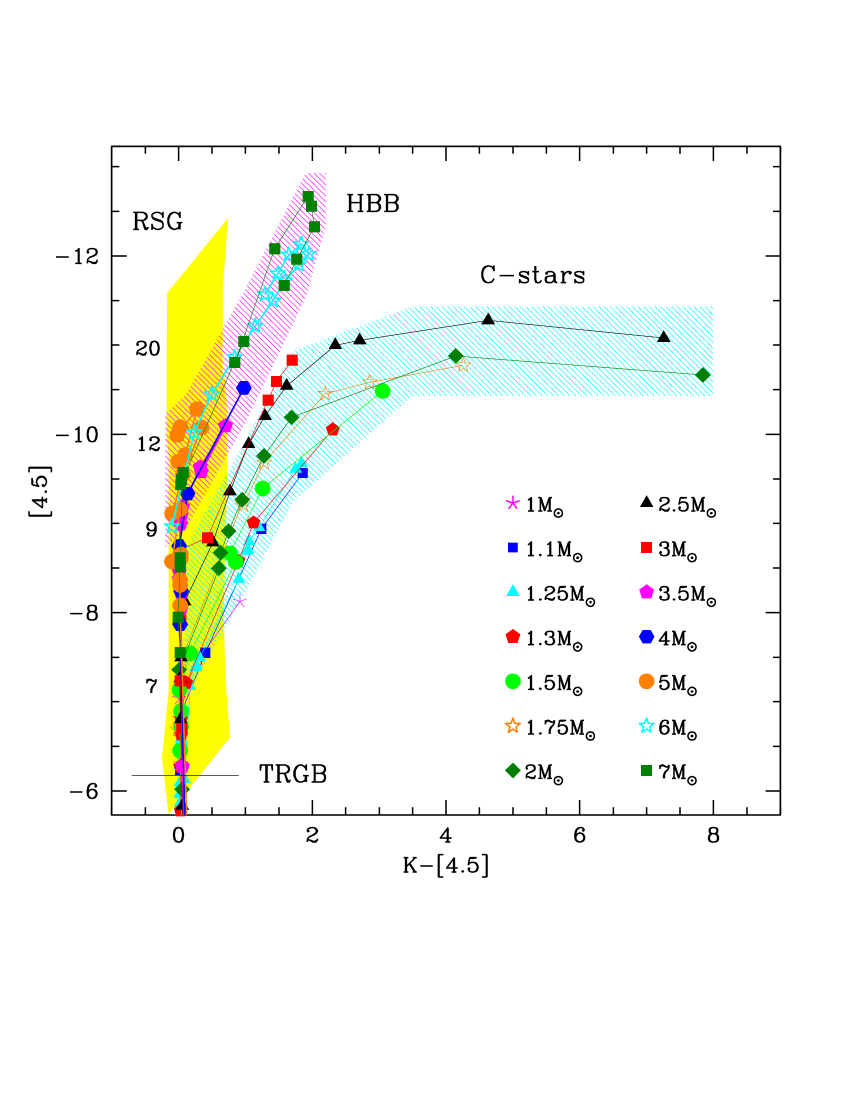
Fig. 2 shows the evolutionary tracks of the AGB models used in the present analysis, in the colour-magnitude and planes (hereafter CMD1 and CMD2, respectively).
Low mass stars () increase the degree of obscuration as they evolve through the AGB, owing to the gradual accumulation of carbon in the surface regions. In the CMD1 the evolutionary tracks first move to the red, following a diagonal path, with higher and higher fluxes. This behaviour holds as far as . For redder colours the tracks flatten, because the peak in the SED gets close and eventually overcomes the wavelengths covered by the filter (see e.g. Fig. 6 in Dell’Agli et al., 2015a), thus no further increase in the flux occurs.
Carbon stars populate the region in the CMD1, highlighted with a cyan shading in the left panel of Fig. 2, which extends to . Only stars of initial mass are expected to reach colours , in agreement with the earlier discussion and the results shown in Fig. 1. Regarding the region , we expect for a given () a spread in of approximately 1 mag, with the stars of higher mass being brighter.
Stars of initial mass reach larger luminosities during the AGB phase (see Tab. LABEL:tabmod), thus the evolutionary tracks lay above those corresponding to their smaller mass counterparts. The obscuration sequence of these stars, indicated with a magenta box in Fig. 2, extends to , and is separated by the C-star zone. Only massive AGB stars of initial mass above are expected to evolve to the red side of the CMD1, because for lower masses, considering that we are discussing metal-poor chemistries, little dust production takes place in the envelope; this is consistent with the drop in the values of below , shown in the right panel of Fig. 1. While in C-stars the main factor affecting dust formation (and the consequent reddening of the evolutionary track) is the increase in the surface carbon (Ventura et al., 2016b), in this case significant amounts of dust are formed under strong HBB conditions, which favour large rates of mass loss (Ventura et al., 2015).
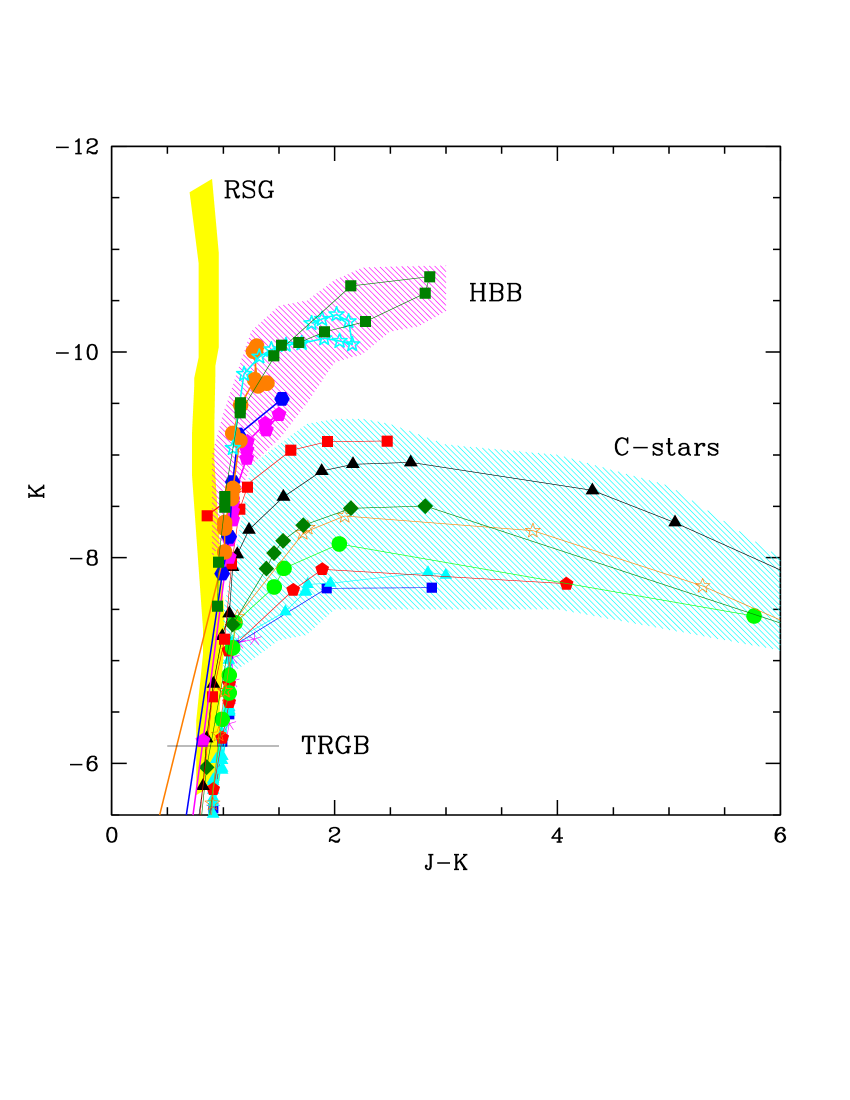
The evolutionary paths in the CMD2, shown in the right panel of Fig. 2, are qualitatively similar to the tracks in CMD1. The obscuration sequence of carbon stars is more extended in this case, because the flux gets extremely faint in the most advanced evolutionary phases, when the radiation is reprocessed by solid carbon particles in the circumstellar envelope. The higher sensitivity of to the optical depth might suggest that the CMD2 plane is suitable to study the obscured stars; however, the almost null values of the flux makes extremely hard to predict for these objects and it is common that the flux in the band is not available for the majority of them. This is the reason why CMD1 proves more useful to study the stars with the largest degree of obscuration.
On the other hand the analysis of the position of the stars on CMD2 is extremely useful to study the phases following the achievement of the C-star stage, because the colour is more sensitive to the optical depth when the degree of obscuration is small, compared to . The same holds for the study of the stars experiencing HBB.
Regarding the stars experiencing HBB, their position on CMD2 proves particular useful in this case, because, the optical depths reached are generally small, owing to the low metallicity, and the colour is more sensitive to for low degree of obscurations. Indeed we see in Fig. 2 that all the tracks of stars attain colours at least mag redder than the unobscured stars; conversely, on the CMD1 only the very massive AGB stars reach an appreciable degree of obscuration, during the phases with the strongest HBB.
In the CMD1 and CMD2 planes shown in Fig. 2 we highlight with a yellow shading the RSG regions, i.e. the zones where stars of mass in the range evolve during the core He-burning phase. In the left panel we also indicate the position of the stars of a given mass on the CMD1. Unfortunately no solid theory regarding dust formation in the winds of these stars is currently available. Following the same approach used by Dell’Agli et al. (2018), we arbitrarily assumed a spread in for RSG stars, with . The width of the yellow regions in Fig. 2 correspond to such a spread in 333We use a narrower range of with respect to Dell’Agli et al. (2018), because we considered that the stars in Sextans A are on the average more metal poor than in IC10..
5 The evolved stellar population of Sextans A
To study the evolved stellar population of Sextans A we analyse the position in the observational colour-magnitude planes of the stars belonging to the sample by Jones et al. (2018), based on the evolutionary tracks presented in the previous section.
We first determine a bona fidae distance of the galaxy, by means of the same method applied by Dell’Agli et al. (2018) for IC10. We shift the evolutionary tracks vertically, until achieving overlapping between tracks and observations. In particular, we focus on the diagonal sequence extending to the red side of CMD1 and CMD2, indicated with a cyan shading in Fig. 2, populated by carbon stars. A reasonable match is obtained for a distance of Mpc, in agreement with Dolphin et al. (2003) and McConnachie (2012).
We base the characterization of the individual stars on the position on the CMD1 and CMD2 planes. For the stars with no () flux available, we rely on the CMD1 (CMD2) plane only. The other sources, located inside the cyan (magenta) regions in both planes, were classified as carbon (HBB) stars.
For the stars exhibiting a small degree of obscuration, with () only slightly above (), we mainly relied on their position on the CMD2 plane. This choice is motivated by the arguments discussed in section 4.3: the colour, compared to , is more sensitive to the optical depth in low stars. This criterion was mainly used to characterize HBB stars, because only a small degree of obscuration of these sources is expected in this galaxy, given the small metallicities. In particular, the stars whose position on the CMD2 overlaps with the evolutionary tracks of stars of mass above and/or with the region populated by RSG stars, were classified as HBB or RSG stars, even in the cases, clearly visible in the left panel of Fig. 3, where their colours on the CMD1 are significantly bluer () than the expectations.
We did not classify stars with and , leaving all the possibilities open; the faintest among these objects might descend from low-mass progenitors or from more massive stars currently experiencing a scarce obscuration phase, whereas the brighter objects might be (weak) HBB or RSG stars.
The classification proposed here, based on the above arguments, has some degree of arbitrariness; we cannot rule out that some of the sources which according to our understanding are C-stars or HBB stars were misclassified. However, this uncertainty concerns only objects with a small degree of obscuration, which provide a negligible feedback on the host system, and whose contribution to the overall dust production rate of the galaxy is practically null. This is not going to affect the main conclusions of the present investigation.
Before discussing the results obtained we believe important to stress here that testing our interpretation will require complete photometry at near-IR and mid-IR wavelengths with high spatial resolution; this task will be possible, considering the distance of Sextans A, when the JWST will be finally operative.
We find that sources in the Jones et al. (2018) sample are carbon stars. These objects, which fall within the cyan region in Fig. 3, are indicated with red points and circles. Following the discussion in section 4, we conclude that the progenitors of these sources were stars of mass in the range , formed between Myr and Gyr ago (see Tab.LABEL:tabmod). These stars are currently evolving at luminosities . The repeated TDU episodes experienced made the surface layers to be enriched in carbon, with mass fractions in the range and carbon excess, defined according to Mattsson et al. (2010), .
C-stars trace an obscuration sequence in CMD1 and CMD2. The larger the surface mass fraction of carbon, the higher the size of the dust grains formed, the redder the colour. The circumstellar envelope of these stars hosts solid carbon grains, with size m m, and SiC particles, m sized. As discussed in section 4.2, the latter kind of dust has negligible effects on the IR properties of metal-poor stars. The size of the carbon grains formed partly depends on the choice of the number density () of seeds particles available. In the present work, consistently with previous investigations published on this argument, we assumed . A higher(lower) would favour the formation of smaller (bigger) grains. A thorough discussion on how these choices reflect into the dimension of the carbon particles formed is found in Nanni et al. (2016).
Among the C-stars group, the most interesting sources are the 14 objects with the largest IR excess, with . These objects populate the right side of CMD1, the region delimited by the dashed, vertical line in the left panel of Fig. 3. Note that for only 4 of these stars the flux is available, which confirms the usefulness of the CMD1 plane to study the most obscured C-stars. According to our understanding, in these sources the surface carbon mass fraction is above , with a carbon to oxygen ratio and a carbon excess . They are surrounded by significant quantities of carbon dust, with solid carbon grains of dimensions m m. The fractions of gaseous carbon condensed into dust grains ranges from to .
Moving away from the C-star sequence, we identified objects, indicated with blue squares in Fig. 3, which we interpret as stars currently undergoing HBB; the latter mechanism, as discussed in section 4.2, favours efficient formation of dust in the wind. Most of these sources fall within the magenta box in Fig. 3. Six of these objects lay at the edge between the magenta and the cyan boxes in the CMD2, which makes their classification tricky. We chose to classify these stars as HBB stars, because their fluxes are too large to be C-stars; this classification, which is in agreement with the conclusions by Jones et al. (2018), is however uncertain.
Stars in this group are the progeny of intermediate mass stars, with initial masses above and ages younger than Myr. The surface chemical composition of these objects reflects the effects of HBB at the base of the envelope, with the destruction of carbon by proton capture reactions; given the small metallicities, we also expect some oxygen depletion in the external regions (Ventura et al. 2013, see also Fig. 1). The surface carbon mass fraction is (note that initially it was times higher), whereas the oxygen abundance is , a factor of smaller than in the gas from which the stars formed. These stars are extremely bright, with luminosities of the order of (see tab. LABEL:tabmod), triggered by the ignition of HBB (Blöcker & Schönberner, 1991).
As discussed in section 4, the dust formed in the wind is mainly composed of silicates, which reach sizes of the order of m. The fraction of silicon condensed into dust spans the range (Ventura et al., 2012a). The formation of alumina dust particles, with size m, is also expected in the circumstellar envelope (Dell’Agli et al., 2014; Jones et al., 2014).
The existence of these stars, descending from progenitor of mass in the range , is a clue that significant star formation took place in Sextans A in the last 200 Myr, in agreement with Dolphin et al. (2003).
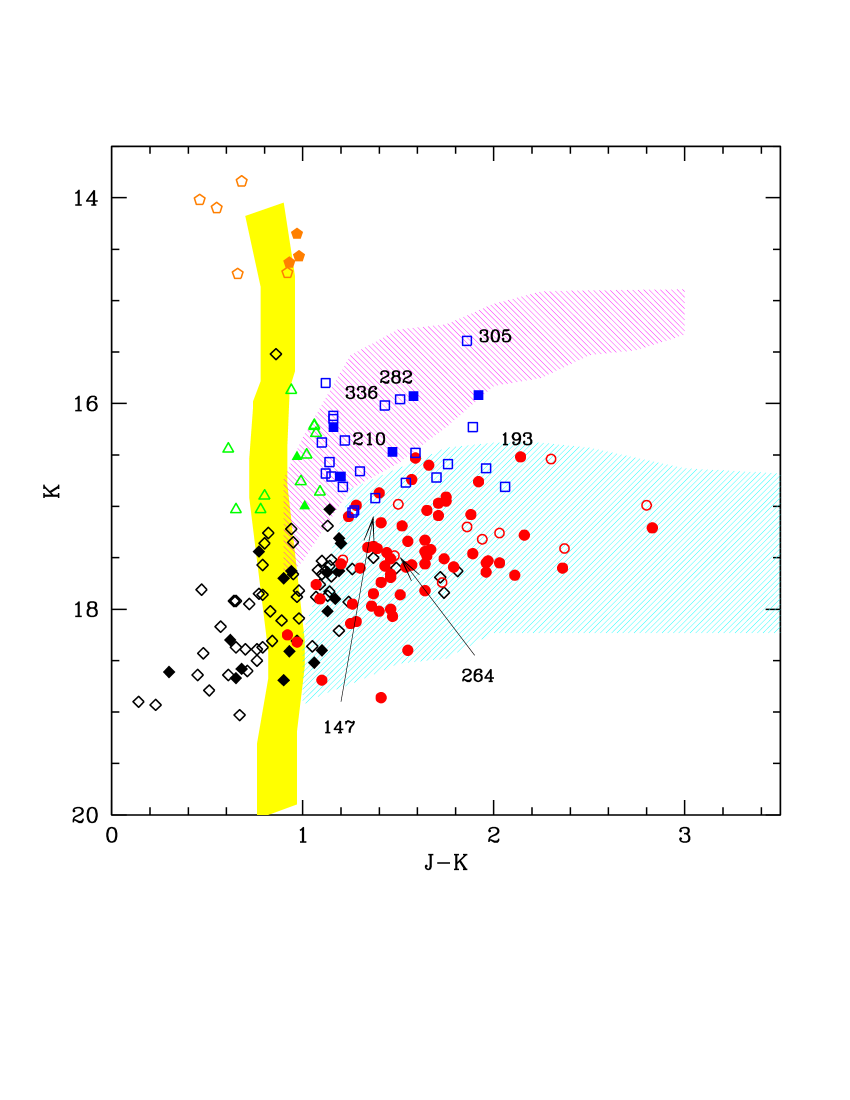
The Jones et al. (2018) sample includes a sub-sample of stars, with a small degree of obscuration, whose and fluxes are sufficiently bright to conclude that they descend from progenitors. Unfortunately in these regions of the CMD1 and CMD2 planes the tracks of no-dusty AGB stars and RSG stars are overlapped; therefore, we leave open the possibilities that these sources, indicated with green triangles in Fig. 3, either descend from progenitors, currently experiencing the initial AGB phases, with little dust in their envelope, or that they are RSG stars, of mass in the range , currently evolving through the core He-burning phase. The analysis of photometric variability or the determination of the chemical composition of these objects from high-resolution spectroscopy would allow a straightforward identification of their nature (García-Hernández, 2017).
The sample by Jones et al. (2018) is completed by faint objects (), which are not expected to provide a significant contribution to the stellar feedback to the galaxy, particularly for what concerns dust production. The characterization of these stars is not trivial, considering that only 88 (84) of them are present in the CMD1 (CMD2) plane. Furthermore, the zones of the observational planes populated by these stars are crossed by the evolutionary tracks of low-mass () stars evolving through AGB, intermediate mass stars during the early AGB phases, and stars in the core helium burning phase. Based on the relative duration of these phases we believe that the majority of these objects descend from low-mass progenitors (), and are currently experiencing the TP phase.
The data available do not allow us to rule out that a fraction of these objects has reached the C-star stage, with a small degree of obscuration. According to Jones et al. (2018) of them are carbon stars.
6 The dust production rate
The characterization of the individual sources belonging to Sextans A, according to the criteria described in the previous section, allows us to provide an estimate of the DPR from each star.
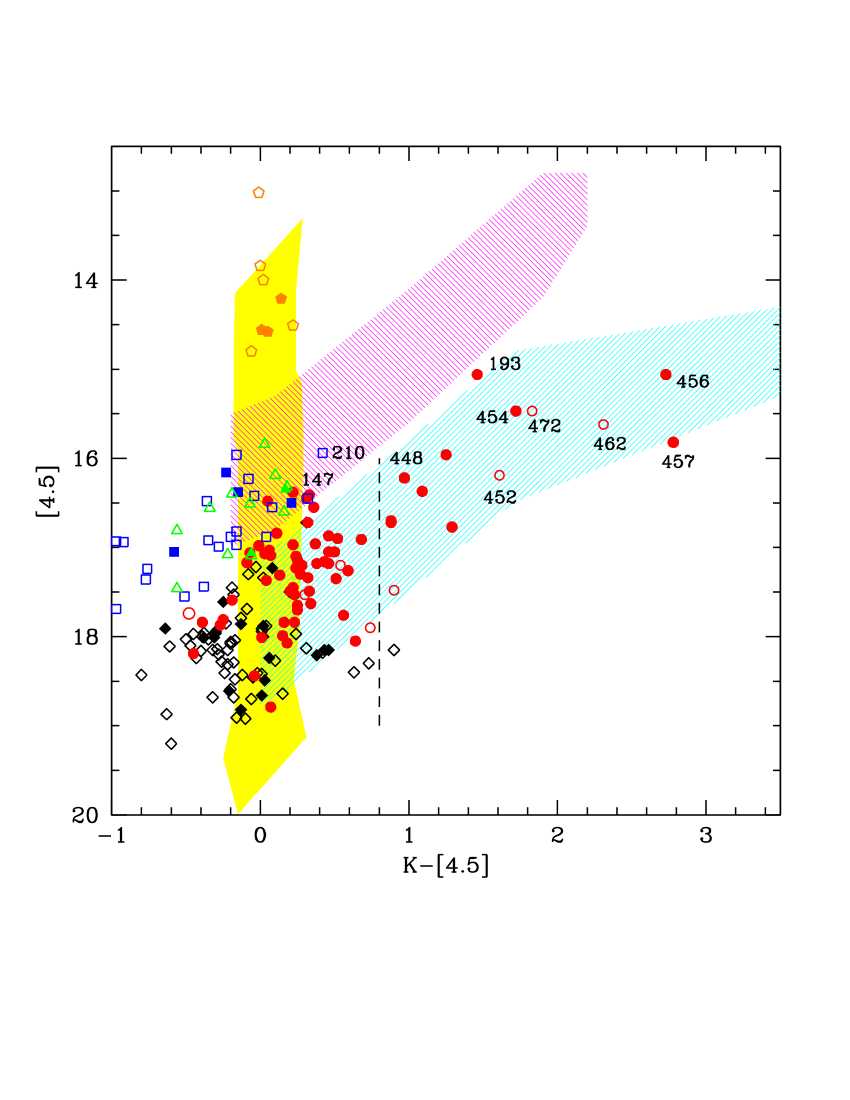
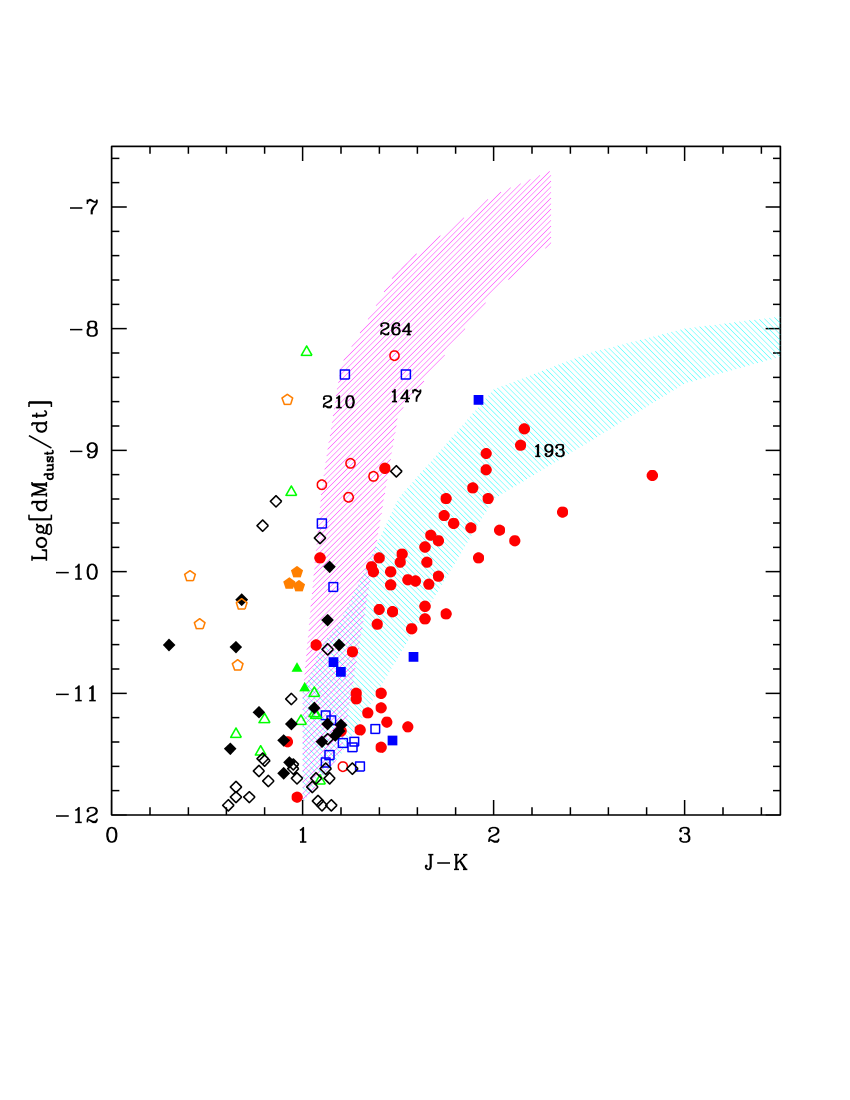
To this aim, we follow the method discussed in Ferrarotti & Gail (2006) (see section 5.2), by which the DPR of a star during a given evolutionary stage is calculated by means of the global gas mass loss rate, the surface chemical composition and the fraction of gaseous molecules condensed into dust particles. In this work we focus on the fraction of carbon and silicon condensed into solid carbon and silicates, respectively. The contribution of the rate of production of silicon carbide and of alumina dust are negligible in all cases. For each evolutionary track the DPR increases with the amount of dust present in the circumstellar envelope, which reflects into the definition of two different, tight relationships between the IR colours and the DPR, holding for C-stars and M-stars. Similarly to the IR fluxes in the different bands (see Fig. 3), we may identify the range of values expected for the DPR of C- and M-stars, as a function of the IR colours. This can be seen in Fig. 4, where we indicate with cyan and magenta shading the values of DPR expected for carbon and M stars, respectively. The vertical extension of the shaded regions at a given colour provides an estimate of the uncertainty associated to the theoretical DPR’s. In the same figure we show the DPR of the individual sources, estimated by Jones et al. (2018). In the comparison of the results obtained in the present analysis with those by Jones et al. (2018), we must consider that the methods followed to estimate the individual DPR are completely different. While we followed the approach described above, the estimates by Jones et al. (2018) are based on the procedure of SED fitting. Therefore, despite the two analysis are based on the same set of optical constants (i.e. Ossenkopf et al. 1992 for silicates, Zubko et al. 1996 for solid carbon, Pegourie 1988 for SiC) it is not surprising that, as we will see, for some stars the results obtained are significantly different.
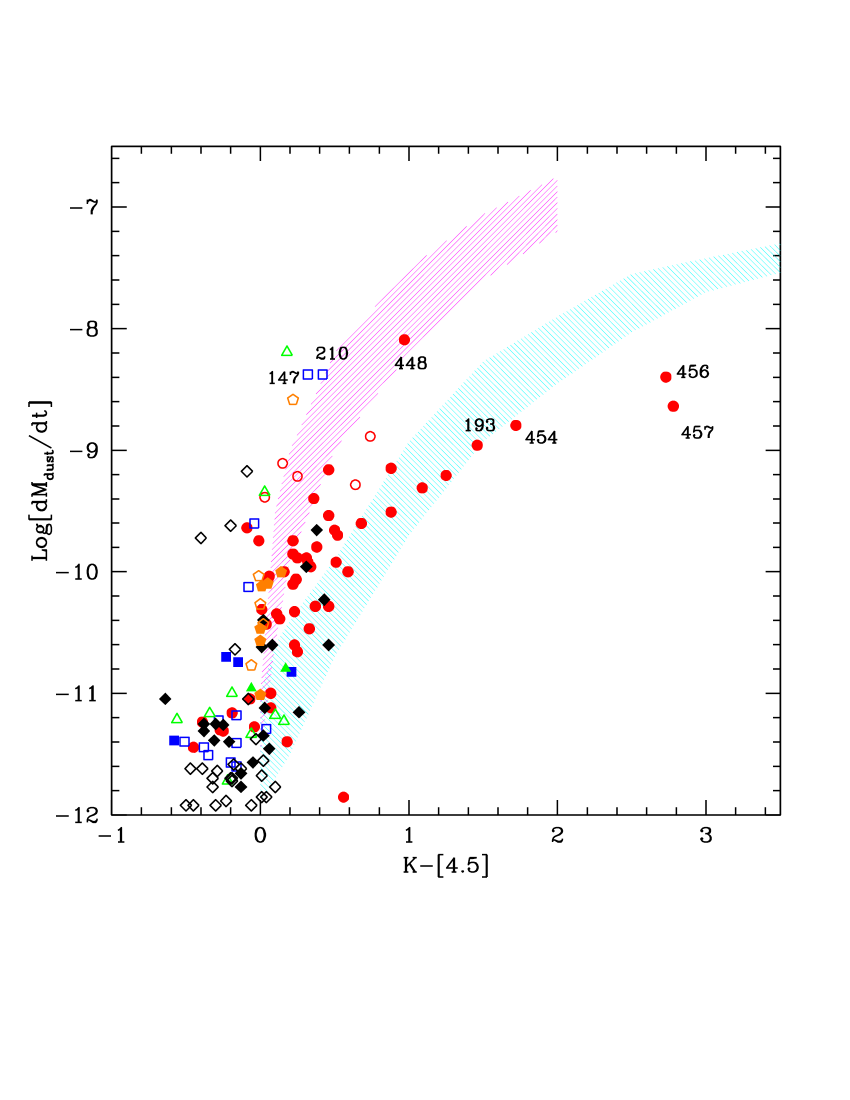
For what concerns carbon stars, the largest DPR are from the stars with the reddest IR colours, particularly the 14 sources on the red side of CMD1, discussed in the previous section, with . These objects, for which we find yr yr, dominate the overall DPR of carbon stars. A significant contribution to the DPR is provided by the stars ID 452, 462, 472, which were classified as M-stars by Jones et al. (2018), whereas according to our understanding they are obscured C-stars. For the other carbon stars, the range of values which we find are in fine agreement with the estimates by Jones et al. (2018). In particular, the stars ID 193 and ID 454, classified as C-stars by Jones et al. (2018), are expected to eject dust at a rate yr, in agreement with our estimates. We believe that the two stars on the right region of the left panel of Fig. 4 (ID 456 and 457) are C-stars, in agreement with Jones et al. (2018); however, based on their colours, we find yr, a factor of 10 higher than Jones et al. (2018).
Turning to M-stars, we find, in agreement with Jones et al. (2018), that ID 147 and ID 210 are characterized by a large DPR, of the order of yr. We also consider ID 305, the brightest source within the M-stars obscuration sequence in the CMD2 (see Fig. 3), for which we estimate yr. This star is extremely interesting, because the position on the CMD2 suggests that it is a massive AGB star, descending from a progenitor. Unfortunately no flux is available, thus we cannot confirm this conclusion on the basis of the CMD1 plane. The sources ID 282 and 336 are also dusty M-stars, with yr. These 5 stars, other than the peculiar cases which will be addressed in the following, provide the vast majority of the overall DPR by M stars, which we find to be yr.
The source ID 17 was identified by Jones et al. (2018) as the one with the largest DPR and was classified as an M star. Unfortunately the flux is not available, thus we must base our interpretation on the and fluxes. The tracks of M stars extend to , significantly bluer than the colour of this star, which is . On the other hand, based on the position in the colour-magnitude plane, we interpret this object as a dusty C-star, descending from a progenitor, in the final AGB phases, when most of the envelope was lost. Interestingly, despite this interpretation is different from the M-star classification by Jones et al. (2018), the estimated DPR, yr, is very similar in the two cases.
| ID | SP | /yr) | SPJ18 | /yr) | |||
|---|---|---|---|---|---|---|---|
| 452 | C | 1.5-2.5 | 5-10 | 8.5-9.2 | M | - | |
| 462 | C | 1.7-2.5 | 5-10 | 8.8-9.2 | M | - | |
| 472 | C | 2-2.5 | 5-10 | 8.5-9.2 | M | - | |
| 193 | C | 1.5-2.5 | 5-10 | 8.7-9.2 | C | ||
| 454 | C | 1.7-2.5 | 5-10 | 8.5-9.2 | C | ||
| 456 | C | 2-2.5 | 5-10 | 9-9.2 | C | ||
| 457 | C | 2-2.5 | 5-10 | 9-9.2 | C | ||
| 147 | M | 3.5-5 | 0.1-0.3 | - | M | ||
| 210 | M | 3.5-5 | 0.1-0.3 | - | M | ||
| 305 | M | 5-7.5 | 0.1-0.3 | - | - | - | |
| 282 | M | 4-5 | 0.1-0.3 | - | - | - | |
| 336 | M | 4-5 | 0.1-0.3 | - | - | - | |
| 17 | C | 2-3 | 5-10 | - | M |
The characterization of the source ID 264 is also cumbersome, given the lack of the data, which leaves the position on the CMD2 as the only possibility to characterize this object. It is classified as M by Jones et al. (2018) at odds with our interpretation, based on the position on the CMD2, which falls within the region populated by C-stars. We estimate a small DPR of the order of yr, significantly different from the estimate by Jones et al. (2018), which include ID 264 among the stars with the highest DPR.
Finally, we consider ID 448. In this case we lack the J magnitude, thus we may only rely on the analysis of the CMD1. The star is located within the C-star sequence, at . According to our analysis the DPR of this star is yr, significantly smaller (by a factor ) than predicted by Jones et al. (2018).
The results of the previous discussion, limited to the stars providing most of the contribution to the global DPR of Sextans A, are reported in table LABEL:tabdpr. For each of the sources considered we give the estimated DPR according to the present analysis, the range of mass of the progenitor and the current surface ratio.
Based on these results, we find that the overall DPR for Sextans A is yr, distributed among C-stars, with yr, and M stars, with yr. The overall DPR given above is in excellent agreement with the results from Jones et al. (2018), whereas it is a factor higher than Boyer et al. (2015b).
A possible source of uncertainties to the above estimate is associated to the stars for which we could not provide any reasonable classification (indicated with open and full diamonds in Fig. 3 and 4), and for the stars whose position in CMD1 and/or CMD2 is at the edge between the M-stars and the C-stars region, whose classification has some degree of arbitrariness (see discussion in section 5). For the first group of stars we estimate that the overall DPR is yr. For the second sample of objects, the estimated DPR is yr. Even in the unlikely case that all these sources have been misclassified, the overall DPR would remain practically unchanged, owing to the significant overlapping of the cyan and magenta zones in Fig. 4, which means that no substantial difference is expected in the DPR of C- and M-stars.
7 The role of a metallicity spread
The analysis presented in the previous sections was based on the assumption that the stars in Sextans A share the same metal-poor chemical composition, corresponding to a metallicity . Because we consider probable the presence of a metallicity spread, we believe important to discuss how the conclusions reached so far might be affected by a change in metallicity. To this aim, we consider models of metallicity and . The latter models were presented in Ventura et al. (2016a). For the stars of initial mass above we used the models by Di Criscienzo et al. (2013); in the low mass domain we calculated ad hoc models specifically for the present investigation.
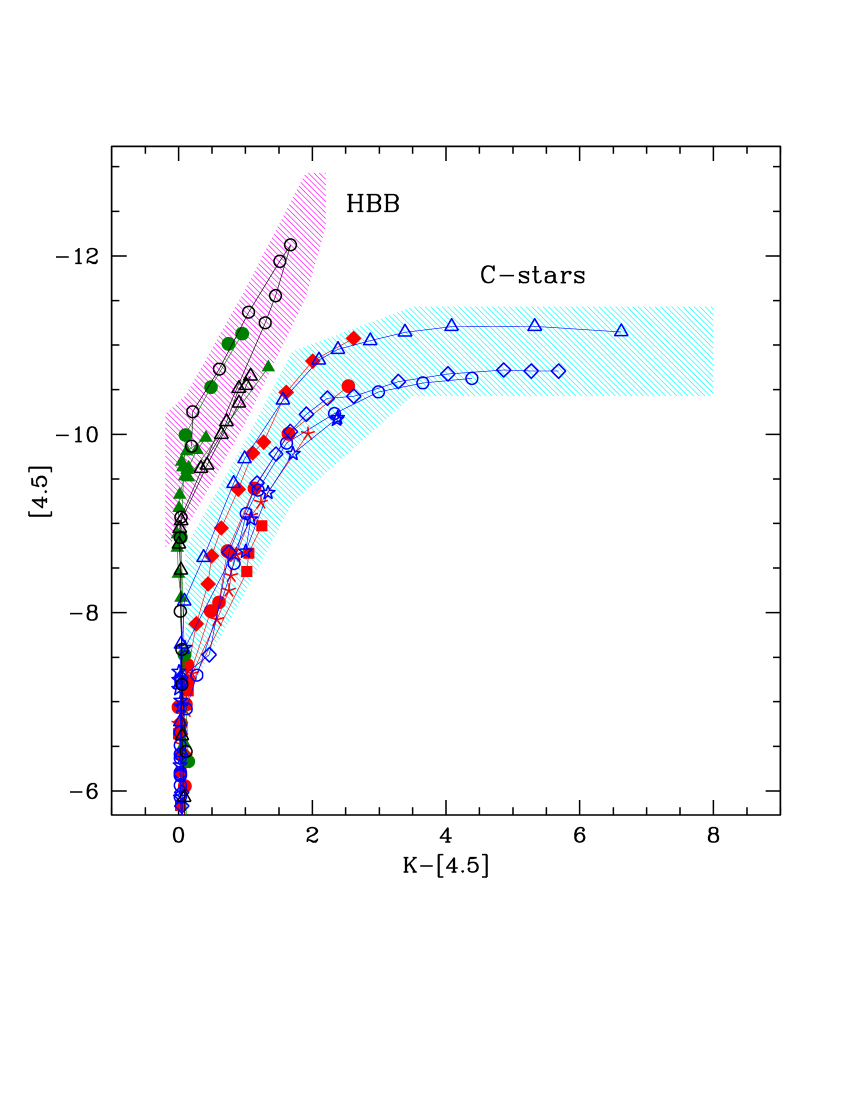
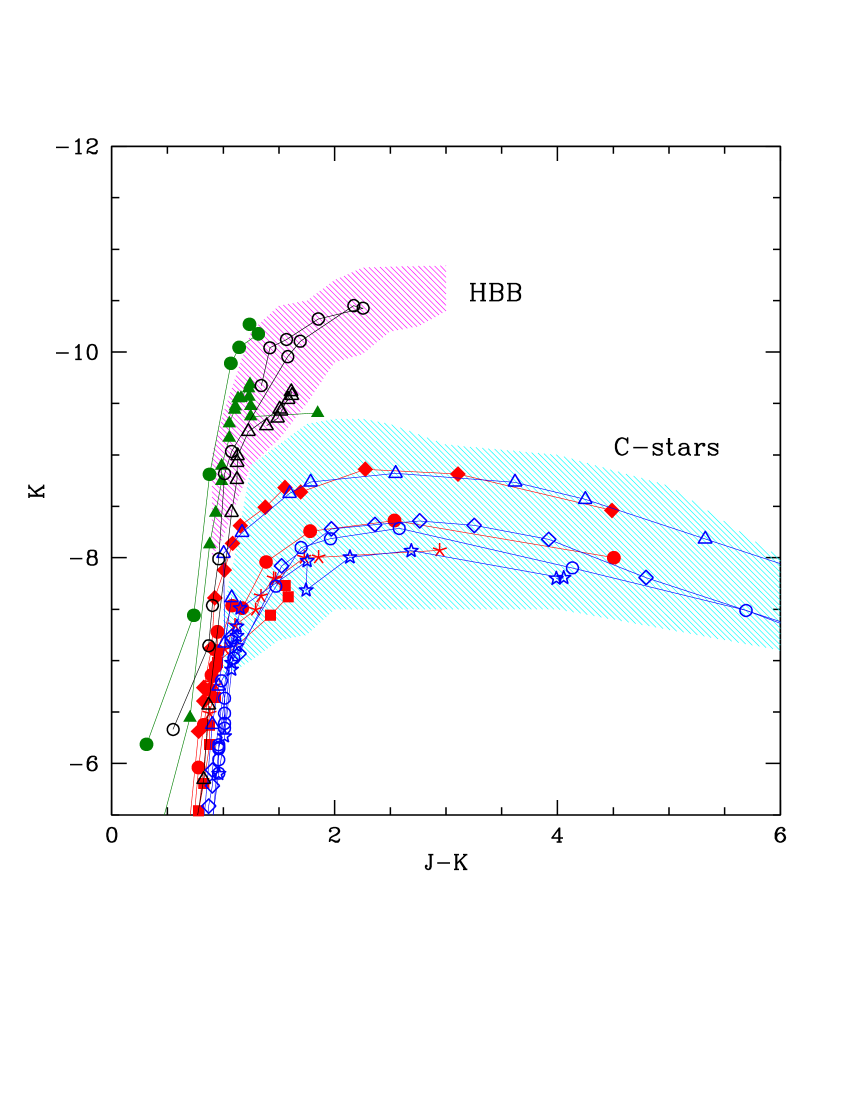
Fig. 5 shows the tracks of stars of different mass in the CMD1 and CMD2 planes. The regions where C-stars and obscured M-stars are expected to evolve have been highlighted, respectively, with cyan and magenta shading, similarly to Fig. 2 and 3.
Regarding obscured C-stars, we find that the magnitudes and the magnitude spread are approximately independent of metallicity; this holds for both the CMD1 and CMD2 planes. This result is motivated by the dominant role played by the core mass in determining the main evolution properties of AGB stars, particularly the extent of the TDU and the ignition and the strength of HBB; because the core mass directly affects the luminosity of the star, it is not surprising that stars in the same evolutionary stage, sharing the same chemical and dust properties, evolve at similar magnitudes.
While the expected IR fluxes of obscured C-stars are fairly independent of the chemical composition, Fig. 5 shows that the metallicity has an effect on the extension of the obscuration sequence, which is shorter the lower is . This result, discussed in Ventura et al. (2014), is due to the higher effective temperatures and smaller radii of lower-Z stars, which favour lower rates of mass loss and of dust grains growth.
The sources in the sample used here extend to and in the CMD1 and CMD2 planes, respectively. This is of little help for an evaluation of the metallicity, because the theoretical sequences reach such IR colours for all the ’s considered. The only exception are ID 456, 457 and 462, for which we rule out that .
The absence of stars with cannot be used as a metallicity discriminator either, because the sample adopted here is limited and those evolutionary phases are extremely rapid, with little possibility that a star is detected (see e.g. Fig. 2 in Dell’Agli et al. (2018)).
While the present analysis shows that this methodology does not allow a robust evaluation of the metallicity of the sources observed, a significant result is that the determination of the distance of the galaxy based on the magnitudes of the C-stars sequence, as described in section 5, is independent of . The same holds for the determination of the DPR, which is essentially related to the IR colours.
For what attains M-stars, we find that little difference exists between the and models, in terms of the extension of the tracks in the CMD1 and CMD2 planes. This is because the higher the metallicity the weaker the strength of HBB (see e.g. Ventura et al. 2013), thus the rate of dust grains formation; this effects counterbalances the higher availability of silicon in the surface regions of the star. The extension of the tracks appear not compatible with the colours of the most obscured M stars, for which we may claim a metallicity .
8 Conclusions
We study the evolved stellar population of the metal-poor galaxy Sextans A, adopting the theoretical description of the structural and evolutionary properties of intermediate mass stars evolving through the AGB phase and of massive stars during the core He-burning stage. The evolutionary tracks in the observational planes obtained with IR fluxes are compared with results from NIR and mid-IR photometry. In particular, we base our analysis on the sources included in a sample of stars in Sextans A, presented recently by Jones et al. (2018).
The simultaneous analysis of the position of the stars in the and planes allowed the identification of C-stars, descending from stars, formed between 500 Myr and 6 Gyr ago. 14 out of these objects are heavily obscured and are interpreted as stars evolving through the late evolutionary phases, surrounded by large quantities of dust, mainly composed of solid carbon particles; we find that the size of these dust grains in the range m, but this result is more uncertain, as it is sensitive to the assumptions made regarding the number density of seed particles available. These stars provide the vast majority of the overall DPR from C-stars, which is of the order of yr.
We also identified stars currently undergoing HBB, descending from progenitors. The presence of these objects confirms that significant star formation took place in Sextans A during the last 200 Myr. According to our interpretation these stars are surrounded by silicate particles of m size and eject into their surroundings dust with a rate of yr. These results need confirmation from hydrodynamical simulations, because silicate particles of similar size, when applied to low-mass stars, can hardly drive a wind.
This study confirms that the combined use of NIR and mid-IR data allow to classify evolved stars, although a more robust classification will be possibile with the future JWST observations. The results regarding dust production confirm that significant amount of dust is produced by AGB stars in metal-poor environments, with a dominant contribution provided by carbon stars.
Acknowledgments
FDA and DAGH acknowledge support provided by the Spanish Ministry of Economy and Competitiveness (MINECO) under grant AYA-2017-88254-P. The authors are indebted to the anonymous referee for the careful reading of the manuscript and for the several comments and suggestions, which helped to improve the quality of the manuscript.
References
- Bertoldi (2003) Bertoldi F., Cox P., Neri R., et al. 2003, A&A, 409, L47
- Bladh & Höfner (2012) Bladh S., Höfner S. 2012, A&A, 546, A76
- Blöcker (1995) Blöcker T., 1995, A&A, 297, 727
- Blöcker & Schönberner (1991) Blöcker T., Schönberner D., 1991, A&A, 244, L43
- Blum et al. (2006) Blum R. D. et al., 2006, AJ, 132, 2034
- Boyer et al. (2011) Boyer M. L., Srinivasan S., van Loon, J. T., et al. 2011, AJ, 142, 103
- Boyer et al. (2015a) Boyer M. L., McQuinn K. B. W., Barmby P., et al. 2015a, ApJS, 216, 10
- Boyer et al. (2015b) Boyer M. L., McQuinn K. B. W., Barmby P., et al. 2015b, ApJ, 800, 51
- Boyer et al. (2015c) Boyer M. L., McDonald I., Srinivasan S., Zijlstra A. van Loon J. T., Olsen K. A. G., Sonneborn G. 2015c, ApJ, 810, 116
- Busso et al. (1999) Busso M., Gallino R., Wasserburg, G. J. 1999, ARA&A, 37, 239
- Calura et al. (2008) Calura F., Pipino A., Matteucci F., 2008, A&A, 479, 669
- Camacho et al. (2016) Camacho I., Garcia M., Herrero A., Simón-Díaz, S. 2016, A&A, 585, A82
- Chieffi & Limongi (2013) Chieffi A., Limongi M. 2013, ApJ, 764, 21
- Cioni et al. (2006) Cioni M.-R. L., Girardi L., Marigo P., Habing H. J. 2006, A&A, 448, 77
- Dell’Agli et al. (2014) Dell’Agli F., Ventura P., García-Hernández D. A., Schneider R., Di Criscienzo M., Brocato E., D’Antona F., Rossi C., 2014, MNRAS, 442, L38
- Dell’Agli et al. (2015a) Dell’Agli F., Ventura P., Schneider R., Di Criscienzo M., García-Hernández D. A., Rossi C., Brocato E. 2015a, MNRAS, 447, 2992
- Dell’Agli et al. (2015b) Dell’Agli F., García-Hernández D. A., Ventura P., Schneider R., Di Criscienzo M., Rossi C. 2015b, MNRAS, 454, 4235
- Dell’Agli et al. (2016) Dell’Agli F., Di Criscienzo M., Boyer M. L., García-Hernández D. A. 2016, MNRAS, 460, 4230
- Dell’Agli et al. (2018) Dell’Agli F., Di Criscienzo M., Ventura P., Limongi M., García-Hernández D. A., Marini E., Rossi C. 2018, arXiv:1806.04160
- Di Criscienzo et al. (2013) Di Criscienzo M., Dell’Agli F., Ventura P., Schneider R., Valiante R., La Franca F., Rossi C., Gallerani S., Maiolino, R., 2013, MNRAS, 433, 313
- Dolphin et al. (2003) Dolphin A. E., Saha A., Skillman E. D., et al. 2003, AJ, 126, 187
- Ferrarotti & Gail (2006) Ferrarotti A. D., Gail H. P. 2006, A&A, 553, 576
- Dwek (1998) Dwek E. 1998, ApJ, 501, 643
- García-Hernández (2017) García-Hernández D. A. 2017, Mem. S. A. It., 88, 336
- Gobat et al. (2018) Gobat R., Daddi E., Magdis G., et al. 2018, Nature Astronomy, 2, 239
- Grevesse & Sauval (1998) Grevesse N., Sauval A. J, 1998, SSrv, 85, 161
- Herwig (2005) Herwig F. 2005, ARA&A, 43, 435
- Herwig (2005) Herwig F., 2005, ARA&A, 43, 435
- Höfner (2008) Höfner S. 2008, A&A, 491, L1
- Jones et al. (2014) Jones O. C., Kemper F., Srinivasan S., McDonald I., Sloan G. C., Zijlstra, A. A. A. 2014, MNRAS, 440, 631
- Jones et al. (2018) Jones O. C., Maclay M. T., Boyer M. L., Meixner M., McDonald I., Meskhidze H. 2018, ApJ, 854, 117
- Kraemer et al. (2017) Kraemer K. E., Sloan G. C., Wood P. R., Jones O. C., Egan M. P. 2017, ApJ, 834, 185
- Karakas & Lattanzio (2014) Karakas A. I., Lattanzio J. C. 2014, PASA, 31, e030
- Mattsson et al. (2010) Mattsson L., Wahlin R., Höfner S. 2010, A&A, 509, A14
- McConnachie (2012) McConnachie A. W. 2012, ApJ, 144, 4
- McDonald et al. (2012) McDonald I., White J. R., Zijlstra A. A., et al. 2012, MNRAS, 427, 2647
- McDonald et al. (2017) McDonald I., Zijlstra A. A., Watson R. A. 2017, MNRAS, 471, 770
- McQuinn et al. (2017) McQuinn K. B. W, Boyer M. L., Mitchell M. B., et al. 2017, ApJ, 834, 78
- Nanni et al. (2013) Nanni A., Bressan A., Marigo P., Girardi L., 2013, MNRAS, 434, 2390
- Nanni et al. (2014) Nanni A. Bressan A. Marigo P. Girardi L., 2014, MNRAS, 438, 2328
- Nanni et al. (2016) Nanni A., Marigo P., Groenewegen M. A. T., et al. 2016, MNRAS, 462, 1215
- Nanni et al. (2018) Nanni, A., Marigo, P., Girardi, L., Rubele S., Bressan A., Groenewegen M. A. T., Pastorelli G., Aringer B. 2018, MNRAS, 473, 5492
- Nenkova et al. (1999) Nenkova M., Ivezić Ž., Elitzur M., 1999, in: LPIContributions 969, Workshop on Thermal Emission Spectroscopy and Analysis of Dust, Disks, and Regoliths, ed. A. Sprague, D. K. Lynch, & M. Sitko (Houston, TX: Lunar and Planetary Institute), 20
- Ossenkopf et al. (1992) Ossenkopf V., Henning T., Mathis J. S. 1992, A&A, 261, 567
- Pegourie (1988) Pegourie B. 1988, A&A, 194, 335
- Pipino et al. (2011) Pipino A., Fan X. L., Matteucci F., Calura F., Silva L., Granato G., Maiolino R., 2011, A&A, 525, A61
- Renzini & Voli (1981) Renzini A., Voli M., 1981, A&A, 94, 175
- Sargent et al. (2011) Sargent B. A., Srinivasan S., Meixner M. 2011, ApJ, 728, 93
- Schneider et al. (2014) Schneider R., Valiante R., Ventura P., Dell’Agli F., Di Criscienzo M., Hirashita H., Kemper F., 2014, MNRAS, 442, 1440
- Srinivasan et al. (2009) Srinivasan S., Meixner M., Leitherer C., et al. 2009, AJ, 137, 4810
- Srinivasan et al. (2010) Srinivasan S., Sargent B. A., Matsuura M., et al. 2010, A&A, 524, A49
- Srinivasan et al. (2011) Srinivasan S., Sargent B. A., Meixner, M. 2011, A&A, 532, A54
- Valiante et al. (2011) Valiante R., Schneider R., Salvadori S., Bianchi S. 2011, MNRAS, 416, 1916
- Ventura et al. (2000) Ventura P., D’Antona F., Mazzitelli I. 2000, A&A, 363, 605
- Ventura et al. (2001) Ventura P., D’Antona F., Mazzitelli I., Gratton R. 2001, ApJ, 550, L65
- Ventura & D’Antona (2005) Ventura P., D’Antona F., 2005, A&A, 431, 279
- Ventura & D’Antona (2009) Ventura P., D’Antona F., 2009, MNRAS, 499, 835
- Ventura et al. (2001) Ventura P., D’Antona F., Mazzitelli I., Gratton R. 2001, ApJL, 550, L65
- Ventura & D’Antona (2011) Ventura P., D’Antona F. 2011, MNRAS, 410, 2760
- Ventura et al. (2012a) Ventura P., Di Criscienzo M., Schneider R., Carini R., Valiante R., D’Antona F., Gallerani S., Maiolino R., Tornambé A., 2012a, MNRAS, 420, 1442
- Ventura et al. (2012b) Ventura P., Di Criscienzo M., Schneider R., Carini R., Valiante R., D’Antona F., Gallerani S., Maiolino R., Tornambé A., 2012b, MNRAS, 424, 2345
- Ventura et al. (2013) Ventura P., Di Criscienzo M., Carini R., D’Antona F., 2013, MNRAS, 431, 3642
- Ventura et al. (2014) Ventura P., Dell’Agli F., Di Criscienzo M., Schneider R., Rossi C., La Franca F., Gallerani S., Valiante R., 2014, MNRAS, 439, 977
- Ventura et al. (2015) Ventura P., Karakas A. I., Dell’Agli F., Boyer M. L., García-Hernández D. A., Di Criscienzo M., Schneider R. 2015a, MNRAS, 450, 3181
- Ventura et al. (2015b) Ventura P., Stanghellini L., Dell’Agli F., García-Hernández D. A., Di Criscienzo, M. 2015b, MNRAS, 452, 3679
- Ventura et al. (2016a) Ventura P., Stanghellini L., Di Criscienzo M., García-Hernández D. A., Dell’Agli F. 2016a, MNRAS, 460, 3940
- Ventura et al. (2016b) Ventura P., Karakas A. I., Dell’Agli F., García-Hernández D. A., Boyer M. L., Di Criscienzo, M. 2016b, MNRAS, 457, 1456
- Ventura et al. (2018) Ventura P., Karakas A., Dell’Agli F., García-Hernández D. A., Guzman-Ramirez, L. 2018, MNRAS, 475, 2282
- Ventura & Marigo (2009) Ventura P., Marigo P., 2009, MNRAS, 399, L54
- Ventura & Marigo (2010) Ventura P., Marigo P., 2010, MNRAS, 408, 2476
- Ventura et al. (1998) Ventura P., Zeppieri A., Mazzitelli I., D’Antona F., 1998, A&A, 334, 953
- Wachter et al. (2002) Wachter A., Schröder K. P., Winters J. M., Arndt T. U., Sedlmayr E., 2002, A&A, 384, 452
- Wachter et al. (2008) Wachter A., Winters J. M., Schröder K. P., Sedlmayr E., 2008, A&A, 486, 497
- Wang et al. (2013) Wang R., Wagg J., Carilli C. L., Walter F., Lentati L., Fan X., Riechers D. A., Bertoldi F., 2013, ApJ, 773, 44
- Weisz et al. (2014) Weisz D. R., Dolphin A. E., Skillman E. D., Holtzman J., Gilbert K. M., Dalcanton J. J., Williams B. F. 2014, ApJ, 789, 147
- Zubko et al. (1996) Zubko V. G., Mennella V., Colangeli L., Bussoletti E. 1996, MNRAS, 282, 1321