The Influence of Canyon Shadowing on Device-to-Device Connectivity in Urban Scenario
Abstract
In this work, we use percolation theory to study the feasibility of large-scale connectivity of relay-augmented device-to-device (D2D) networks in an urban scenario featuring a haphazard system of streets and canyon shadowing allowing only for line-of-sight (LOS) communications in a finite range. We use a homogeneous Poisson-Voronoi tessellation (PVT) model of streets with homogeneous Poisson users (devices) on its edges and independent Bernoulli relays on the vertices. Using this model, we demonstrate the existence of a minimal threshold for relays below which large-scale connectivity of the network is not possible, regardless of all other network parameters. Through simulations, we estimate this threshold to 71.3%. Moreover, if the mean street length is not larger than some threshold (predicted to 74.3% of the communication range; which might be the case in a typical urban scenario) then any (whatever small) density of users can be compensated by equipping more crossroads with relays. Above this latter threshold, good connectivity requires some minimal density of users, compensated by the relays in a way we make explicit. The existence of the above regimes brings interesting qualitative arguments to the discussion on the possible D2D deployment scenarios.
Index Terms:
Device-to-device networks, relays, connectivity, shadowing, continuum percolation, simulationI Introduction
The fifth generation (5G) of mobile networks currently concentrates an intensive research effort covering broad fields such as security, energy consumption, radio communications or resource allocation [1, 2, 3]. One of the main technical challenges of 5G remains to face the exponential growth of mobile data traffic while keeping up with the quality of service (QoS). Device-to-Device (D2D) is deeply investigated in this regard [4]. Coverage extension could also be achieved thanks to multihop D2D networks [5]. This opens the way to crowd networking and uberization of telecommunications networks [6], which represent high economic stakes.
As a matter of fact, studying the technical feasibility of large-scale connectivity of D2D networks seems critical for operators. To this end, resorting to mathematical models amenable to numerical simulations remains a safe and necessary prelude to massive investments. Since the seminal paper [7] of Gilbert, the question of large-scale connectivity in telecommunication networks has mathematically been dealt with using percolation theory [8, 9]. Recent refinements have taken into account various street system models as the support of the network [10].
In this paper, as the main novelty of our work, we consider the canyon effect of shadowing allowing only for line-of-sight (LOS) connections on the streets: only network nodes located on the same street, and whose relative distance is less than a certain threshold can establish communication. We then apply this assumption to an existing street model and study its impact on the connectivity properties of a D2D network using percolation theory.
The main results of this paper are the following ones:
The canyon shadowing assumption, combined with our model for streets and network users, requires the presence of relays located at crossroads in order to achieve connectivity between adjacent streets. We prove that there exists a minimal fraction of crossroads which have to be equipped with relays below which large-scale connectivity of the D2D network cannot be achieved regardless of all other network parameters. Regarding the interplay between the street system and the transmission range of D2D technology, we exhibit two different connectivity regimes for our model: one where large-scale connectivity can solely rely on relays, the other one where a high enough density of users, compensated by relays, is required.
II Related works
In his founding work [7], Gilbert modelled a wireless network by a random graph and interpreted large-scale connectivity as percolation of this graph, i.e. the existence of an infinite connected component with positive probability. However, this first model did not include any geometric features nor propagation effects.
The impact of fading and interference in Gilbert’s model was studied in [11, 12]. In these works, the authors considered new connectivity conditions: a connection between two nodes of the network depends not only on their relative distance anymore, but also on the position of all other nodes of the network through the signal-to-interference plus noise ratio (SINR).
The influence of the geometric features of the considered territories and simulation perspectives have been considered in [10, 13]. In these works, real street systems are fitted by random tessellations, including Poisson-Voronoi tessellations (PVT), more amenable to statistical analysis.
Connectivity for D2D networks on street systems using percolation theory was explored only recently in [14], building on the theoretical results from [15] regarding percolation of Cox models. Very recently, percolation of the SINR graph associated with Cox processes has been studied in [16]. Cox processes cluster their points more than Poisson point processes [17] and, in general, their percolation properties cannot be simply derived by a comparison to this latter model [18]. Our work is also related to [19] where Bernoulli percolation on random tessellations, including PVT, is studied.
Completely different self-similar street systems with canyon shadowing effects have been considered in [20, 21].
Regarding D2D per se, the surveys [6, 22] exhibit a rich variety of use cases for D2D communications. Technical promises and contributions of D2D to 5G networks are investigated in [4]. Many more questions regarding D2D deployment scenarios have been explored [23, 24, 25, 26]. Technical issues related to D2D development are out of the scope of this paper.
III Network Model
We first present the crucial system assumptions and then describe our percolation model of large-scale connectivity for D2D communications.
III-A System assumptions
Several assumptions have been made in our model, either for physical reasons or for the sake of simplicity.
Reflections of the waves on the buildings and the crossroads as well as diffractions on the edges of the buildings were not considered as a first step, for simplicity. Therefore, we modelled the street system as a two-dimensional tessellation.
As in [27], we assume a constant communication radius. This implies that we assume the transmission power of all devices and network relays to be constant and equal to a global common value. We also neglect any interference phenomenon or user mobility. The connectivity mechanism
of our model only allows for LOS communications between a source and a target (whether they are a relay or an actual user equipped with a device): this is the canyon shadowing assumption. This implies that the physical obstacles encountered in our model are sufficiently absorbing to prevent any signal from being transmitted through them. In the context of 5G, where the main part of the useful spectrum consists of very high frequencies, this is indeed the case.
III-B Description of the model
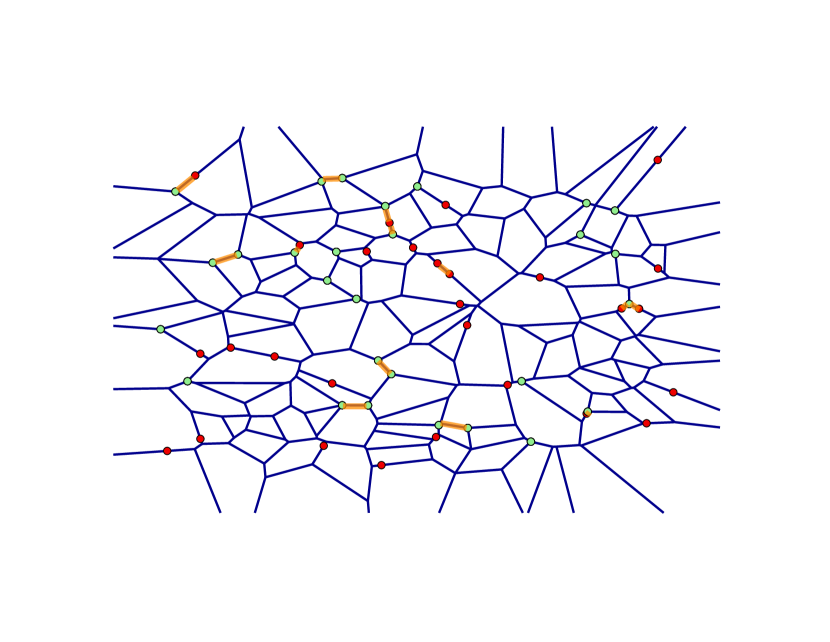
The network model relies on three major elements depicted on Figure 1 and detailed in what follows: the street model, the respective distributions of users and relays and the D2D connectivity mechanism.
III-B1 Street system
First, following [10], we model the street system by a planar Poisson-Voronoi tessellation (PVT) generated by a homogeneous Poisson point process (PPP) in of intensity . We denote by (respectively ) the set of vertices (respectively edges) of . Letting be the total edge length of in any observation window defined by a Borel set , we denote by the total street length per unit area, expressed in km/km2. It is known that [28]. Typical encountered values are for a city center of a classical European major city, while for rural areas. Since is an intrinsic characteristic determined by geographical location, we will consider it to be a fixed parameter of the problem considered here.
III-B2 Devices and relays distribution
Users are equipped with mobile devices and distributed according to a Cox point process driven by the random intensity measure , where is the user intensity expressed in km-1 (the case corresponds to an absence of users and a D2D network only relying on relays placed by operators). Equivalently, whenever , this means that conditioned on any realisation of the street system, is a Poisson point process with mean measure . In particular, for any street segment , the number of users located on is a Poisson random variable with parameter and all users are spread independently and uniformly on .
Network relays are placed on the crossroads of the street system according to a Bernoulli point process of parameter . In other words, for each , a relay is placed at with probability , independently from the state of any other crossroad in .
The point process of users and the one of relays are also assumed to be independent.
III-B3 Connectivity conditions
We assume a constant communication radius (expressed in kilometers) as in [27]. Letting denote the superposition of the users and the relays point processes, two distinct network agents (either relays or users’ devices) are connected by a D2D link if and only if they are in LOS and of relative Euclidean distance smaller than , i.e. :
| (1) |
The network is then represented by the connectivity graph whose vertices are the points of and where an undirected edge is drawn if and only if . Connectivity of the network relying on the possibility of establishing long-range communications, we are thus interested in assessing whether there exists an infinite connected component of the connectivity graph for a given set of model parameters. Some intrinsic scale-invariance properties of our model allow us to reduce the number of these parameters, as presented in what follows.
III-B4 Dimensionless parameters of the model
Similarly to [14], our model features scaling invariances: the Bernoulli process of relays is by definition motion-invariant [29], while changing to for is equivalent to zooming or unzooming to a rescaled simulation window where has changed to and to . Therefore, the two dimensionless parameters and are scale-invariant. It is however physically more interesting to consider the following parameters, which are dimensionless and scale-invariant as well:
| (2) |
Indeed, following [29, Section 9.4], represents the mean number of users per typical edge of the PVT street system, while is the mean number of hops necessary to ensure connectivity of a typical edge of the PVT street system. Note that both depends on the density of the street system and the density of users, while represents the interplay between the street system and the transmission range related to D2D technology. The connectivity graph representing the D2D network will be denoted by .
III-C Simulation method
All of our numerical experiments have been performed using the statistical software R. Since an infinite graph cannot be simulated, we chose a squared simulation window of side , expressed in kilometers. When possible, , a value chosen sufficiently large in practice so as to avoid any effects due to the finiteness of the simulation window. We chose not to simulate on a torus-traced window. Indeed, in [14, 30], the authors showed that simulations on a torus-traced window take much longer time for a very small gain in precision.
For a set of parameters , we first simulate a PVT with the desired parameter . Then, we label each street segment with a unique number. Thereafter, we simulate the corresponding users’ Cox point process
and the relays’ Bernoulli process (recall that is determined by (2) and is given).
Each user is located on a unique street, while each relay is located on a crossroad at the intersection of 3 streets almost surely, see [28]. We assign to each user (respectively each relay) the label of the unique street (respectively the label of the streets) it is located on. As a matter of fact, two network agents are in LOS if and only if they share a common label. Determining all existing connections in an optimized way is thereafter straightforward: arrange the simulated network agents by street segment label, only keep the street segments containing at least two distinct network agents and then, for each street segment, compute the successive distances from one agent to the next one. If only one disconnection
occurs on a given street segment, then it is not necessary to continue the computations for this street segment. We then keep track of the connected components of the simulated graph by using a union-find algorithm, as suggested in [31]. Finally, we declare that the simulated connectivity graph percolates if there exists a left-right or a top-bottom crossing of the simulation window by a connected component. We then repeat this process 100 times (simulations showed that a greater amount of times does not enhance the precision of the results significantly) and are thus able to compute the proportion of simulations where the graph percolates for a given set of parameters .
IV Results
We now present theoretical and numerical results of the study of our model.
IV-A Minimal relay proportion
Our first theoretical result is a minimality condition on for the possibility of percolation of the connectivity graph . To this end, we consider another percolation model: the Bernoulli site percolation model on . In this model, each vertex of is either open (i.e. present) with probability or closed (i.e. absent) with probability . Denote by the subgraph of obtained by only keeping the open vertices of (i.e. ) and the edges of connecting them. As usual, say that percolates if it has an infinite connected component. Define as usual the percolation threshold:
| (3) |
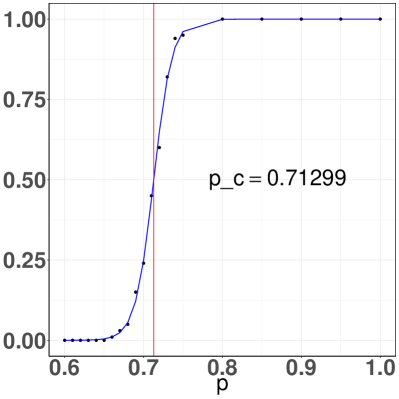
It is known that is independent of and that [19]. Moreover, [32] found the following theoretical estimate: , while [33], using Monte-Carlo simulations with periodic boundary conditions, numerically determines . We also performed Monte-Carlo simulations on our own to check the precision of our simulations. The results are shown in Figure 2(a). A logistic model111Logistic regression consists in estimating parameters and such that where discrete values of are obtained by simulations. seems to fit a good approximation. Since the theoretical curve on an infinite tessellation would be a 0-1 curve with cutoff value by ergodicity, we can reasonably approximate by the abscissa of the inflection point of the logistic curve, yielding:
| (4) |
This is a fairly reasonable approximation for our purposes.
By comparing percolation of the connectivity graph with Bernoulli site percolation on , we obtained the following result:
Theorem 1 (Minimality condition on )
If , then, for all and , the connectivity graph does not percolate, i.e. long-distance multihop D2D communications are not possible.
Proof:
Let . Consider site percolation on with parameter . Then, by (3) the associated graph does not percolate. But since is a subgraph of for all and , the absence of percolation of implies the absence of percolation of . Hence the result. ∎
Remark 1
Theorem 1 has the following practical consequence: an operator willing to constitute a multihop D2D network should equip an important number of crossroads. This represents a heavy investment, which needs to be counterbalanced. Only relying on users’ devices to allow for long-distance connectivity is not a viable option. Finally, note that our result ensures a minimality condition on only. Indeed, we shall see in what follows that there exists a regime of network parameters, such that even when , i.e. all crossroads are equipped with relays, the connectivity graph does not percolate in the absence of users. A matching maximality result on is therefore unthinkable.
(a) (b)
IV-B Relay-limited connectivity
After having proven that there exists a minimal relay proportion under which no large-scale connectivity of the network is possible regardless of all other network parameters, we may wonder whether connectivity of the D2D network can solely rely on relays. Indeed, with the D2D communication range being a physical constraint imposed by the type of D2D technology, in particular the type of the radio link [6], one can think that if there are sufficiently many streets shorter than this range, a sufficiently high proportion of relays could be deployed, allowing for long-range D2D communications even when the user density is low, i.e. . This is indeed the case, as we shall see in what follows.
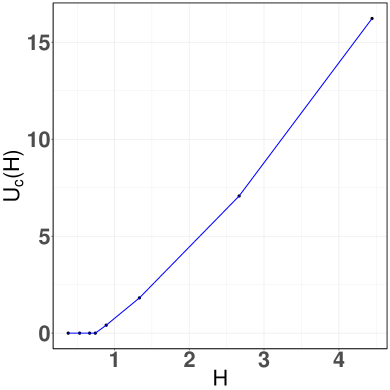
For given , let us consider first the best possible case where all crossroads are equipped with relays, i.e. . If large-scale connectivity without users cannot be achieved when all crossroads are equipped with relays, then it also cannot be achieved for any . Setting , define the following critical value for :
| (5) |
Checking the possibility of percolation in the absence of users is equivalent to verifying whether . This theoretical question can be answered affirmatively using theoretical tools out of the scope of this paper, and we approximate by simulations.
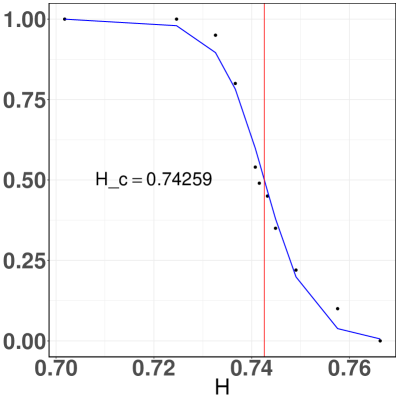
In this regard, we compute, for a grid of values of , the proportion of simulations where the graph percolates. Here, an inverse sigmoid yields a good fitting of the estimated curve, see Figure 2(b). Finally, we recover by the abscissa of the inflection point of the logistic curve and find the following estimate: .
In the remaining part of this section, we investigate the relay-limited connectivity regime (), that is when there is a possibility of percolation in the absence of users. The question is whether we need the complete deployment of relays () for percolation, as assumed in (5). The intuition is that statistically shorter streets (corresponding to ) might require only some proportion of crossroads equipped with relays. In mathematical terms, we define the following critical proportion of relays ensuring percolation of the connectivity graph in the absence of users in the relay-limited connectivity regime :
| (6) |
We already know from Section IV-A that and it can be proved mathematically that for all . Our goal is again to approximate this function by simulation.
The methodology is quite the same as in the previous numerical simulations: this time, for a given and a grid of values of , we compute the proportion of simulations where the graph percolates. Theory tells us that is increasing in (more relays indeed implies more connections, hence making percolation easier to occur) and the logistic model yields again a good fitting of the estimated curve, leading to as the inflection point of the logistic curve. The estimated values are presented in Table I. As can easily be guessed and as is confirmed by our results, is increasing with . We were only able to consider . Below this value the system started having an erratic behaviour not giving any reasonable estimation of . This can be explained by the fact that when approaches 0, approaches and the simulation of the model close to criticality is much trickier.
Remark 2
In practice, operators have leverage on (by equipping more or less crossroads with relays). The results provided in Table I allow them to find an appropriate proportion of relays in function of , which depends both on the D2D technology and the inner geometry of the network. In this table we also relate to the D2D communication range (see (2)) in case of an urban environment by taking . It is worth noticing that the relay-limited connectivity regime () in such an environment implies smaller than 150 meters in most cases. This is a technological threshold which does not seem physically unreachable [5].
| (meters), urban environment | ||
| 0.467 | 0.75 | 142.96 |
| 0.487 | 0.76 | 136.96 |
| 0.503 | 0.77 | 132.60 |
| 0.521 | 0.78 | 127.95 |
| 0.534 | 0.79 | 124.90 |
| 0.548 | 0.80 | 121.72 |
| 0.609 | 0.85 | 109.52 |
| 0.655 | 0.90 | 101.75 |
| 0.702 | 0.95 | 95.03 |
| 1 | 89.78 |
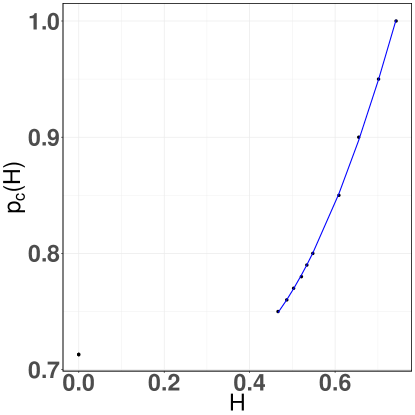
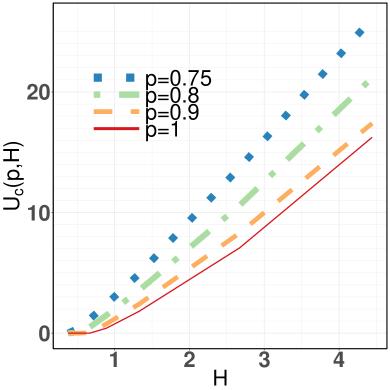
In order to get a continuous approximation of for we interpolate the discrete values given in Table I. We found out that the following quadratic model with the value of the coefficients , and estimated by linear regression , , yields a good fit able to explain 99% of the variance. Fig. 3 illustrates the discrete simulated curve and the estimated quadratic fit for , confirming that a quadratic model is a very good approximation when . We do not have any approximation of for smaller . However, we believe that it drops quickly to the (absolute) minimal relay proportion given by (4).
IV-C Relay-and-user-limited connectivity
The main question arising from the previous section is about what happens when the D2D range and the street system do not allow to reach the critical parameter and thus to solely rely on relays for ensuring large-scale connectivity of the network. In other words, for , is there a critical user density above which long-range communications are possible? If so, which minimal relay proportion is appropriate for ensuring large-scale connectivity with the help of users serving as D2D relays?
As in Section IV-B, for some , let us consider first the case where . If large-scale connectivity relying on both users and relays cannot be achieved when all crossroads are equipped with relays, then it also cannot be achieved for any . Setting and for given , define the following critical value for :
| (7) |
IV-C1 Non-triviality of the critical parameter
On a theoretical perspective, we were able to prove that under sufficiently general conditions, the critical parameter representing the minimal average number of users per typical street allowing for long-range communications is indeed positive and finite. Our result is the following one:
Theorem 2 (Non-triviality of )
There exists a critical value such that whenever we have .
Theorem 2 says that if the streets of the network are long enough compared to the D2D range (), then long-range communications can only be achieved under a sufficiently high (but finite) user density. There is a possible theoretical gap between and the critical value found in Section IV-B, however our simulations suggest that . A rigorous proof of the above result follows the approach developed in [15]. As the goal of this paper is more about giving numerical estimates, and due to space constraints, we only give a rough sketch of the proof.
Proof:
The main problem faced in the study of percolation in a random environment (PVT street system in our case) is the spatial dependence of the environment. By the stabilization property [15] of the PVT, the configuration of the network environment in a given observation window only depends on a bounded region including the observation window with high probability. In other words, if two observed regions of the network are distant enough, they are independent. This allows one to introduce a discretized site percolation process featuring short-range spatial dependencies only. Well-chosen definitions of open and closed sites in the former process allow to ensure that if the discretized process does not percolate, then neither does . Finally using the domination by product measures theorem [34] allows one to conclude that the discretized process does not percolate if is sufficiently small and for some absolute constant ( only depends on the edge length distribution of the edges in a PVT), thus proving that .
Similar techniques are used in the proof of the finiteness of . In this case, we introduce a discrete percolation process chosen so that if the former process percolates, then so does . Crucially relying on the asymptotic essential connectedness [15] of the PVT street system and using again the domination by product measures theorem [34] allows one to conclude that the discretized percolation process percolates if and are sufficiently large. Hence the result. ∎
IV-C2 Numerical estimations of
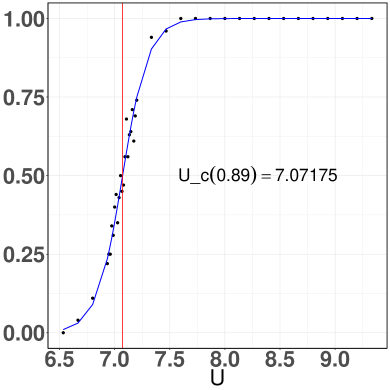
We now estimate the critical values theoretically predicted in Theorem 2. The simulation method used to estimate for given is merely the same as in Sections IV-A and IV-B: for a given and a grid of values for , we simulate a large number of connectivity graphs and compute the proportion of simulations where percolates. Again, a logistic model gives a good fitting of the estimated curve, and we determine by noting the abscissa of the inflection point of the logistic curve. Fig. 4(b) illustrates the estimation of for (corresponding to a D2D range ). Fig. 4(a) provides such estimated values of as a function of . Note that whenever .
(a) (b)
IV-D Critical user density in relay augmented D2D network
From the results in Sections IV-B and IV-C, we have seen that users and relays have to compensate each other to allow for arbitrarily long-range communications on the network whenever . In fact, even when large-scale connectivity can solely be ensured by relays, i.e. , an operator might rather want to invest less in relays and incentivize users to serve as D2D relays. The compromise between relay proportion and user density can be captured by either of the following functions:
-
•
-
•
Both approaches are actually equivalent and choosing either one is just a matter of convenience and practicality for numerical simulations. Indeed, it can mathematically be proven that is a decreasing function of for fixed and can therefore be inverted: this leads back to the critical relay proportion .
Remark 3
The function can be seen by an operator as an indicator of the average number of users needed to successfully deploy a D2D network for a given investment in relays. Note that the function defined in (7) is such that for all . The interest of computing also when relies on the fact that an operator might rather want to rely on its already existing subscribers than on new relays.
In what follows, we shall present some values of for both regimes and .
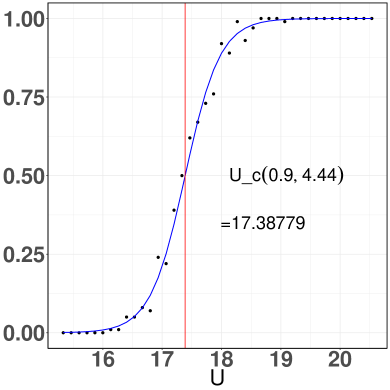
The simulation method used to estimate the critical average number of users is merely the same as in Section IV-C: for given and , and for a grid of values for , we simulate a large number of connectivity graphs and compute the proportion of simulations where percolates. Again, a logistic model gives a good fitting of the estimated curve, and we determine by noting the abscissa of the inflection point of the logistic curve. Fig. 5(b) illustrates an example. Results for estimations of are given in Table II. We also include a comparison with results from [14], where the authors simulated a model similar to ours without any shadowing effects (NoSha), i.e. there are only users on streets distributed according to a Cox process and any two users (being in LOS or not) with reciprocal Euclidean distance less than are connected. It is clear from Table II that the previous estimates from [14] are much smaller than ours: taking the canyon shadowing assumption into account in our model indeed provides more realistic information for operators.
(a) (b)
| NoSha [14] | |||||
|---|---|---|---|---|---|
| 4.44 | 16.23 | 17.39 | 21.17 | 26.09 | 15.87 |
| 2.67 | 7.07 | 8.30 | 10.59 | 13.72 | 7.44 |
| 1.33 | 1.82 | 2.42 | 3.56 | 4.93 | – |
| 0.89 | 0.41 | 0.77 | 1.48 | 2.41 | 1 |
| 0.67 | 0 | 0.03 | 0.51 | 1.17 | – |
| 0.53 | 0 | 0 | 0 | 0.45 | 0.32 |
| 0.38 | 0 | 0 | 0 | 0 | 0.16 |
V Conclusion
We have proposed a percolation model allowing one to study the connectivity of D2D networks in an urban canyon environment. It is based on a Poisson-Voronoi model of streets with canyon shadowing. Poisson users on the edges (streets) and Bernoulli relays on the vertices (crossroads) establish line-of-sight communications of bounded range on the streets.
This model allowed us to observe and quantify the following phenomena: there is a minimal fraction of crossroads to be equipped with relays. Below this proportion, good connectivity of the network (indicated by percolation) cannot be achieved. Moreover, if the mean street length is not too big with respect to the communication range, then a small density of users can be compensated by equipping more crossroads with relays. If not, then good connectivity requires some minimal density of users compensated by the relays in a way explicitly estimated using our model.
While the precise critical values and functions certainly depend on the model, the general qualitative results (existence of the aforementioned regimes) are of more general nature and bring interesting arguments to the discussion on the possible D2D deployment scenarios. In this regard, our work complements [14], which does not take into account any shadowing effects and thus does not predict the strategic necessity of investments into relays located at crossroads to ensure connectivity between adjacent streets. Concerning this necessary investment, observe that the theoretical value of at least equipped crossroads might be smaller in practice. Indeed, in our model, crossroads are punctual. In reality, they have a certain surface and one well-placed regular user could ensure connectivity between adjacent streets. Taking this into account would improve our quantitative predictions and is a track to follow for future work.
Other natural model extensions include more general shadowing, e.g. via introducing two D2D connectivity radii, one for LOS connections, the other for non-line-of-sight (NLOS) connections. Other street system models, such as Poisson-Delaunay tessellations (PDT) or Manhattan grids (MG) could also be considered [10]. Finally, introducing interference effects and user mobility in our model would definitely lead to more realistic predictions.
References
- [1] J. G. Andrews, S. Buzzi, W. Choi, S. V. Hanly, A. Lozano, A. C. Soong, and J. C. Zhang, “What Will 5G Be?” IEEE Journal on selected areas in communications, vol. 32, no. 6, pp. 1065–1082, 2014.
- [2] F. Boccardi, R. W. Heath, A. Lozano, T. L. Marzetta, and P. Popovski, “Five Disruptive Technology Directions for 5G,” IEEE Communications Magazine, vol. 52, no. 2, pp. 74–80, 2014.
- [3] C.-X. Wang, F. Haider, X. Gao, X.-H. You, Y. Yang, D. Yuan, H. Aggoune, H. Haas, S. Fletcher, and E. Hepsaydir, “Cellular Architecture and Key Technologies for 5G Wireless Communication Networks,” IEEE Communications Magazine, vol. 52, no. 2, pp. 122–130, 2014.
- [4] M. N. Tehrani, M. Uysal, and H. Yanikomeroglu, “Device-to-device Communication in 5G Cellular Networks: Challenges, Solutions, and Future Directions,” IEEE Communications Magazine, vol. 52, no. 5, pp. 86–92, 2014.
- [5] X. Lin, J. Andrews, and A. Ghosh, “A Comprehensive Framework for Device-to-Device Communications in Cellular Networks,” arXiv preprint ArXiv:1305.4219, May 2013.
- [6] A. Asadi, Q. Wang, and V. Mancuso, “A Survey on Device-to-Device Communication in Cellular Networks,” IEEE Communications Surveys & Tutorials, vol. 16, no. 4, pp. 1801–1819, 2014.
- [7] E. N. Gilbert, “Random Plane Networks,” Journal of the Society for Industrial and Applied Mathematics, vol. 9, no. 4, pp. 533–543, 1961.
- [8] R. Meester and R. Roy, Continuum Percolation. Cambridge University Press, 1996, vol. 119.
- [9] G. R. Grimmett, Percolation. Springer, 2013.
- [10] C. Gloaguen, F. Fleischer, H. Schmidt, and V. Schmidt, “Fitting of Stochastic Telecommunication Network Models via Distance Measures and Monte-Carlo Tests,” Telecommunication Systems, vol. 31, no. 4, pp. 353–377, 2006.
- [11] O. Dousse, F. Baccelli, and P. Thiran, “Impact of Interferences on Connectivity in Ad Hoc Networks,” IEEE/ACM Transactions on Networking (TON), vol. 13, no. 2, pp. 425–436, 2005.
- [12] O. Dousse, M. Franceschetti, N. Macris, R. Meester, and P. Thiran, “Percolation in the Signal to Interference Ratio Graph,” Journal of Applied Probability, vol. 43, no. 2, pp. 552–562, 2006.
- [13] C. Gloaguen, F. Voss, and V. Schmidt, “Parametric Distance Distributions for Fixed Access Network Analysis and Planning,” in Teletraffic Congress, 2009. ITC 21 2009. 21st International. IEEE, 2009, pp. 1–8.
- [14] E. Cali, N. N. Gafur, C. Hirsch, B. Jahnel, T. En-Najjary, and R. I. Patterson, “Percolation for D2D Networks on Street Systems,” in Modeling and Optimization in Mobile, Ad Hoc, and Wireless Networks (WiOpt), 2018 16th International Symposium on. IEEE, 2018, pp. 1–6.
- [15] C. Hirsch, B. Jahnel, and E. Cali, “Continuum Percolation for Cox Point Processes,” Stochastic Processes and their Applications, 2018, In Press, doi: 10.1016/j.spa.2018.11.002.
- [16] A. Tóbiás, “Signal to Interference Ratio Percolation for Cox Point Processes,” arXiv preprint arXiv:1808.09857, 2018.
- [17] B. Błaszczyszyn and D. Yogeshwaran, “On Comparison of Clustering Properties of Point Processes,” Advances in Applied Probability, vol. 46, no. 1, pp. 1–20, 2014.
- [18] ——, “Clustering and Percolation of Point Processes,” Electron. J. Probab, vol. 18, no. 72, pp. 1–20, 2013.
- [19] S. Ziesche, “Bernoulli Percolation on Random Tessellations,” arXiv preprint arXiv:1609.04707, 2016.
- [20] P. Jacquet and D. Popescu, “Self-similarity in Urban Wireless Networks: Hyperfractals,” in Modeling and Optimization in Mobile, Ad Hoc, and Wireless Networks (WiOpt), 2017 15th International Symposium on. IEEE, 2017, pp. 1–6.
- [21] ——, “Self-similar Geometry for Ad-Hoc Wireless Networks: Hyperfractals,” in International Conference on Geometric Science of Information. Springer, 2017, pp. 838–846.
- [22] P. Gandotra and R. K. Jha, “Device-to-device Communication in Cellular Networks: A Survey,” Journal of Network and Computer Applications, vol. 71, pp. 99–117, 2016.
- [23] G. Fodor, E. Dahlman, G. Mildh, S. Parkvall, N. Reider, G. Miklós, and Z. Turányi, “Design Aspects of Network Assisted Device-to-device Communications,” IEEE Communications Magazine, vol. 50, no. 3, 2012.
- [24] P. Janis, V. Koivunen, C. Ribeiro, J. Korhonen, K. Doppler, and K. Hugl, “Interference-aware Resource Allocation for Device-to-device Radio Underlaying Cellular Networks,” in Vehicular Technology Conference, 2009. VTC Spring 2009. IEEE 69th. IEEE, 2009, pp. 1–5.
- [25] C.-H. Yu, K. Doppler, C. B. Ribeiro, and O. Tirkkonen, “Resource Sharing Optimization for Device-to-device Communication Underlaying Cellular Networks,” IEEE Transactions on Wireless communications, vol. 10, no. 8, pp. 2752–2763, 2011.
- [26] X. Lin, J. Andrews, A. Ghosh, and R. Ratasuk, “An Overview of 3GPP Device-to-device Proximity Services,” IEEE Communications Magazine, vol. 52, no. 4, pp. 40–48, 2014.
- [27] I. Glauche, W. Krause, R. Sollacher, and M. Greiner, “Continuum Percolation of Wireless Ad Hoc Communication Networks,” Physica A: Statistical Mechanics and its Applications, vol. 325, no. 3, pp. 577–600, 2003.
- [28] A. Okabe, B. Boots, K. Sugihara, and S. N. Chiu, Spatial Tessellations: Concepts and Applications of Voronoi Diagrams. John Wiley & Sons, 2009, vol. 501.
- [29] S. N. Chiu, D. Stoyan, W. S. Kendall, and J. Mecke, Stochastic Geometry and Its Applications. John Wiley & Sons, Jun. 2013.
- [30] S. Mertens and C. Moore, “Continuum Percolation Thresholds in Two Dimensions,” Physical Review E, vol. 86, no. 6, p. 061109, 2012.
- [31] M. E. Newman and R. M. Ziff, “Fast Monte Carlo Algorithm for Site or Bond Percolation,” Physical Review E, vol. 64, no. 1, p. 016706, 2001.
- [32] R. A. Neher, K. Mecke, and H. Wagner, “Topological Estimation of Percolation Thresholds,” Journal of Statistical Mechanics: Theory and Experiment, vol. 2008, no. 01, p. P01011, 2008.
- [33] A. M. Becker and R. M. Ziff, “Percolation Thresholds on Two-dimensional Voronoi Networks and Delaunay Triangulations,” Physical Review E, vol. 80, no. 4, p. 041101, 2009.
- [34] T. M. Liggett, R. H. Schonmann, A. M. Stacey et al., “Domination by Product Measures,” The Annals of Probability, vol. 25, no. 1, pp. 71–95, 1997.