PHENIX results on collectivity in small systems
Sylvia Morrow for the PHENIX Collaboration111See acknowledgements of Refs. [1, 2, 3] for support.
Department of Physics and Astronomy
Vanderbilt University, Nashville, TN 37235, USA
PHENIX has measured elliptic and triangular flow of charged hadrons in HeAu collisions at a center-of-mass energy of 200 GeV per nucleon pair, and elliptic flow in Au collisions at 200, 62.4, and 39 GeV. In order to asses the origin of collectivity in the smallest systems, these results are compared with several theoretical models that produce azimuthal particle correlations based on initial and/or final state effects. Hydrodynamical models, which include the formation of a droplet of quark-gluon plasma, provide the best simultaneous description of our observations.
PRESENTED AT
Thirteenth Conference on the Intersections of Particle and Nuclear Physics
Palm Springs, CA, USA, May 28 – June 3, 2018
1 Introduction
Heavy-ion collision experiments, such as PHENIX, detect the particles produced when two nuclei collide at relativistic energies. It has been established that there are many features of this outgoing particle distribution which can be explained by the presence of a strongly coupled fluid called a quark-gluon plasma (QGP). There is a class of collision systems called “small systems” in which one or both of the colliding nuclei have very few nucleons.
An original motivation for collecting small systems data was to provide a measurement of cold nuclear matter effects which could be contrasted with larger systems which had a combination of hot and cold nuclear matter effects. However, among the fraction of small systems collisions where the impact parameter was small, these data were found to have produced particle distributions with features that suggested the presence of QGP. As such, the origin of collectivity in small systems has been an ongoing debate.
2 Experiment
The distribution of particles collected by the PHENIX detector during heavy-ion collisions is influenced by many factors, including the presence (or absence) of QGP, the distribution of the partons or nucleons which participated in the collision, and the collision species. The azimuthal distribution of the produced particles can be written as
| (1) |
where is the order coefficient to the expansion, is the order symmetry plane angle determined on an event-by-event basis, and is the azimuthal angle of a detected particle. We measure in the event plane detector which is in a different region of phase space than the particles of interest. This offers a simple observable in the form of the coefficients to the Fourier expansion, .
In practice there are several methods for calculating the coefficients. Here we show results using the event plane method [6] which finds to be
| (2) |
where Res() is the event plane resolution calculated using the three-subevent method.
3 Results
3.1 Beam energy scan
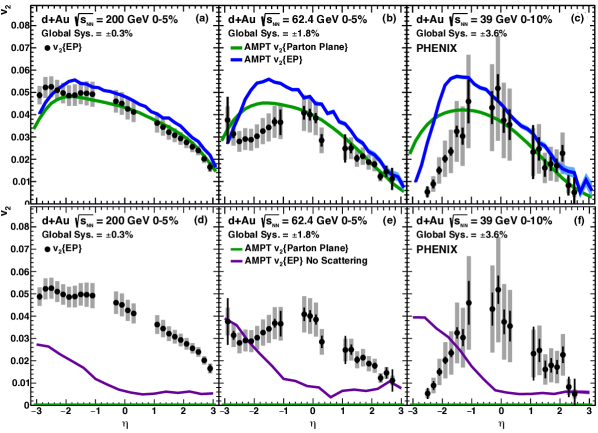
In 2016, PHENIX collected data from Au collisions at = 200, 62.4, 39, and 19.6 GeV. Fig. 1 shows measurements of the second order flow coefficient, , from these top three energies measured as a function of the pseudorapidity, [1]. The shape of this distribution differs between energies in the region closest to the event plane detector (). At backward rapidity () the signal is largest for = 200 GeV. In contrast, the distribution at forward rapidity () is roughly the same for all energies. At the lowest energy, is roughly symmetric so as the the collision energy increases and only one side of the distribution changes, the distribution becomes increasingly asymmetric.
The theory curves in Fig. 1 are ampt calculations analyzed using the parton plane and the event plane. The parton plane is calculated directly from the distributions of participating partons in each event, so we describe it as a pure flow signal. In contrast, the event plane calculation extracts this distribution from the final state particle distribution which is what we have experimentally accessible, offering a more direct comparison to the measurement. This calculation, therefore, includes any nonflow contributions which may enter the signal as a result of the analysis method limitations. As such, we consider this the combined flow and nonflow signal.
The top panels of Fig. 1 show that in forward rapidity regions, where the nonflow contribution to the measurement is small, the parton plane calculation is in excellent agreement with the data, and the event plane calculation is reasonable though systematically a bit too large. At backward rapidity the calculations diverge from the measurement, though the event plane calculation may be qualitatively more similar. More notably, in this rapidity regions there is a cross over between the two ampt calculations suggesting that the relationship between flow and nonflow is not simply additive.
This feature is emphasized by the bottom panels of Fig. 1 which compares the measurement to ampt calculations where both partonic and hadronic scattering has been turned off. We see that the “pure flow” as found using the parton plane is zero; therefore, the event plane calculation here is exclusively nonflow. The value of in panels d-f is largest at backward rapidity and cannot simply be added to in panels a-c to yield the combined flow and nonflow calculation, in panels a-c.
3.2 Identified particle flow
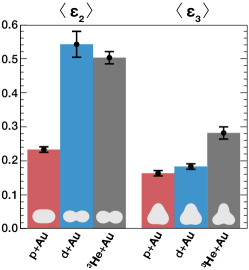

The second order flow coefficient, , was measured for identified pions and protons. The shape of is different depending on the mass of the particle as well as the initial collision geometry seen by comparing Au, Au, and 3HeAu collisions [2]. The left panel of Fig. 2 shows the shape of the average initial spatial distribution of HeAu collisions, quantified as order eccentricity terms where the cartoon insets demonstrate the degree of ellipticity () and triangularity ().
The right panel of Fig. 2 displays the temperature evolution of a collision system according to the hydrodynamical model sonic for a characteristic collision in each of the three collision systems, HeAu. As the hot medium cools the particle distribution expands translating the initial spatial distribution into a velocity or momentum distribution.
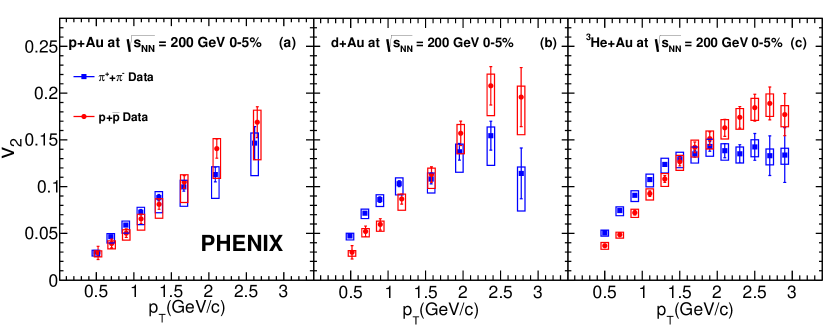
The measurement shown in Fig. 3 is consistent with the hydrodynamic picture of the hadrons being part of a common velocity field. Protons are much heavier than pions, so they have a different momentum distribution than pions in the same collision events. Across all three collision systems a general pattern emerges: at low (below GeV/c) the pion is larger than the proton and at high (above GeV/c) the proton is larger than the pion .
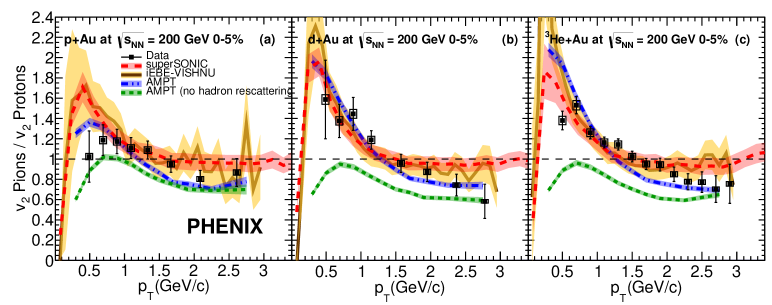
This trend can also be observed in the ratio of the pion over the proton , as seen in Fig. 4. The ratio emphasizes the differences between the distributions of the two different hadrons and allows some uncertainty to cancel. Fig. 4 also compares these measurements to several model calculations. The hydrodynamic models shown, supersonic and iEBE-VISHNU, are in reasonable agreement with the data at low , but fail being completely flat above GeV/c. In contrast, the ampt calculations shown are qualitatively better than the hydrodynamics calculations at high , but do not describe the low slope when hadronic rescattering is turned off. This feature suggests that within the parton scattering framework, hadronic rescattering is essential to the formation of low mass splitting. This result also suggests that the difference in the treatment of hadronization is important to the formation of high mass splitting, as the hydrodynamical models use Cooper-Frye prescription and ampt uses quark recombination.
3.3 Inclusive charged hadron flow
A measurement of the second and third order flow coefficients for inclusive charged hadrons is shown in Fig. 5. As was shown in the left panel of Fig. 2, there is a distinct ordering of across the three collision systems, HeAu.
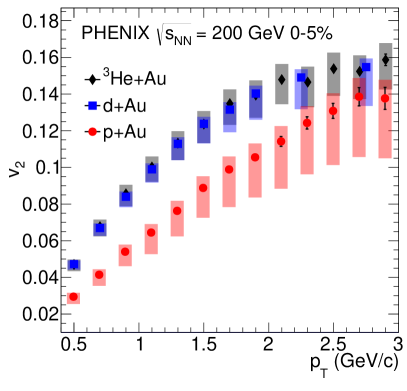
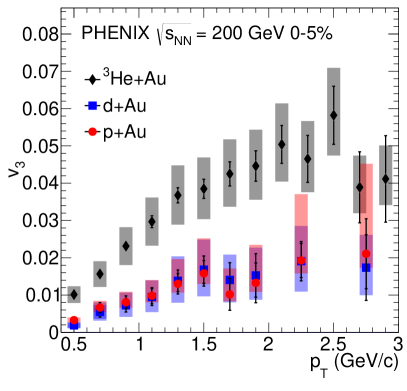
For the second order, which matches the result shown in the left panel of Fig. 5, . For the third order, which matches the result shown in the right panel of Fig. 5, . This ordering is in agreement with a direct and efficient translation of the initial spatial distribution () to the final momentum distribution ().
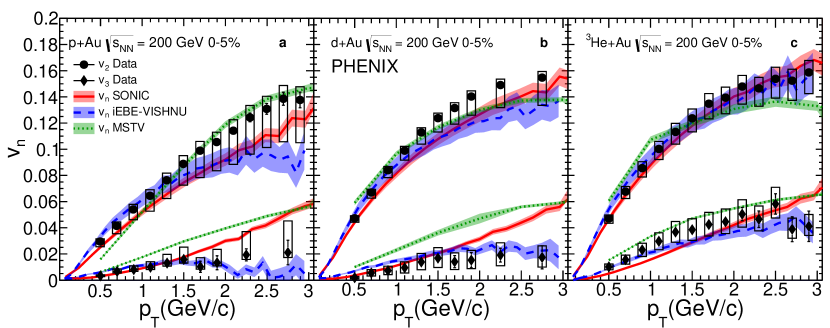
For a more direct comparison, Fig. 6 shows the and measurements compared to calculations from several models. sonic and iEBE-VISHNU, which are both hydrodynamic models, are in good agreement with the and measurements in the three collision systems that have significantly different initial geometries. MSTV is a postdiction in the initial momentum correlation framework. While it has some success for , in Au and Au collisions are calculated to be significantly too large. Since the presentation of this talk at CIPANP, a detailed statistical analysis of the data to theory comparison has been performed which concludes that the hydrodynamics offers the best simultaneous description of the data [3].
4 Conclusion
These proceedings shows new PHENIX results from small-systems collisions offering new insight into the relationship between the initial state and the final state and how flow signals change with beam energy. It also highlights the complexity of the topic and the interplay of different physics mechanisms. The combination of all results shown here are best described by hydrodynamical models.
References
- [1] C. Aidala, et al., Measurements of azimuthal anisotropy and charged-particle multiplicity in Au collisions at 200, 62.4, 39, and 19.6 GeV, Phys. Rev. C96 (6) (2017) 064905. arXiv:1708.06983, doi:10.1103/PhysRevC.96.064905.
- [2] A. Adare, et al., Measurements of mass-dependent azimuthal anisotropy in central Au, Au, and 3HeAu collisions at GeV, Phys. Rev. C97 (2018) 064904. arXiv:1710.09736, doi:10.1103/PhysRevC.97.064904.
- [3] C. Aidala, et al., Creating small circular, elliptical, and triangular droplets of quark-gluon plasma arXiv:1805.02973.
- [4] C. Aidala, et al., Measurement of long-range angular correlations and azimuthal anisotropies in high-multiplicity Au collisions at GeV, Phys. Rev. C95 (3) (2017) 034910. arXiv:1609.02894, doi:10.1103/PhysRevC.95.034910.
- [5] A. Adare, et al., Measurements of elliptic and triangular flow in high-multiplicity 3HeAu collisions at GeV, Phys. Rev. Lett. 115 (14) (2015) 142301. arXiv:1507.06273, doi:10.1103/PhysRevLett.115.142301.
- [6] A. M. Poskanzer, S. A. Voloshin, Methods for analyzing anisotropic flow in relativistic nuclear collisions, Phys. Rev. C58 (1998) 1671–1678. arXiv:nucl-ex/9805001, doi:10.1103/PhysRevC.58.1671.
- [7] C. Aidala, et al., Measurements of Multiparticle Correlations in Collisions at 200, 62.4, 39, and 19.6 GeV and Collisions at 200 GeV and Implications for Collective Behavior, Phys. Rev. Lett. 120 (6) (2018) 062302. arXiv:1707.06108, doi:10.1103/PhysRevLett.120.062302.